Energy economics: an overview?

This data-file provides an overview of energy economics, across 175 different economic models constructed by Thunder Said Energy, in order to put numbers in context. This helps to compare marginal costs, capex costs, energy intensity, interest rate sensitivity, and other key parameters that matter in the energy transition. Our top five facts follow below.


This data-file model provides summary economic ratios from our different economic models across conventional fuels, conventional power, renewables, lower-carbon fuels, manufacturing processes, infrastructure, transportation and nature-based solutions.

For example, EBIT margins range from 3-70%, cash margins range from 4-80% and net margins range from 2-50%, hence you can use the data-file to ballpark what constitutes a “good” margin, sub-sector by sub-sector; and to screen different industries, according to the capital intensity, opex costs and resultant profitability (chart below).

Capital intensity ranges from $300-9,000kWe, $5-7,500/Tpa and $4-125M/kboed. So if you are trying to ballpark a cost estimate you can compare it with the estimated costs of other processes. The median average industry has a capex cost of $750/Tpa (chart below).

Capital intensity of different energy sources also varies by an order of magnitude (chart below). Each $1 dollar that is disinvested from new hydrocarbon capex ideally needs to be replaced by $25 invested in wind and solar, in order to add the same amount of primary energy to the global energy system (chart below, note here).

Economies of scale are visible in the data-file, across our models of Air Separation, Cables, Comminution, Compressors, Electric Motors, Electrowinning, Fans, Flotation, Gas Dehydration, Harmonic Filters, Heat Exchangers, Inverters, Motor Drivers, Pumps, Rankine Engines, Tanks and Turbines. Generally, making these units 10x larger reduces their unit costs by around 45%.

Cost reduction from scale for different energy technologies.

Interest rate sensitivity is visible in our overview of energy economics. Each 1% increase in capital costs re-inflates new energies 10-20%, infrastructure 2-20%, materials 2-6%, and conventional energy 2-5% (chart below, note here).

Marginal cost inflation per 1% WACC increase for different energy technologies, materials, and infrastructure projects.

The energy intensity of materials is visible across our models of Acetylene, Aluminium, Ammonia, Carbon Fiber, Cement, Copper, Cyanides, Desalination, Glass, H2O2, Hydrogen, Industrial Gases, Lithium Batteries, Methanol, NaOH/Cl2, Nitric Acid, Paper, Plastics, Silicon, Silver, Steel, Wood Products. As a rule of thumb, energy is 50% of the cash cost of typical materials.

Renewables stand out. Despite high capital intensity (35% of revenues, 2x the average), once constructed, they also have the highest cash margins (75%, also 2x the average). The rise of wind, solar and electrification make capex costs and capital costs increasingly important.

The full data are available in the data-file below. However, please be aware that this is simply a compilation of headline figures across our library of 175 economic models. Access to all of the underlying models is covered by a Thunder Said Energy subscription.

Hydrogen: overview and conclusions?

Hydrogen best opportunities?

The best opportunities for hydrogen in the energy transition will be to decarbonize gas at source via blue and turquoise hydrogen, displacing ‘black hydrogen’ that currently comes from coal, and to produce small-scale feedstock on site via electrolysis for select industries. Some see green hydrogen becoming widespread in the future energy system. We think there may be options elsewhere, to drive more decarbonization, with lower costs, lower losses and higher practicality.


(1) Green hydrogen economy? Our main question mark is over “economy”. Costs are modeled at $7/kg, equivalent to $70/mcf natural gas, after generating renewable electricity, electrolysing water into hydrogen and storing the hydrogen. Levelized costs of electricity then reach 60-80c/kWh, for generating clean electricity in a fuel cell power plant, yielding a CO2 abatement cost of $600-1,200/ton (note here). We think costs matter in the energy transition and the entire world can be decarbonized via other means, for an average cost of $40/ton in the TSE roadmap to net zero.

(2) Fuels derived from green hydrogen are by definition going to be more expensive than the hydrogen itself. We have evaluated electro-fuels, green methanol, sustainable aviation fuels, hydrogen trucks, again finding CO2 abatement costs above $1,000/ton. Again, we think transportation can be decarbonized cost-effectively via other means.

(3) How much can capex costs come down? There is an aspiration for electrolyser costs (presently around $1,000/kW on a full, installed basis) to deflate by over 75%. However, we have reviewed electrolyser costs line by line and wonder whether 15-25% deflation is more realistic (note here). Alkaline electrolysers vs PEMs are contrasted here. We have recently screened NEL’s patents to explore future cost deflation in electrolysers.

(4) Efficiency: the second law of thermodynamics. The absolute magic of renewables and electrification is their thermodynamics. These technologies can be 85-95% efficient end-to-end, precisely controlled, and ultra-powerful. A world-changing improvement on heat engines and an energy mega-trend for the 21st century. However, the thermodynamics of hydrogen depart from the trend, converting high-quality electricity back into a fuel. The maximum theoretical efficiency of water electrolysis is 83% (entropy increases). Real world electrolysers will be c65% efficient. End-to-end hydrogen value chains will be c30-50% efficient. We want to decarbonize the global energy system. It therefore seems strange to take 100MWH of usable, high-grade, low-carbon electricity, and convert it into 40MWH of hydrogen energy, when you could have displaced 100MWH of high-carbon electricity directly (e.g., from coal). And all the more so, amidst painful energy shortages.

(5) Backing up renewables? It is often argued that renewables will eventually become so abundant, especially during windy/sunny moments, that the inputs to hydrogen electrolysers will become free. We think this is a fantasy. Instead, industrial facilities and consumers will demand shift. Conversely, we are not even sure an electrolyser can run off of a volatile renewables input feed without incurring 5-10% pa degradation, or worse (if you read one TSE note on green hydrogen, we recommend this one).

(6) Operations, transport, logistics all feel strangely challenging. Our studies of patents suggest that electrolysers and fuel cells can be the Goldilocks of energy equipment. Past installations have declined at over 5% per year. Due to its small molecular size, 35-75% of hydrogen produced in today’s reformers can be lost. Some vehicles seek to store hydrogen fuel at 10,000 psi, which is 1.5x the pressure of hydraulic fracturing. Even in the space industry, rocket makers have been de-prioritizing hydrogen in favor of LNG (!) because of logistical issues. The costs of hydrogen transport will be 2-10x higher than comparable gas value chains, while up to 50% of the embedded energy may be lost in transportation: our overview into hydrogen transport is here, covering cryogenic trucks, hydrogen pipelines, pipeline blending, ammonia and toluene. Is a hydrogen truck really comparable with a diesel truck? (note here, models here). Finally, the gas industry is bending over backwards to stem methane leaks, due to methane’s GWP of 25x CO2, but hydrogen itself may have a GWP as high as 13x CO2.

(7) Will policy help? We are not sure. We are tempted to draw analogies to the Synthetic Fuels Corporation, bequeathed $88bn of US government money in 1980 amidst the oil shocks, which in today’s money is similar to the $325bn Inflation Reduction Act. It completely missed its targets of unleashing 2Mbpd of synfuels by 1992, due to challenging economics, thermodynamics, technical issues, logistical issues. What evidence can we find that green hydrogen will prove different to this historical case study?

(8) Niche applications can however be very interesting, where clean hydrogen is used as an industrial feedstock. An overview of today’s 110MTpa hydrogen market is here and underlying data are here. At large scale, we are currently most excited by using clean hydrogen in ammonia value chains and steel value chains, as the technology is fully mature and looking highly economical. It is also booming in the US. Elsewhere, an excellent large-scale application is to displace black hydrogen (made from coal), which is 20% of today’s hydrogen market and has a staggering CO2 intensity of 25 tons/ton. At smaller scale, there is also a weird and wonderful industrial landscape, using hydrogen to make products such as margarine or automotive glass. Putting an electrolyser on site beats shipping in hydrogen via cryogenic trucks. But these are also quite niche applications.

(9) Blue hydrogen is the most economical, low-carbon hydrogen concept we have found. Effectively this is decarbonizing natural gas at source, by reforming the methane molecule into H2 and CO2, the latter of which is sent directly for CCS. Our best overview of the topic is linked here. There are still c15% energy penalties. Costs are $1-1.5/kg in our models, to eliminate c90% of natural gas CO2.

(10) Turquoise hydrogen is also among the more interesting concepts, pyrolysing the methane molecule at 600-1,200â—¦C into H2 and carbon black. Our base case cost is $2/kg, with a $500/kg price for carbon black. But if you can realize $1,000/kg for the carbon black, you could give the hydrogen away for free. We have screened patents from Monolith and expect others to come to market with technologies and projects.


Around 40 reports and data-files into hydrogen have led us to these conclusions above; listed in chronological order on our hydrogen category page. The best way to access our PDF reports and data-files is through a subscription to TSE research.


Energy storage: top conclusions into batteries?

Conclusions into batteries

Thunder Said Energy is a research firm focused on economic opportunities that drive the energy transition. Our top ten conclusions into batteries and energy storage are summarized below, looking across all of our research.


(1) Transportation: a revolution. Gasoline and diesel vehicles are 15-25% efficient, on a wagon to wheel basis, due to immutable laws of thermodynamics. Electric vehicles using lithium ion batteries are 75-95% efficient. The technology is only getting better, including via power electronics and electric motors. So this is a game changer for light transportation, which becomes >70% electric in our oil models by 2050.

(2) Bottlenecks in battery materials will set the limit on the scale up. Numerically, the largest bottlenecks are in lithium; followed by fluorinated polymers and battery-grade nickel; then graphite and copper. We are less worried about cobalt. Our best data-file into materials used in a lithium ion battery, and their costs, is linked here.

(3) Power grids: efficiency drawbacks. Amidst materials bottlenecks, we think vehicle applications will generally outcompete grid applications. While an EV is 3-4x more efficient than what it replaces, grid scale storage usually has a 10%+ energy penalty. Thus the 65kWh battery in a typical EV saves 2-4x more energy and 25-150% more CO2 each year than a typical grid battery (note here).

(4) Power grids: the best battery is no battery. All batteries have a cost, usually $1,000-2,000/kW, which is re-couped through a storage spread, usually around 20c/kWh for daily charging-discharging (model here). Conversely, there are many loads in the power grid that can shift their demand (e.g., to the times when grids are over-saturated with renewables). This often has no cost. And no efficiency losses. Some of our favorite examples are catalogued here.

(5) Power grids: short-term first. The biggest challenges for ramping up wind and solar stem from short-term volatility (inertia, reactive power compensation, frequency regulation, <1-minute power drops). This requires short-term energy storage first, in the 2020s and 2030s. Many short term batteries can also earn their keep through recuperative energy savings. But note short term energy storage favors capacitor banks, STATCOMs, flywheels, synchronous condensers, supercapacitors. It is debatable whether lithium ion is well suited to short-term smoothing. Eaton has even recently started integrating supercapacitors into its industrial batteries, amidst increasing customer demand for short-term performance (case studies here).

(6) Long-term storage is for the 2040s, if at all. If you cycle your battery 10 times per day, you amortize its capex across 3,650 cycles per year, and the cost per cycle is <1c/kWh. Cycle 1 time per day, and it is 10-20c/kWh. Cycle 1 time per month and you are well above 200c/kWh. The maths are reviewed here. You can also stress test numbers in our pumped hydro model, other battery models. So we do not think long term storage (via batteries or hydrogen) will ever come into the money. We see more opportunity in long-distance power transmission, decarbonized gas, next-gen nuclear; fully decarbonizing future grids while keeping costs below 10-20c/kWh.

(7) Density will improve, but not enough for mass deployment of battery trucks, ships or planes. Today’s lithium ion batteries store 200Wh/kg. In a best case scenario, this could reach 1,250 Wh/kg. Oil products contain 12,000Wh/kg. Thus a battery-powered Class 8 truck will have 70-80% lower range than a diesel truck. And a battery-powered airliner has a range of c60-miles. We do not currently see battery powered trucks, ships or planes going mainstream.

(8) Next-gen batteries: can we de-risk them? There is constant progress and innovation in batteries, to improve density, duration, chemistry, longevity, cost, charging speeds. So we are constantly screening patent libraries. As a general rule we have found incremental innovations easier to de-risk. But we have been less able to de-risk big changes. Replacing lithium with sodium has issues with ionic radius. Solid state batteries often have issues with dendrites and longevity. Redox flow likely works but has 70-75% efficiency.

(9) End-of-life is most unresolved. If there is one TSE research note on batteries, which we think decision-makers should read it is this one, explaining battery degradation, the best antidotes and their implications (lithium upside?, manufacturer upside?). This matters, because despite some interesting inroads, we still do not think the industry has really cracked battery recycling, a potential $100bn pa market in the 2040s.

(10) Which battery companies? We have been most impressed by manufacturing technologies from 24M and CATL, followed by integrated battery offerings from Eaton, Stem and Powin. There are some interesting innovations from Amprius, Enovix, Quantumscape. But so far, we have found it more challenging to entirely de-risk concepts from Sila, Form Energy, Solid Power, Storedot. Please email us if there are any battery technologies you would like us to explore.


Around 60 reports and data-files into batteries and energy storage have led us to these conclusions above; listed in chronological order on our batteries category page. The best way to access our PDF reports and data-files is through a subscription to TSE research.


LNG: top conclusions in the energy transition?

LNG in the energy transition

Thunder Said Energy is a research firm focused on economic opportunities that drive the energy transition. Our top ten conclusions into LNG are summarized below, looking across all of our research.


(1) LNG markets treble in our energy transition roadmap, rising from 400MTpa today to 1,100MTpa by 2050, for a c4% CAGR. The main reason is to displace coal, which is 2x more CO2 intensive. This LNG growth rate is 1.5x faster than total global natural gas supply growth, which “merely doubles” from 400bcfd to 800bcfd, for a 2.5% CAGR. The world needs $20bn of new liquefaction capex per year. Our LNG outlook through 2050 is modeled here.

(2) Marginal cost is $10/mcf as a rule-of-thumb for the 2020s. This is summing up the economics across the entire value chain for gas production, gas processing, pipeline transportation, LNG liquefaction, LNG shipping and LNG regasification. The best projects work at $7/mcf. But prices will run well above marginal cost amidst under-supply.

(3) Under-supply in 2023-28 in our supply model augurs for $15-40/mcf spot global LNG prices. After adding +20MTpa of new LNG supplies each year from 2015 to 2022, we think the world will be lucky to add +10MTpa in 2023 and 2024. There is always a further risk of supply disruptions. Meanwhile, Europe’s 15bcfd of Russian gas imports, volumetrically equivalent to 110MTpa of LNG, are shifting. The best note covering our gas outlook is linked here and our European gas models are linked here.

(4) The key challenge is CO2. Liquefying natural gas at -160C requires 300-400kWh/ton of energy, depending on the LNG plant design. This results in 3-4 kg/mcf of Scope 1+2 CO2. Across the value chain, LNG will have 7-10kg/mcf of Scope 1+2 CO2. Adding the Scope 3 from combustion, we reach total CO2 intensity of 60-65kg/mcf. Coal is 130kg/mcfe. Yet it feels like we could die of energy shortages before gas critics listen to “relative CO2” reasoning and countenance long-term LNG contracts.

(5) Rising to the challenge. The LNG industry can satisfy its skeptics. This is earnestly happening. It includes measuring CO2 in LNG supply chains. Then offsetting it via nature-based CO2 removals. Or capturing CO2 from combustion, then sharing regas terminal infrastructure to liquefy it, and ship it away for disposal. We have written a full note on back-carrying CO2 here. CO2 abatement costs range from $50-125/ton, or $3.0-7.5/mcfe. This scores well on our cost curves.

(6) 2020s supply growth will be dominated by the US, which is particularly well placed to assuage gas shortages in Europe. US LNG can treble from 70MTpa in 2021 to 200MTpa by 2030. It requires an extra 17bcfd of gas (c18% total US gas supply growth), which in turn pulls on E&P activity in the Haynesville, Permian and Marcellus.

(7) Longer term supply growth will be dominated by the Middle East, which is particularly well placed to phase out China’s coal. These numbers are mind-blowing. As an idea, if China directly substituted all 4GTpa of its coal (10GTpa of CO2 emissions!), this would require 1,600 MTpa of LNG, i.e., 4x more than today’s entire global LNG market. If you read one note, to understand this topic, we would recommend this one.

(8) Smaller-scale LNG and transport upside? We have reviewed opportunities in LNG in transport, smaller-scale LNG, LNG-fueled trucks, LNG-fueled ships, eliminating methane slip, LNG fuelling stations, small fixed LNG plants, floating LNG plants. There are some interesting concepts, especially for specific applications. But we have not materially de-risked smaller-scale LNG upside in our numbers yet.

(9) Cyclical industries reward counter-cyclical behaviours, and LNG is deeply cyclical. The title chart above shows this nicely, with spurts of growth, punctuated by plateaus, once per decade. It always feels uncomfortable to sanction projects when others are not. But our view is that bravery gets rewarded. “If you build it, the demand will come”.

(10) Companies. Incumbents benefit most from under-supply in the 2020s. Upcoming projects and their sponsors are summarized in our LNG supply model. We have also screened LNG shipping companies. But the question that fascinates us most is whether upcoming project sponsors can avoid the cost inflation that marred the past cycle, with some interesting evidence from patents in our note here.


Around 45 reports and data-files into LNG have led us to these conclusions above; listed in chronological order on our LNG category page. The best way to access our PDF reports and data-files is through a subscription to TSE research.


Power grids: opportunities in the energy transition?

power grid opportunities in the energy transition

This article summarizes our conclusions into power grids and power electronics, across all of Thunder Said Energy’s research. Where are the best power grid opportunities in the energy transition?

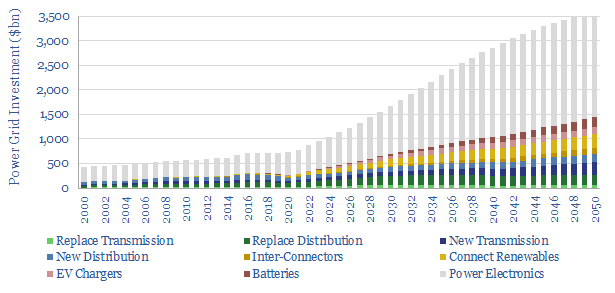
Power grids move electricity from the point of generation to the point of use, while aiming to maximize power quality, minimize costs and minimize losses. Broadly defined, global power grids and power electronics investment must step up 5x in the energy transition, from $750bn pa to over $3.5trn pa. This theme gets woefully overlooked. This also means it offers up some of the best opportunities in the energy transition.


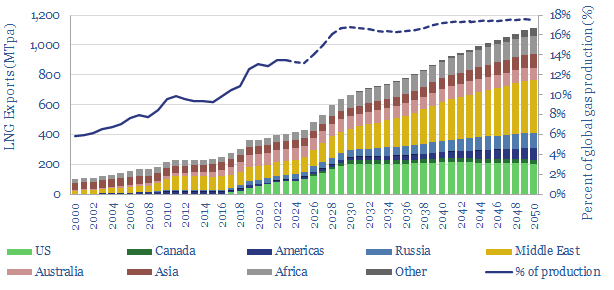
(1) Electrification is going to be a major theme in the energy transition, a mega-trend of the 21st century, as the efficiency and controllability of electrified technology is usually 3-5x higher than comparable heat engines. It is analogous to the shift from analogue to digital. 40% of the world’s useful energy is consumed as electricity today, rising to 60% by 2050 (note here — our best overview of the upside in grids) propelling the efficiency of the primary global energy system from 45% today to 60% by 2050 (note here). Power demands of a typical home will also double from 10kW to 20kW in the energy transition (data here). Electricity demands of industrial facilities are aggregated here.

(2) Electricity basics are often misunderstood? If we have one salty observation about power markets, it is that many commentators seem to love making sweeping statements without understanding much at all. It is the energy market equivalent of wandering in off the street to an operating theater, and without any medical training at all, simply picking up a scalpel. This is a little bit sad. But it also means there will be opportunities for decision makers that do understand electricity and power systems. As a place to start, our primer on power, voltage, current, AC, DC, inertia and power quality is here.

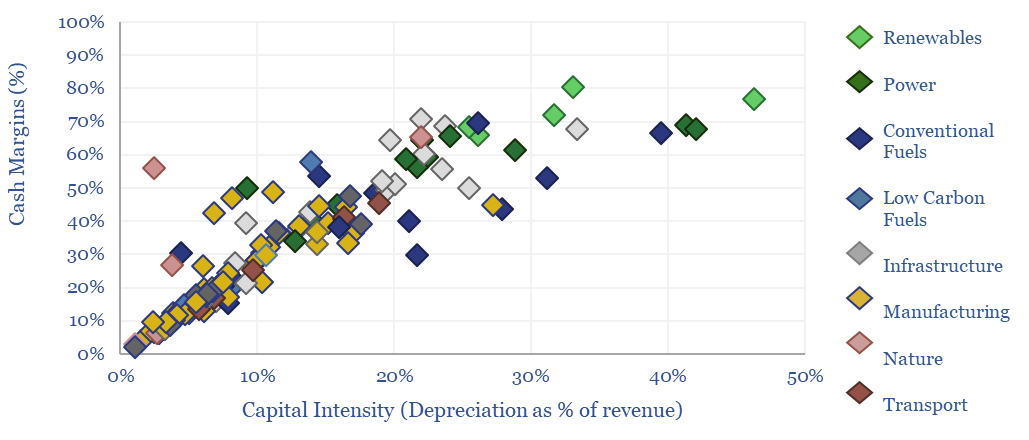
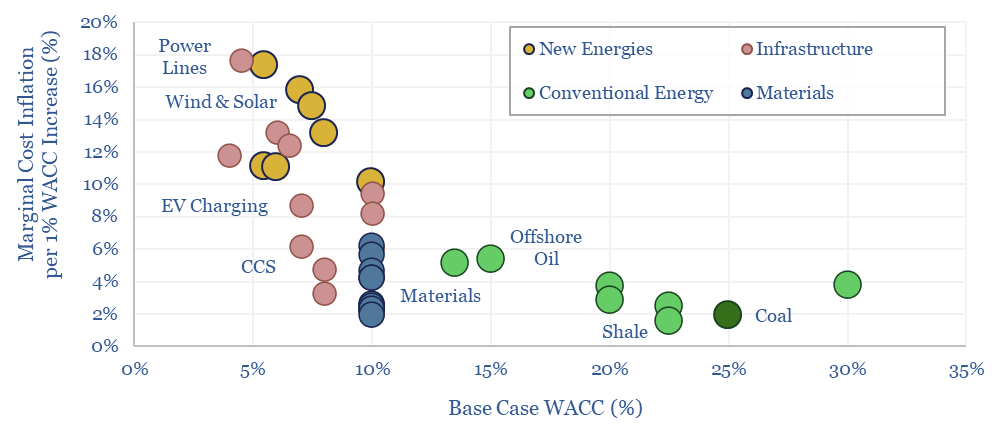
(3) Power generation costs 5-15c/kWh. But variations within each category are much wider than between categories (note here). So generation will not be a winner takes all market, where one “energy source to rule them all” pushes out all the others. This view comes from stress testing IRR models of wind, solar, hydro, nuclear, gas, coal, biomass, diesel gensets and geothermal. And from 400-years of energy history. The average sizes of power generation facilities are here, and typical ramp rates are here.

(4) Transmission is becoming the key bottleneck on renewables and electrification in the energy transition. Each TWH pa of global electricity demand is supported by 275km of power transmission and 4,000km of distribution (data here). Connecting a new project to the grid usually costs $100-300/kW over 10-70km tie-in distances (data here). But bottlenecks are growing. The approval times to connect a new power plant to the grid have already increased 2.5x since the mid-2000s, averaging 3-years, especially for wind and solar, which take 30% and 10% longer than average (data here). Avoiding these bottlenecks requires power grids to expand. Spending on power grids alone will rise from $300bn pa to over $1.2trn pa, which is actually larger than the spending on all primary energy production today (data here).

(5) Power transmission also beats batteries as a way of maximizing renewable penetration in future grids. Rather than overcoming intermittency — solar output across Europe is 60-90% inter-correlated, wind output is 50-90% inter-correlated — by moving power across time, you can solve the same challenge by moving them over a wider space. A key advantage is that a large and extensive power grid smooths all forms of renewables volatility, from a typical facility’s 100 x sub-10-second power drops per day to the +/- 6% annual variations in solar insolation reaching a particular point of the globe. By contrast, different batteries tend to be optimized for a specific time-duration, while at long durations, the economics become practically unworkable. A new transmission line usually costs 2-3c/kWh per 1,000km (model here). Additional benefits for expanded power grids accrue in power quality, reliability and resiliency against extreme weather. These benefits will be spelled out further below…

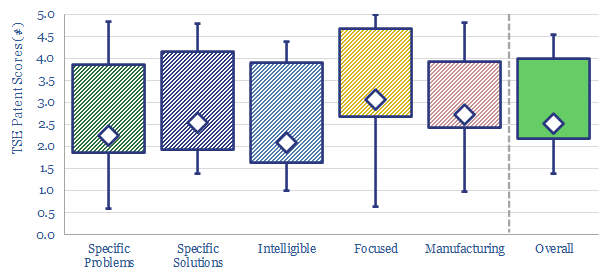
(6) Upside for transmission utilities and suppliers? Our overview of how power transmission works is here. Operating data for high voltage transmission cables are here. Leading US transmission and distribution utilities are screened here. Leading companies in HVDCs are here. Offshore cable lay vessels are screened here. We have also screened Prysmian patents here. But the opportunity space is also much broader, which becomes visible by delving into how power grids work…

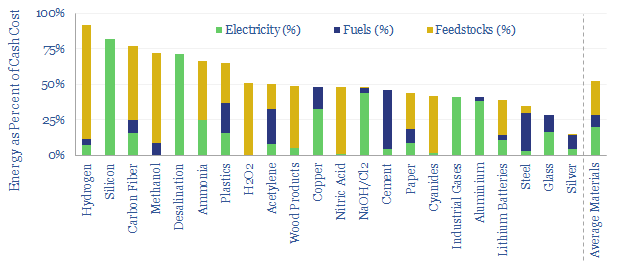
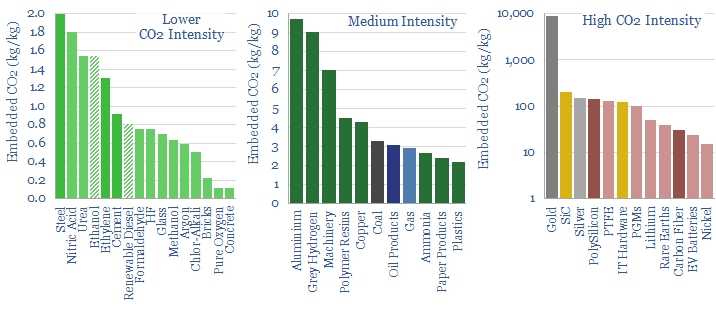
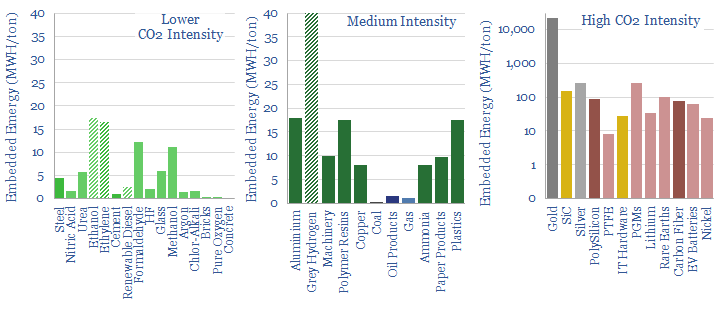
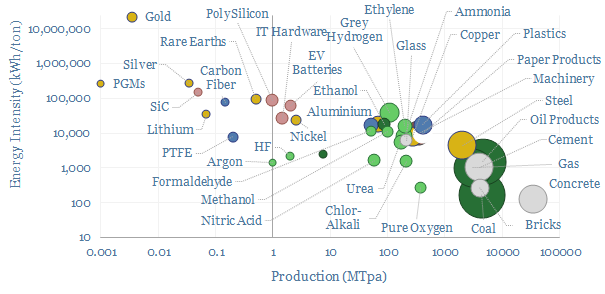
(7) Cabling materials. As a general rule, overhead power lines are made of aluminium, due to its light weight and high strength. Conversely, HVDC cables and household wiring are made of copper, which is more conductive. HVDCs are also encased in specialized plastics. New power transmission lines add 3-5MTpa of demand to aluminium markets, or 5-7% upside (note here). But we are more worried about bottlenecks in copper (where total global demand trebles) and silver.

(8) Transformers and specialized switchgear are needed to step the voltage up or down to a precise and prescribed level at every inter-connection point in the grid. The US transmission network operates at a median voltage of 230kV, which keeps losses to around 7%. Energy transition could double the transformer market in capacity terms and increase it by 30x in unit count (note here, costs and companies screened here), surpassing $50bn pa by 2035. Downstream of these transformers, the power entering industrial and commercial facilities will often remain at several kV, which requires specialized switchgear to prevent arcing. We see the MV switchgear market trebling to over $100bn pa by 2035.

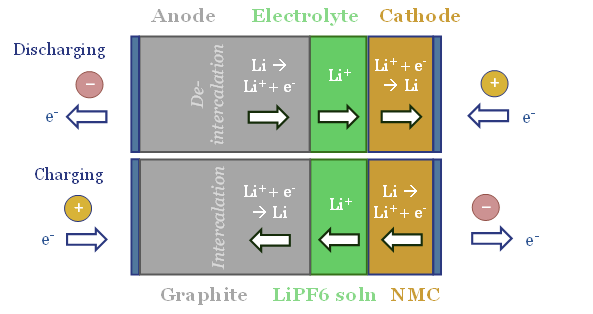
(9) AC and DC. Wind and solar inherently produce DC power, but most transmission lines are AC. Hence they must be coupled with inverters and converters. At the ultimate point of use, AC power also usually needs to be rectified back to DC and bucked/boosted to the right voltage for each machine or appliance. The same goes for EV charging and EV drive trains. DC-DC conversion, AC-DC rectification and DC-AC inversion are effectively consolidating around MOSFETs. And we think one of the most interesting incremental jolts for the energy transition is the 1-10pp higher efficiency and rising market share of SiC MOSFETs. Leading companies in SiC and MOSFETs are screened here.

(10) Inertia and frequency regulation. All of the AC power generators in the grid are running in lockstep, ‘synchronized’ at around 50 Hertz in Europe and 60 Hz in the US. But the frequency of all the power generators in the grid changes second by second. If there is a slight under-supply of power, then what prevents the grid from collapsing is that energy can be harvested from the rotational energy of massive turbines weighing up to 4,000 tons and spinning at 1,500 – 6,000 rpm, as they all slow down very slightly. This sorcery is called ‘inertia’. Wind and solar do not inherently have any inertia (no synchronized spinning). But there are ways of partially mimicking inertia or adding synthetic inertia to the grid through flywheels, supercapacitors, synchronous condensers, batteries, smart energy. Our grid models reflect growing demand for infrastructure in all of these categories.

(11) Reactive power compensation. Apparent power (in kVA) consists of two components: real power (in kW) and reactive power (in kVAR). Inductive loads consume reactive power as the creation of magnetic fields draws the current behind the voltage in an AC wave. This lowers power factor in the grid, amplifies the current that must flow per unit of real power, and thus amplifies I2R losses. Large spinning generators have historically provided reactive power to energize transmission lines and compensate for inductive loads. Again, wind and solar do not inherently provide reactive power compensation and have historically leaned on the rotating generators. Renewable heavy grids will need to add reactive power compensation, expanding this market by a factor of 30x. The best opportunities are in STATCOMs and SVCs (leading companies screened here), capacitor banks at industrial facilities and Volt-VAR optimization at the grid edge.

(12) Electric vehicle charging: find the shovel-makers? Each 1,000 EVs will likely require 40 Level 2 chargers (30-40kW) and 3 Level 3 fast-chargers (100-200kW), so our numbers ultimately have $100bn pa being spent on EV charging in 2025-50. But we wonder whether EV chargers will ultimately become over-built, and the best opportunities will be in supplying components and materials to these chargers, rather than owning the infrastructure itself. Our best single note on this topic is here. Economics of EV charging stations and conventional fuel retail stations make a nice comparison.

(13) Motor drivers are another huge efficiency opportunity. There are 50bn electric motors in the world, consuming half of all global electricity. But most motors are inefficient, rotating at fixed speeds determined by the frequency of the AC power grid, rotating faster than they need to, which matters as power consumption is a cube function of rotating speed. One of the best efficiency opportunities in the grid expands the role of variable frequency drives to optimize motors (note here). Economics are screened here and leading companies are covered here. All of our work into electric motor efficiency and reliability is linked here.

(14) Without reliable and high-quality power grids, frankly, things will break. This is a statement made in patents and technical papers, again and again, discussing how lagging power quality enhances maintenance and breakage costs of expensive equipment. Fundamentally, this is why we think that commercial and industrial power consumers will increasingly invest more in power electronics, and there are so many hidden power grid opportunities in the energy transition.

(15) Power electronics is the broad category of capital goods that encompasses effectively everything discussed on this page. And this summary has hardly even scratched the surface. We think pure power electronics spending trebles from $300bn pa to $1trn pa by 2035 (model here). It is the same group of companies coming up again and again in this space (best note here). For example, we have attempted to break down Eaton’s revenues across 10,000 SKUs in 200 different categories here. We do think that the complexity in power grids and power electronics creates opportunity for decision makers that can grasp it.


All of our research — PDF research reports, data-files, economic models and company screens — into power grid opportunities in the energy transition is summarized below, in chronological order of publication.


TSE Patent Assessments: a summary?

new technologies for the energy transition

New technologies for the energy transition range across renewables, next-gen nuclear (fission and fusion), next-gen materials, EV charging, battery designs, CCS technologies,  electronics, recycling, vehicles, hydrogen technologies and advanced bio-fuels. But which companies and technologies can we de-risk?


One way to appraise new technologies for the energy transition is to lock yourself in a room with a stack of patents from publicly available patent databases, read the patents, and then score them all on an apples-to-apples framework.

Our technology assessment framework is derived from 15-years experience evaluating energy technologies, from the best of the best world-changing technologies, to companies that ultimately turned out to have over-promised. The framework includes five areas:

(1) Specific problems. We find it easier to de-risk patents that pinpoint specific problems that have hampered others, and set about to solve these problems.

(2) Specific solutions. We find it easier to de-risk patents that pose specific solutions, whereas it is harder to de-risk technologies that are more vague.

(3) Intelligibility. We find it easier to de-risk patents that explain why their inventions work, often including empirical data and underlying scientific theory.

(4) Focused. We find it easier to de-risk patents that all point towards commercializing a common invention, and different aspects of that invention. Conversely, patenting 10 totally different solutions might suggest that a company has not yet honed in upon a final product.

(5) Manufacturing details. We find it easier to de-risk patents that explain how they plan to manufacture the inventions in question. Sometimes, very specific details can be given here. Otherwise, it may suggest the invention is still at the ‘science stage’.

The purpose of this data-file is to aggregate all of our patent assessments in a single reference file, so different companies’ scores can be compared and contrasted. The average score in our patent assessment framework is 3.5 out of 5.0, although there is wide variability in each category.

In each case, we have tabulated the scores we ascribed each company on our five different screening criteria, metrics on the companies’ size and technical readiness and a short descripton of our conclusion. You can also view all of our individual patent assessments chronologically.

CO2 intensity of materials: an overview?

CO2 intensity of materials

This data-file tabulates the energy intensity and CO2 intensity of materials, in tons/ton of CO2, kWh/ton of electricity and kWh/ton of total energy use. The build-ups are based on 160 economic models that we have constructed, and the data-file is intended as a helpful summary reference. Our key conclusions on the CO2 intensity of materials are below.


Human civilization produces over 60 bn tons per year of ‘stuff’ across 40 different material categories, accounting for 40% of all global energy use and 35% of all global emissions.

Rules of thumb. Producing the average material in our data-file consumes 5,000 kWh/ton of primary energy and emits 2 tons/ton of CO2.

Energy breakdowns. As another rule of thumb, 30% of the energy inputs needed to make a typical material are electricity, 25% are heat and 45% are other input materials.

Ranges. All of these numbers can vary enormously (chart below). Energy intensity of producing materials ranges from 300 kWh/ton (bottom decile) to 150,000 kWh/ton (upper decile).

The average thermodynamic efficiency of producing these industrial materials is quantified at c20%, with an interquartile range from 5% to 50%. This is shown in the chart below and discussed in more detail here.

CO2 intensity of producing different materials also ranges from 0.5 tons/ton (bottom decile) to 140 tons/ton (upper decile).

Strictly, many of the largest contributors to global CO2 emissions, such as steel and cement, are not ‘carbon intensive’ (i.e., emissions are <2 tons/ton), they are simply produced in very large volumes.

Ironically, while we want to achieve an energy transition, it does require ramping up production of materials value chains that truly are CO2 intensive (i.e., emissions are above 20 tons/ton or even 100 tons/ton). This includes PV silicon and silver for solar panels; carbon fiber and rare earths for wind turbines; and lithium and SiC MOSFETs for electric vehicles. Ultimately these value chains also need to decarbonize in some non-inflationary way, which is a focus in our research.

Scope 4 CO2. Another complexity is that everything has a counterfactual. SiC MOFSETs might be energy intensive to produce but they earn their keep in long-term efficiency savings. Hence we recommend that the best way to evaluate total CO2 intensity is on a Scope 1-4 basis (note here).

Simplifications. Please note that in order to make this file remotely useful, we are guilty of simplifying and averaging quite complex and broad-ranging industries. More detail is available on different oil value chains (including oil sands and Permian shale in detail), gas value chains, coal grades, industrial boilers and burners by industry, construction materials and different plastics.

CO2 screening. In some industries, we have been able to aggregate CO2 curves, plotting the different CO2 intensities or energy intensities of different companies. The best example is looking at acreage position by position in the US oil and gas industry, refiners, gas pipelines, gas gathering, gas distribution, ethanol plants.

Other data-files on our website have aimed to tabulate the CO2 intensity of other value chains, but due to quirks of those value chains, we cannot plot the data in kWh/ton or CO2/ton. This includes the CO2 of different forms of transportation, digital processes, or hydrogen.

Agricultural commodities are also not captured in the data-file. We have estimated separately the CO2 intensity of different wood fuels, crop production, how it varies with fertilizer application, palm oil. All of our biofuels research is here.

Energy transition companies?

This database contains a record of every company that has ever been mentioned across Thunder Said Energy’s energy transition research, as a useful reference for TSE’s clients. The database summarizes over 3,000 mentions of 1,400 energy transition companies, their size, focus and a summary of our key conclusions, plus links to further research.


Our research library has become quite large, with over 1,300 research notes, data-files and models in the TSE research portal, since we started Thunder Said Energy in 2019. Hence the purpose of this data-file, which is only available to TSE’s full subscription clients, is to summarize all of the mentions of all of the companies, across all of our work.

For example, if a decision-maker is looking for information about ABC-Industries, and its linkage with energy transition, then a summary of key observations about ABC-Industries will be noted on the LongList tab, and all of the underlying mentions of ABC-Industries across different research notes can be filtered on the ‘Mentions’ tab, including links. Our methodology is described in the recent research note here.

Having a long list of energy transition companies, in a single database, also enables some interesting analytics, into the Very Hungry Caterpillar of companies in the world’s fast-evolving global energy and industrial landscape, amidst the transition to net zero.

The geographies that are most represented in our database of energy transition companies include the US (over 500 companies, 38% of the companies, 36% of the mentions), Europe (420 companies, 30%, 36%), China (115, 8%, 8%), Canada (95, 7%, 7%), Japan (70, 5%, 5%), Australia (36, 3%, 2%), Korea (35, 3%, 2%). And counting.

Zooming in a little further, there are 250 companies that have come up repeatedly in TSE research, or where we have conducted more in-depth work, across 8 sectors and 50 sub-sectors. 50 were CleanTech companies, of which 75% tended to private, and the remaining 25% were small-cap or mid-cap companies (chart below).

Other segments. 70 are capital goods companies, 30 are materials companies, and other heavily discussed industries in our research are energy, mining and semiconductors, ranging from small-privates to mega-cap giants.

Zooming in even further, there are 50 companies that have come up at least 5 times in TSE’s thematic research, which is focused on opportunities, themes and bottlenecks in the world’s transition towards net zero. These warrant a closer look.

For example, In 2021-22, we became obsessed with the idea that power electronic switchgear would increasingly be needed to help electricity scale up from 40% to 60% of the world’s energy system by 2050, save energy – from variable frequency drives to power factor management – and to accommodate more volatility in renewable-heavy grids. Thus the company we wrote most about in 2021-22 was Eaton. Which subsequently doubled.

Hence we have started a new quarterly series of research reports and updates to this database, simply noting the companies that have featured most prevalently in our research over the trailing several months, and since the inception of TSE, as a useful summary for decision-makers who have not necessarily been able to read 100% of our output, and may wish to dig deeper into these companies as part of their own processes. The latest instalment covers our energy transition conclusions in 1Q24.

The data-file is exclusively available to TSE subscription clients. Any purchases of the data-file will be automatically converted into a TSE full subscription. And we will continue updating the database over time.

Nature based solutions to climate change?

Nature based solutions are likely to deliver c20-25% of the decarbonization in a realistic roadmap to net zero. Reforestation is low-cost (c$50/ton), technically ready, practical and helps nature. Key challenges are improving the quality of nature-based CO2 removals and accelerating momentum. We see opportunities for companies that tackle these challenges. Our top conclusions into nature-based solutions to climate change follow below.


(1) Deforestation and land use changes have emitted over 1 trillion tons of CO2 since pre-industrial times, as 5bn acres have been deforested (data here). That is 25% of total net anthropogenic emissions. Today, deforestation continues at a pace of 12M hectares per year (30M acres per year), emitting 6GTpa of CO2e, 12% of the global total, equivalent to all the world’s passenger cars (data here). There is clearly no route to net zero without some renewed balance with nature in the 21st century (note here). And more optimistically, photosynthesis fixes 700GTpa of CO2, compared to anthropogenic CO2 emissions of 50GTpa, so small changes in the natural carbon cycle can have large impacts.

(2) What are CO2 removals? Land that has been deforested will store minimal CO2. Mature forests store an additional 200 tons of CO2-equivalents per acre. Sometimes over 400 tons of CO2-equivalents per acre. Hence over a 40+ year growing cycle, trees take up an average of 5 tons of CO2 per acre per year (data here). The growth rates are sigmoidal (note here). Then ultimately mature forests sequester minimal amounts of CO2 as mature trees grow 40-50% more slowly and biomass decomposition matches new accumulation. CO2 is removed when land moves from ‘not forest’ to ‘forest’ and then stays forested.

growth rates forests during reforestation follow a sigmoid function sequestering CO2 slowly then quickly then slowly again

(3) Residuals and convenience. Many industrial processes are complex and competitive. Look at the charts for how the world makes carbon fiber (e.g, for wind turbine blades) or polyester (for textiles and solar backsheets), or AI chips, or any of the other metals and materials that explain 40% of all global CO2 emissions; and are needed to build other decarbonization technologies themselves, such as wind, solar and electric vehicles. In our view, there will always be some residual emissions in industrial processes. It will be an order of magnitude more practical to offset these emissions in the forest rather than in the factory. Many industrial companies will be delighted to pay for this service, rather than having to ‘reinvent and retool’ (examples here).

(4) Costs of CO2 removals. Ultimately, companies that offer the best decarbonization product at the lowest price will “win”. Our best model for the costs of reforestation is here, and sees an average CO2 removal cost of $50/ton. We also reach similar numbers when modeling mangrove restoration. $50/ton is feasible. And a long way below high cost technologies, such as DAC credits at $200-1,000/ton (how much do you have to hate nature, to pay $1,000/ton for a DAC credit rather than $50/ton for natural remediation?!). But CO2 removal costs in forests are also variable and can range from $3-120/ton. Economics hinge upon land costs, seedling costs, planting density, yield class, timber product prices. Over time, experience curves will apply in forestry, and many variables can be optimized.

(5) How much land for reforestation? Out of the world’s 40bn acres of land, we think 3bn acres can be reforested (note here, data here). To be realistic, this estimate does not include core croplands, inhospitable climates (e.g., Antarctica), or deserts (although at the upper end of the cost curve, we have explored using waste water in semi-arid petroleum basins, note here). The best land to reforest is drawn from the world’s 5bn acres of degraded-abandoned land and 8bn acres of pasture land. 47 emerging world countries could uplift GDP by 6-60% as they reforest 1.5bn acres via adopting ‘reforest and reinvest’ as an economic development model (note here). For another case study that is superb, nay sublime, look at Finland, which has offset two-thirds of its fossil emissions over the past century (note here). Reforestation potential by country is screened here.

(6) Quality and trust. Historically, carbon offset projects have not had sufficiently high quality, in our opinion. If buyers of carbon credits cannot trust a project, then its future carbon credits will end up heavily discounted. Possibly even valueless. For the highest quality projects, which will attract the highest CO2 prices, there must be no doubt that the project is real, incremental (CO2 removals not avoidance credits), its CO2 must be correctly measured, it should enhance biodiversity (which can even boost CO2 uptake by 15-70%) and the permanence of the CO2 storage should be enhanced by guarantees and buffers.

(7) Where is today’s market? In 2022, Thunder Said Energy contributed $7,700 to nature-based solutions projects, to offset its own CO2 emissions 20x over, studying half-a-dozen projects in detail, using a five-point framework. Today’s market is evolving painfully slowly. It lacks depth and policy support. High-quality credits are most bottlenecked. This makes us wonder whether early adopters will achieve higher returns. Our best note summarizing these findings is linked here.

(8) Controversies? The biggest controversy in today’s carbon markets are over permanence, and our best research note is here, comparing the total CO2 balances of forest products depending on their sources and uses. 1GTpa of timber is still burned for fuel, including biomass and BECCS, which is obviously not permanent. Pulp and paper also has low permanence. Construction materials have high permanence. The oldest wooden structure still standing is Japan’s Horyuji Buddhist temple, constructed in 639AD. There is buried biomass that has lasted 45,000 years (note here). And studies show that 80-95% biomass carbon can remain preserved after 40-100 years in landfill (chart below, data here). There are also environmental controversies, due to forest-climate feedbacks. There are increasing risks of forest fires in fire-prone regions, which need to be managed and ‘buffered’ when booking carbon credits. But forests may also grow 25% faster due to high atmospheric CO2. And enhanced cloud seeding should offset forests’ low albedo.

(9) Other nature-based solutions. Further running room in nature-based CO2 removals includes farming carbon into soils via conservation agriculture (note here), carbon offsets in the ocean (note here), blue carbon (here), savanna management (note here), biochar (note here) and most controversially, ocean iron fertilization (“give me half a tanker of iron and I will give you another ice age”) (note here). Our roadmap to net zero derisks 15GTpa of CO2 removals from forests, 2GTpa from agriculture, and 600MTpa from biochar.

(10) Nature-based CO2 companies. Companies and charities offering CO2 offsets are screened here. Companies measuring forest and soil carbon are screened here. Arborgen is a listed seedling producer. Stora Enso makes sustainable materials from timber products. Cross laminated timber can be used for large construction projects, lowering CO2 by 15-80% compared to steel and cement. Tricoya is a listed mid-cap making a long-lasting engineered timber product. Tigercat is a leader in forestry machinery. More exotically, we have screened biotech and agtech companies increasing the CO2 uptake rates of plant species. Biochar companies are here and aquaculture companies are here. We also think large beneficiaries from nature-based CO2 will include industrial incumbents. Energy incumbents may commercialize zero carbon fuels by offering high-quality CO2 removal credits in conjunction with carbon emitting fuels (note here); and investment firms may offer carbon-neutral funds that dedicate a share of dividend proceeds to abating the look-through CO2 of the funds’ holdings (note here).


Global energy: supply-demand model?

global energy supply-demand

This global energy supply-demand model combines our supply outlooks for coal, oil, gas, LNG, wind and solar, nuclear and hydro, into a build-up of useful global energy balances in 2023-30. We fear chronic under-supply if the world decarbonizes, rising to 5% shortages in 2030. Another scenario is that emerging world countries bridge the gap by ramping coal. Numbers can be stress-tested in the model.


Useful global energy demand grew at a CAGR of +2.5% per year since 1990, and +3.0% per year since 2000. Demand would ‘want’ to grow by +2% per year through 2030, due to rising populations and rising living standards (model here). We have pencilled in +1.75% pa growth to this model to be conservative.

Combustion energy is seen flat-lining in our net zero scenario. This includes global coal use peaking at 8.4GTpa in 2024 then gently easing to 2010 levels by 2030 (model here). It includes oil demand, rising to 102Mbpd in 2024 (data here), then plateauing (model here) as OPEC and US shale (model here) offset the decline rate impacts of conventional under-investment. It includes risked LNG supplies rising +70% from 400MTpa in 2022 to almost 700MTpa by 2030 (model here). While our roadmap to net zero would need to see global gas growing at +2.5% per year through 2050 (model here), this data-file has pencilled in flat production in 2022->30, as we think that latter scenario currently looks more likely to transpire.

Renewable energy is exploding. Our model of wind and solar capacity additions is linked here and discussed here. In our roadmap to net zero, solar more than doubles from c220GW of new adds in 2022 to 500GW by 2030, while wind rises from c100GW of new adds in 2022 to 150GW by 2030.

Other variables in the model include rising energy efficiency (note here), the need for a nuclear renaissance (note here) and other variables that can be flexed.

What is wrong with this balance is that it does not balance. The assumptions pencilled into the model see an under-supply of global energy of about 3% in 2025, rising to 5% in 2030. I.e., by 2030, the world will be “half a Europe” short of energy. The first law of thermodynamics dictates that energy demand cannot exceed supplies. So what would it take to restore the balance? Well, pick your poison…

(1) Slower demand growth could re-balance the model. Very high energy prices might mute demand growth to only +1.25% per year, although this would be the slowest pace of demand growth since the Great Depression, lower even than during the oil shocks (useful data here). Unfortunately, our view is that pricing people out of the global energy system in this way is in itself an ESG catastrophe.

(2) Ramping renewables faster could re-balance the model, although it would require an average of 1 TW pa of wind and solar capacity additions each year in 2024-30, and over 2 TW pa of wind and solar additions by 2030 itself, which is 3x higher than in our roadmap to net zero (discussion here). For perspective, this +2TWpa solution requires primary energy investment to quadruple from $1trn pa to at least $4trn pa, which all needs to be financed in a world of rising rates. It means that global wind and solar projects will consume over 200MTpa of steel, which is 2x total US steel production, and yet steel would not even qualify as a ‘top ten’ bottleneck, in our wind bill of materials or solar bill of materials. This scenario also requires a 3x faster expansion of power grids and power electronics than our base case estimates (see the links). Is any of this remotely possible?

(3) Continue ramping coal? The main source of global energy demand growth is the emerging world. The emerging world is more likely to favor cheap, dirty coal. Or worse, deforestation for firewood. Thus another way to ameliorate under-supply in our global energy supply-demand balance is if global coal continues growing, reaching a new peak of 9GTpa in 2030. Unfortunately, this scenario also sees global CO2 hitting a new peak of 54GTpa in 2030.

(4) Pragmatic gas? Another means of re-balancing the global energy system is if global gas production rises at 2.5% per year, which is the number required, and that is possible, on the TSE roadmap to net zero (model here). This scenario does see global CO2 falling by 2030. The main problem here is that pragmatic natural gas investment has become stranded in no man’s land, within a Manichean duality of fantasies and crises.

(5) Some combination? The world is complex. It is unlikely that a single lever will be pulled to resolve under-supply in our global energy supply-demand balance. In 2023, we think economic weakness will mask energy under-supply, mute energy prices, and lure many decision makers into looking at spot pricing and thinking “everything is fine”. Please download the model to stress-test the numbers, and different re-balancing solutions…

Copyright: Thunder Said Energy, 2019-2024.