Technology drives 30-60% of energy companies’ return on capital. This is our conclusion after correlating 10 energy companies’ ROACEs against 3,000 patent filings. Above average technologies are necessary to generate above-average returns.
For the first time, we have been able to test the relationship between oil companies’ technical abilities and their Returns on Average Capital Employed (ROACE).
In the past, technical capabilities have been difficult to quantify, hence this crucial dimension has been overlooked by economic analysis in the energy sector.
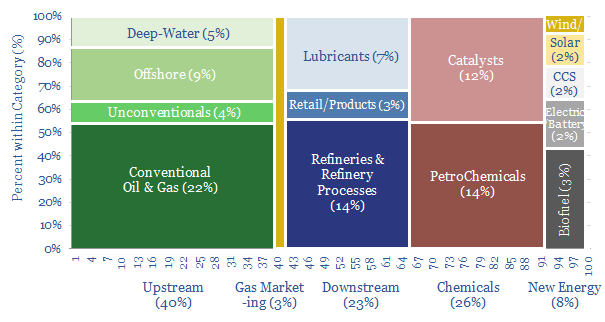
Our new methodology stems from our database of 3,043 patents, filed by the Top 25 leading energy companies in 2018. The data cover upstream, downstream, chemicals and new energy technologies (chart below) . All the patents are further summarised, “scored” and classed across 40 sub-categories.
The methodology is to correlate our patent-scores for each company with the ROACE generated by the company in 2018. We ran these correlations at both the corporate level and the segment level…
Results: patent filings predict returns
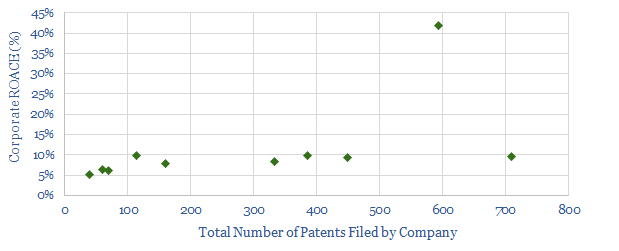
Patent filings predict corporate returns. In 2018, the average of the Top 10 Integrated Oil Majors generated a Return on Average Capital Employed (ROACE) of 11%, based on our adjusted, apples-to-apples calculation methodology. These returns are 54% correlated with the number of patents filed by each Major (chart below).
Technology leaders are implied to earn c5% higher corporate returns than those deploying industry-average technologies, which is a factor of 2x.
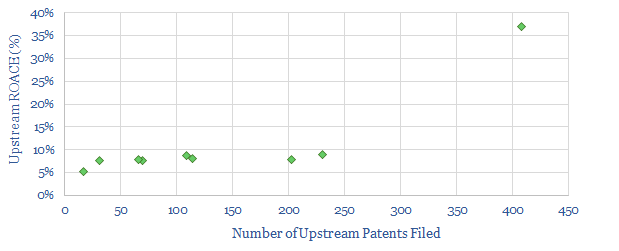
Upstream patent filings also predict upstream returns, with an 85% correlation coefficient. The data are skewed by one Middle East NOC, which earns exceptionally high returns on capital, but even excluding this datapoint, the correlation coefficient is 65% (chart below).
The curve is relatively flat, with the exception of two outliers, implying that it is hardest to improve general upstream returns using technology. This may be because upstream portfolios are vast, spanning many different asset-types and geographies.
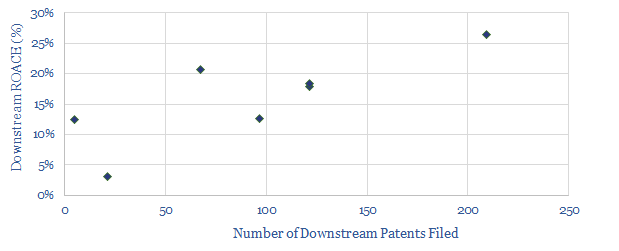
Downstream patent filings predict downstream returns, with an 80% correlation coefficient (chart below). However, our sample size is smaller, as we were unable to dis-aggregate downstream ROACE for all the Majors.
The curve is very steep, indicating that downstream technology leaders can surpass c20% returns on capital, versus c10% using industry-standard technologies.
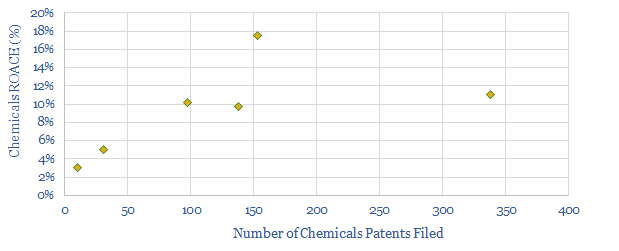
Chemical patent filings predict chemical returns, with a 57% correlation coefficient (chart below). Again, our sample size is smaller, as we could only estimate chemicals ROACEs for some of the Majors.
The curve is also steep, with technology leaders earning c10-20% returns, versus low single digit returns for less differentiated players.
Overall, the results should matter for investors in the energy sector, for capital allocation within corporates, and for weighing up the benefits of in-house R&D. We would be delighted to discuss the underlying data with you in more detail.