SuperMajors’ shale developments are assumed to differ from E&Ps’ mainly in their scale and access to capital. Superior technologies are rarely discussed. But new evidence is emerging. This 11-page note assesses 40 of Chevron’s shale patents from 2019, showing a vast array of data-driven technologies, to optimize every aspect of unconventionals.
Page 2 explains how we assessed Chevron’s shale patents, to identify technologies that could support guidance for 900kboed of Permian production by 2023.
Page 3 sets out Chevron’s technologies for shale exploration and appraisal, based on recent seismic patents.
Page 4 sets out Chevron’s technologies for shale drilling, based on recent patents, many of which are co-filed with Halliburton, around a specific innovation.
Pages 5-8 set out Chevron’s technologies for shale completions, through an array of sophisticated, proprietary and increasingly digital technologies. These will not only help in the Permian, but also in de-risking international basins.
Page 8 sets out Chevron’s potential edge in completion fluids. We are particularly excited by the promising results from field-tests of anionic surfactants.
Page 9 sets out Chevron’s data-driven flowback practices, including productivity gains from field tests in the Vaca Muerta.
Pages 10-11 set out Chevron’s technologies for upgrading NGLs into gasoline-, jet- and diesel-range products, using industry-leading ionic liquid catalysts.
Page 11 concludes with implications for the broader shale industry.
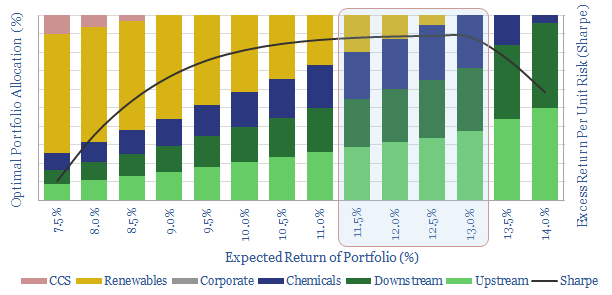
Followers not leaders? In a commodity industry, it is important to invest with superior technologies, if you want to generate superior returns. Hence we have been relatively cautious on the Majors’ offshore wind investments. Commoditised, industry-standard technologies yield single-digit returns at best. Model it from a portfolio perspective, and the optimal portfolio allocation to undifferentiated renewables technology is just 5-13% (chart below, note here).
Leaders not followers. 2018 did include some encouraging solar innovations from Oil Majors, as reviewed in our data-file (below). But as we start reviewing 2019’s patent filings, we are looking for examples of Energy Majors developing superior technologies for traditional, offshore wind. Today’s note highlights an example…
[restrict]
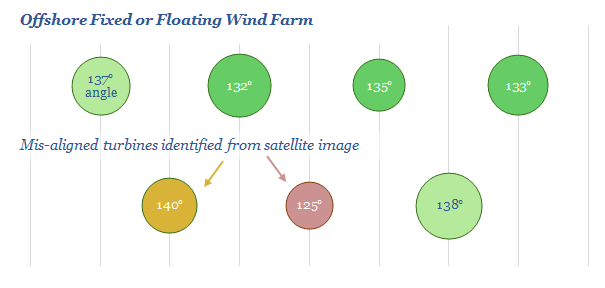
Equinor has patented a new wind monitoring methodology
Yaw misalignment is a challenge in the wind industry, denoting the variation of a wind turbine’s blades from their optimal orientation facing directly into the wind. It reduces turbines’ productivity, and exacerbates wear, shortening a project’s lifetime. It is particularly problematic for fixed and floating offshore wind turbines.
Current methods to orient turbine blades all have limitations.
Anemometers on the turbines’ nacelle can be used to measure wind direction (and strength), however, it is difficult to obtain accurate readings in the turbulent air behind rotor blades.
LiDAR can be measured on turbines, illuminating the target with a pulsed laser light and sensing the reflected pulses. However, LiDar is costly and can only mesaure one turbine at a time.
iSpin uses three ultrasonic sensors on the rotor’s spinner (i.e., the cone-shaped cover at the centre), but this requires expensive instrumentation on the turbine.
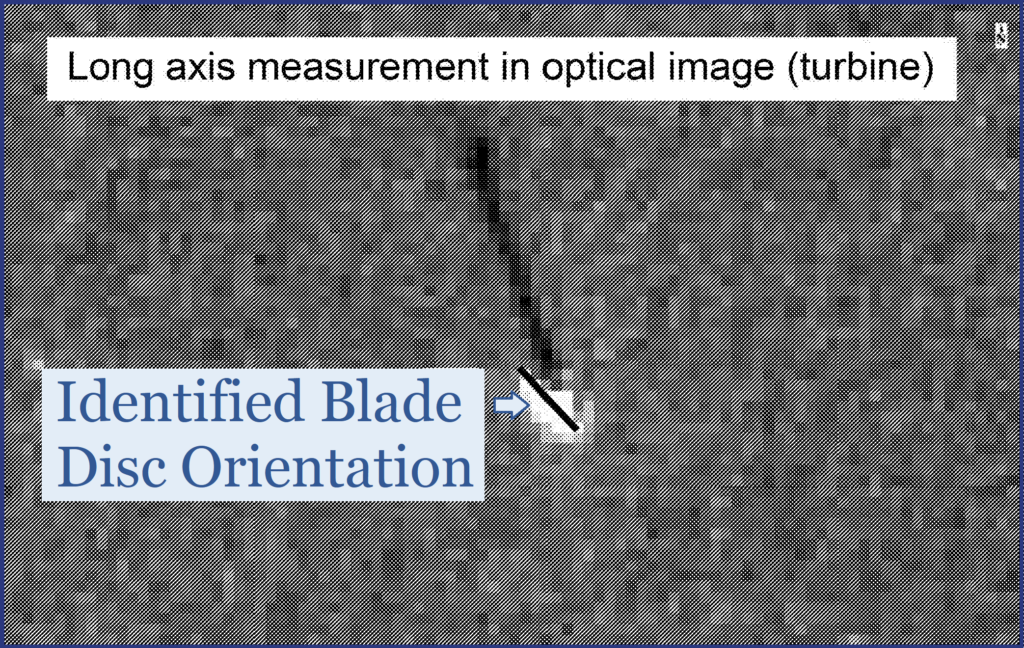
Equinor has patented a new approach: a computer vision method, which can identify the orientation of wind turbines’ rotor blade discs from visual images; taken via a UAV (drone), a satellite image or from a suitable fixed platform. Satellite imagery is most discussed in the patent (chart below), adding to our growing list of satellite applications in industry.
The methodology: Each turbine, and each blade disc are identified from the images, based on machine learning (similar to the algorithms used for facial recognition). The disc’s angle to the North line may be determined, and its blade diameter is tabulated. Outliers that are more than 3-, 5- or 8- degrees misaligned may be identified. Remedial action is taken for misaligned turbines, culminating in an O&M plan
Aadvantage of the method are that:
The images are “synoptic”, providing information about the overall state of the overall windfarm, to determine if any any one turbine is misaligned.
On site inspections are not necessary if the data are based off satellite imagery, helping to reduce opex, HSE risks and environmental footprint.
Appropriate flexibility can be incorporated. “Sometimes conditions may be turbulent and so all of the wind turbines may “see” a different wind direction”.
Economic opportunities: what is the impact on NPVs?
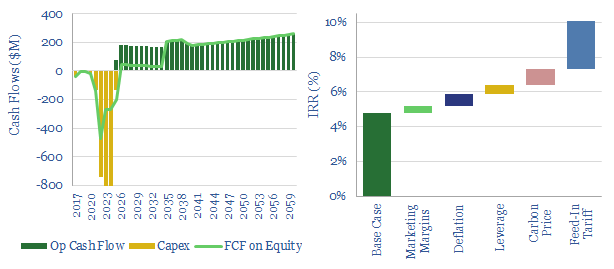
Equinor notes the opportunitythat if “all wind turbines can be kept properly aligned, production could be increased by 2%, worth c£8Mpa at a typical wind farm. We have replicated the calculations at our model of a typical US Offshore Wind project, finding a $10M uplift to annual cash flow is possible in a best case scenario, uplifting the project’s levered IRR by c0.5%, creating an additional c$100M of NPV6.
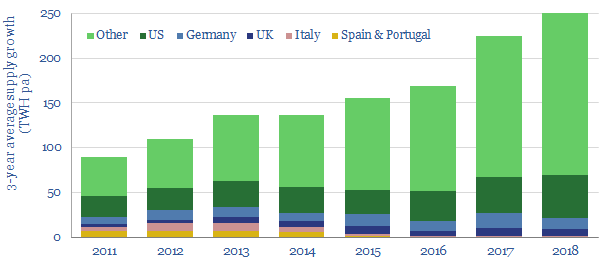
We remain prepared for a slowdown in offshore wind activity in Europe, as renewables are close to reaching saturation in heartland markets (chart below). But as the industry expands into new geographies, we remain hopeful that Energy Majors will be ‘leaders not followers’ as they participate in more projects.
Source:
Source: Keseric, N. & Hall, R. (2019). Wind turbine blade orientation detection. Equinor Patent, GB2568676A.
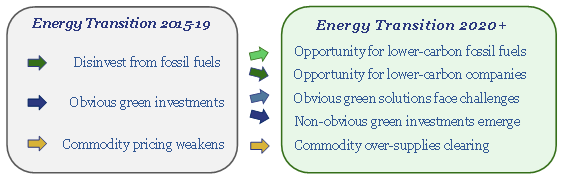
Investors may suffer if they do not consider the energy transition. But they may suffer more if they consider it, and get the answer wrong. We argue that the best way to drive the energy transition will be to maximise carbon-adjusted investment returns.
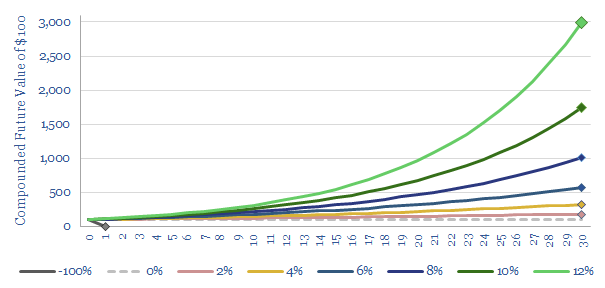
Our starting point is the chart below, which focuses on the power of compound interest, “the most powerful force in the universe” (the quote has been ascribed to Albert Einstein). This is not our usual tack — which focuses upon energy technologies, economics or quantifying CO2 — but purely mathematics…
The difference is enormous between compounding at, say, 4% and 12%. It may not sound material in any given year (“it’s just 8%”). But over a thirty year investment horizon, it makes the difference between a $100 initial investment rising to c$300 and $3,000 of value (i.e., a factor of 10x).
How this applies to the energy transition is that we currently observe institutional investors backing away from high-return (10-20% per year), industrial asset classes, which are feared to be high-carbon, towards low-returning asset classes (4-6% per year), which are perceived to be low-carbon.
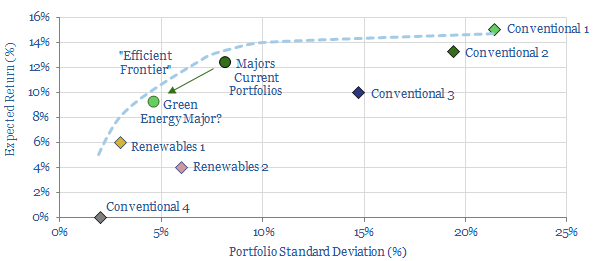
For oil companies, the spread of opportunites is charted below (note here). Measured over any single year the difference may be imperceptible. But over 30-years it is vast.
By down-shifting from high-return assets to low-return assets, the costs of mitigating climate change end up falling upon the shoulders of institutional investors: endowments, foundations, hopeful retirees; as a hidden cost.
It is not for us to say whether this kind of hidden cost is morally right or wrong. But we can say that it is sub-optimal, in economic terms, because unlike a visible cost (e.g., a direct “carbon price”), it will not change behaviours in ways that actually drive decarbonisation.
No “incremental” energy transition occurs when investors divest from traditonal industrial sectors; and instead, outbid each other to finance the same renewable energy projects. A better alternative is needed.
Investment firms understand the challenge. This week, Blackrock’s CEO, Larry Fink, published a letter to CEOs, stating how climate change will “fundamentally re-shape finance”. What is not being reshaped, of course, is the maths of compound returns. Mr Fink’s letter begins by highlighting “we have a deep responsibility to institutions and individuals … to promote long-term value”. So how can this happen?
Three better alternatives for investors in the energy transition
In order to drive incremental energy transition, it is necessary to attract incremental capital. It must flow towards high-returning technologies and projects, which can drive decarbonization. This is our central tenet on investing for an energy transition. And it underpins the opportunities that excite us most in 2020 (chart below), which should all seek double-digit returns. Seen this way, climate change is not a cost to be passed on to investors, but a positive investment opportunity, to help meet a societal need.
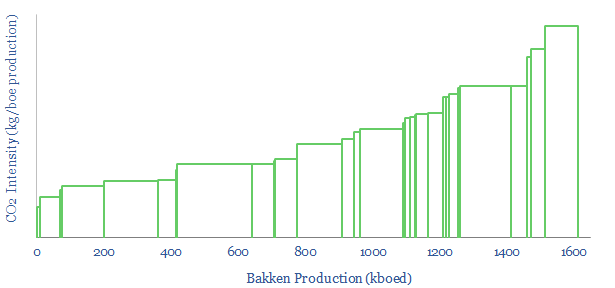
A second alternative is to allocate more capital to companies that offer attractive returns and also have lower carbon contributions than their peers: such as lower-CO2 oil and gas producers, shale producers, refiners, midstream or chemicals companies. On any decarbonized energy model that we can construct, demand for gas will rise and demand for low carbon oil will not collapse. We have reams of data to help you with this screening. Often it is due to superior technologies.
Example: High- and low-CO2 producers ranked in the Bakken, https://thundersaidenergy.com/downloads/us-co2-and-methane-intensity-by-basin/
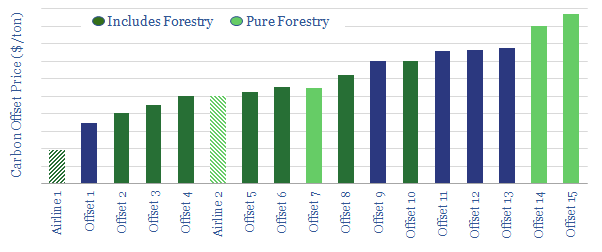
A third alternative could be to offset CO2directly, as you continue investing in high-returning, industrial companies. This still leaves investors paying for the cost of climate change out of their future returns. But the cost is much lower than if investment returns are sacrificed by divesting from industrial companies and funding renewables.
For example, we recently tabulated the costs of carbon credits, being offered by 15 separate offset schemes. Based on the data, we calculate that an investor could buy a SuperMajor oil company with an average distribution yield of 7%; offset their investment’s entire Scope 1&2 emissions for a drag of just 0.5pp; leaving their “zero carbon cash yield” at 6.5%. (It will be interesting which forward-thinking Super-Major is first to apply this logic and offer up such a “carbon-offset share class”).
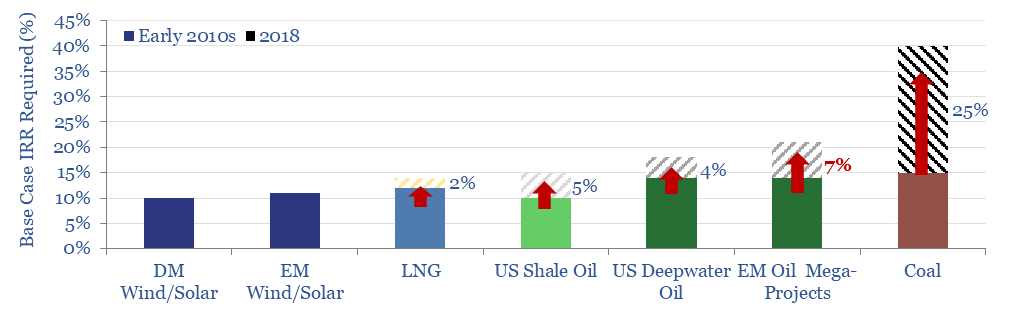
The end point is that high carbon companies will see higher capital costs (and our survey work indicates this is already occurring, chart below). But how much higher? In an efficient carbon market, there is an easy answer: high enough so that the extra yield of Investment X (vs Investment Y) can be re-invested in carbon credits to offset the extra CO2 of Investment X (vs Investment Y).
These ‘carbon adjusted returns’ are directly comparable. The higher carbon- and risk- adjusted return equates to the better investment. The higher the carbon price, the higher the relative cost of capital for high-carbon companies; and the higher the relative incentive to lower emissions.
This system, we believe, will be much more sophisticated and effective in driving a full-scale energy transition that the blunt-force strategy of “divest from oil and buy renewables”. It will also not leave investors short-changed, by up to 90%, when they come to meet their budgeting or retirement needs in 2050.
Please do contact us if you have any observations, questions or comments; or would like to discuss some of the “long-term value” opportunities, which we think can help drive the energy transition…
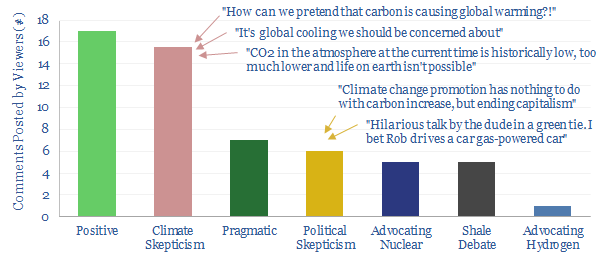
Last year, we appeared on RealVision, advocating economic opportunities that can decarbonize the energy system. The “comments” and reactions to the video surprised us, suggesting the topic of energy transition is much more polarized than we had previously thought. It suggests that delivering an energy transition will need to be driven by economics, whereas polarized politics are historically dangerous.
The fist 50 comments from our RealVision interview are tabulated below. 17 were positive and enthusiastic (thank you for the kind words).
But a very surprising number, 16 of the comments, attacked the science of climate change. It is perhaps not a fully fair represenation, as those with extreme views are more likely to post comments in online forums. But 30% dissent is still surprisingly high. Read some of these comments, and it’s clear that fervent opinions are being expressed. Even moreso on our youtube link.
6 of the comments also challenged the politics behind energy transition, expressing concerns that some politicians are evoking fears over climate change in order to justify policies that are self-serving and only tangentially related to the issue.
These attacks are from an unusual direction. Living in New Haven, CT, we are more used to being criticised for seeing a continued, strong role for lower-carbon and carbon-offset fossil fuels in the decarbonised energy system (chart below).
Indeed, another sub-section of the comments argued that our views did not go far enough. 6 of the comments called for a greater emphasis on nuclear or hydrogen and continued vilification of traditional energy companies. Our economic analysis suggests economics will be challenging for hydrogen, while nuclear breakthroughs are not yet technically ready. But one commentator, for example, dismissed this analysis and said our views must be “ideologically driven”.
Mutual animosity was also clear in the comments section of the RealVision video. One comment reads “you are completely delusional..sorry that you got fed the wrong info by these fraudsters in suits and their little girl puppet. You’ll wake up to reality one day.” Another reads “let our kids and future generations figure it out like we had to from our forefathers!”. At last year’s Harvard-Yale football game, the protesters met any such criticism from the crowd with a chant of “OK boomer”.
Deadlock? Others in the comments section tried debating the climate science. One statement was criticised as a “typical ‘we know better’ argument”. Another commenter opined that all peer-reviewed scientific literature is “fraudulent”. The most sensible comment in the mix noted “very little space left between ‘Greta Evangelists’ and equally fanatical ‘haters'”. This appears right. It is a polarized, poisonous, deadlocked debate.
Historical parallels? Over the christmas break, I enjoyed reading James McPherson’s ‘Battle Cry of Freedom’, which described the gradual polarization of ante-bellum America, in the 25-years running up to the US Civil War. One cannot help seeing terrifying similarities. Animosity begat animosity. Eventually the whole country was divided by an ideology: abolitionists in slave-free states versus the unrepentant slave economies.
Ideological divides are also deepening in the energy space. 40% of world GDP has now declared itself on a path to zero carbon. What animosities will emerge between these carbon-free states and the unrepentant carbon economies?
Economic opportunitiesin energy technologies remain the best way we can see to deliver an energy transition without stoking dangerous animoisities. They will remain the central theme in our research in 2020, and we are aiming to stay out of the politics(!). Our RealVision video is linked here.
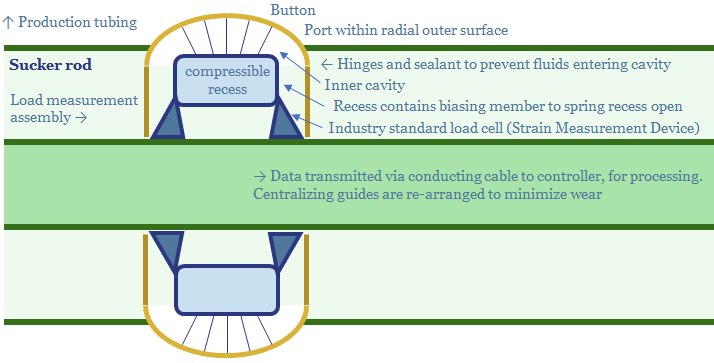
EOG patented a new digital technology in 2019: a load assembly which can be built into its rod pumps: to raise efficiency, lower costs and lower energy consumption. This 8-page note reviews the patent, illustrating how EOG is working to further digitize its processes, maximise productivity and minimise CO2 intensity.
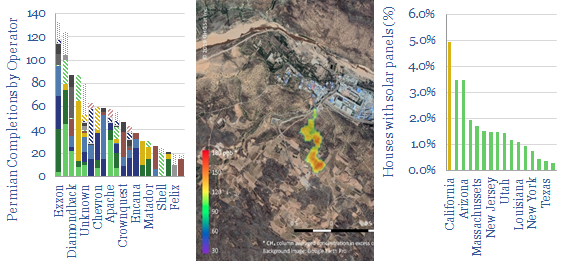
Satellite-based analysis is gaining momentum, and features in three of our recent research reports. A step-change in resolution is helping to mitigate methane leaks and scale up low-carbon gas. It is possible to track Permian completion activity from space. We also suspect renewable growth may slow, as small-scale solar brings heartland markets closer to saturation. Satellite images should continue finding its way into commercial research, as data improves and costs deflate.
The Spy Who Loved Methane
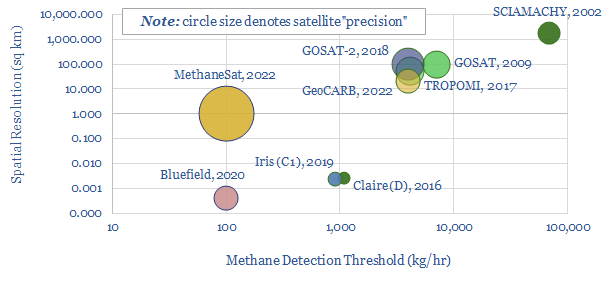
If 3.5% of natural gas is “leaked” as it is commercialised, then it is debatable that natural gas may be a ‘dirtier’ fuel than coal, because methane causes 25-120x more radiative forcing than CO2. Hence it is crucial for the scale up of natural gas – and for the energy transition – that methane leaks are mitigated. Our recent note, ‘Catch Methane if you Can‘ outlined five breakthrough technologies to help, based on screening 34 companies and 150 patents (chart below).
Satellites were among the breakthrough technologies, with the capability to find methane leaks from space. This matters as c5% of super-emitting leaks comprise c50% of leaked methane volumes. But pinpointing these leaks – and who is reponsible for them – has not previously been possible. The current satellites in orbit have had spatial resolutions of 50-100 sq km and detection thresholds of 4-7Tons/hour. By 2022, this will improve to <1sq km spatial resolutions and c100kg/hour. Full details are contained in the note and data-file.
Tracking Shale Completions from Space?
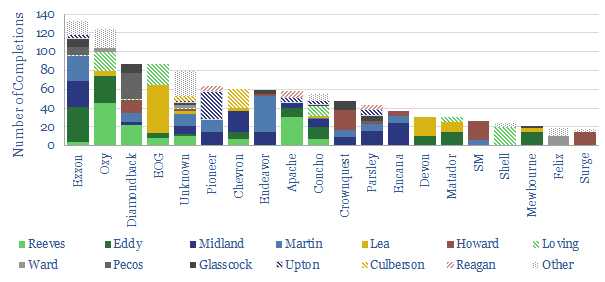
Another debate in 2020 is whether the shale industry is slowing down, in activity terms, in productivity terms, or whether it is staring to re-accelerate. Based on reviewing 650 recent technical papers, we know the best companies are continuing to improve underlying productivity; while they can also re-attract capital and growth by touting low carbon credentials, with some ever potentially becoming “carbon neutral” .
Satellite imagery shows how the industry is consolidating. Below, using data from Terrabotics, we can count the number of completions in the Permian, by operator and by county, in 3Q19. The ‘Top 10’ companies now comprise half of all completion activity. For an introduction to Terrabotics, and their data, please contact us.
Renewables slow-down: Could it be soooner?
Another theme for 2020 is whether renewables growth will slow down, as heartland markets reach grid saturation. This was the precedent when Spain and Portugal reached 25% penetration of renewables in their grids. The UK, Germany and California could follow suit this year, as explored in detail here.
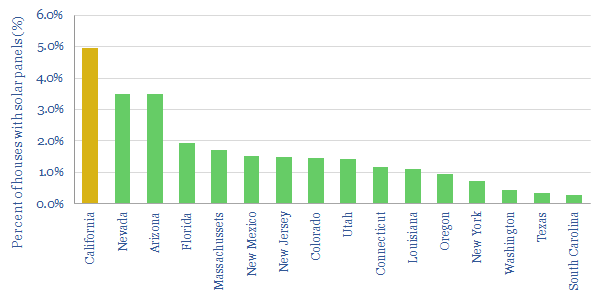
What is not quantified in our data-set of large-scale utility plants is small scale renewable penetration, such as rooftop solar. However, satellite are also starting to unearth these smaller-scale systems, finding them to be more extensive than expected. For example, Stanford’s “Deep Solar” project, has used machine learning to identify over 1.5M solar installations from 1bn satellite images. 5% of houses in California are found to have rooftop solar systems, suggesting renewables are even closer to their threshold.
How do you use satellites in your process?
We are incorporating satellite imagery into more of our research, as evidenced by the three examples above. We write about technologies in the energy space, but these technologies are also changing the commercial research space. We would be very interested to hear from you, if you have observations on the topic, or would like to discuss useful data sources.
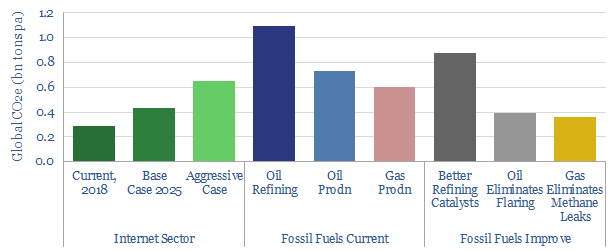
This short note outlines our top conclusions about the energy consumption of the internet, which now comprises c2% of global electricity and 0.7% of global CO2. In the next decade, remarkably, the CO2 footprint of powering the internet could surpass that of producing oil or gas.
[restrict]
Energy consumed by the internet?
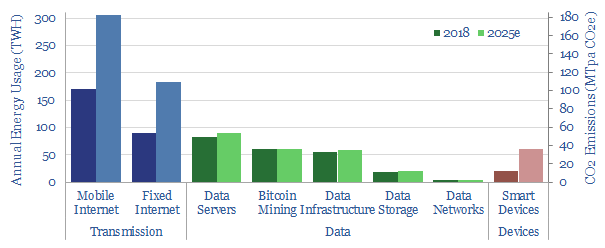
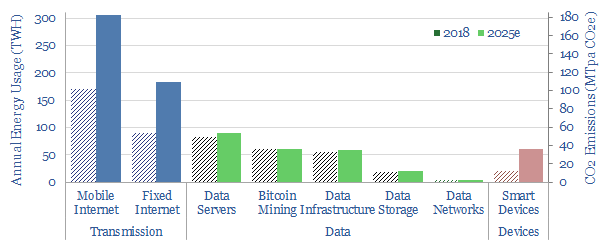
c500TWH of electricity is likely consumed to power the internet in 2019 (chart below), which is almost 2% of the world’s 27,000 TWH electricity market, and 0.8% of the world’s total global energy. To illustrate the point, consider the ‘top five facts’ we have found on the digital world’s energy footprint…
(1) A single google search activates data centers in 6-8 locations globally, consuming 0.3 watt-hours of energy and emitting 0.2g of CO2.
(2) Yet 80% of the internet’s data volumes are for video. For example, the 6.5bn cumulative YouTube views for the song, ‘Despacito’, have consumed as much energy as 50,000 US homes do annually, around 0.55TWH.
(3) A smartphone may weigh 100-200g, directly consuming 2kWh of energy per year, but the underlying data footprint is equivalent to a fridge, weighing 100-200kg, consuming 500-1,000kWh of energy per year.
(4) BitCoin mining is estimated to consume 40-60TWH of energy in 2019: about the same as the total grid in Greece, Peru or Singapore.
(5) Data centers. A $1bn Apple data centre planned for Athenry, Galway, expects to eventually use 300MW of electricity, 8% of Ireland’s national capacity, potentially more than Dublin. 40% of the energyuse in data-centers is for cooling, hence one IBM data centre in Switzerland is used to warm a nearby swimming pool.
A meaningful contributor to global CO2.
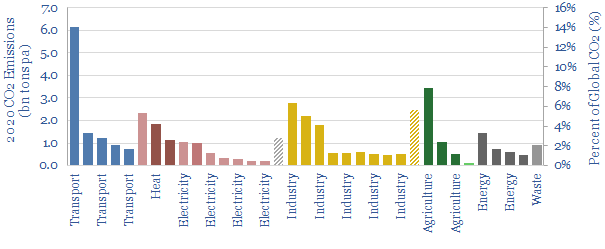
0.8% of the world’s energy is a small percentage. Nevertheless, it is meaningful, because global CO2 emissions are extremely fragmented (chart below). The largest single contributor is passenger cars, but this is just c14% of the total. 30 individual sub-industries in our data-file each comprise <3% of the world’s total emissions, but cumulatively account for over 50% of the CO2e.
Internet energy use is also growing
Future internet energy use is uncertain, finely balanced between 20-40% growth CAGRs and 20-30% annual efficiency gains. But a sensible base case forecast for 2025 foresees growth to around 700TWH (chart below).
On the one hand, Cisco thinks global internet traffic will increase 3x in the next 5-years. 4.2 zetabytes of data will be transmitted in 2022, doubling from 2 zetabytes in 2019 and quardupling from 1.1 zetabytes in 2017. A rough doubling is suggested every 2-3 years. Similarly, Gartner estimated the number of internet connected devices will rise from 8bn in 2017 to 20bn in 2020. (Our CO2e estimates also exclude the emissions required to manufacture these devices and their battery materials).
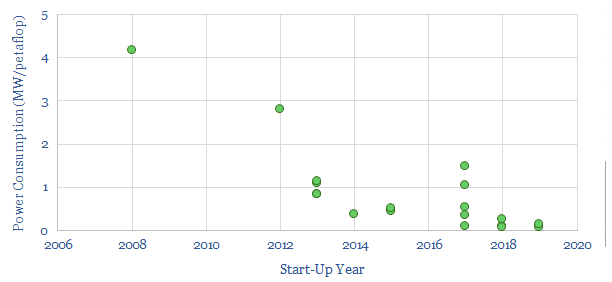
On the other hand, chips continue getting more efficient, as we saw when screening the Majors’ Super-Computers (chart below). 60TWH of traditional data centers (c50% energy efficiency) are being phased out and replaced with hyperscale data centers (80-90% efficiency). The industry is also phasing out “zombie servers” which consume 25% of the sector’s energy but do no useful work.
Combining these trends, the IEA sees the internet’s electricity demand peaking at c4% of the global total. More pessimistic estimates from Huawei fear the internet could rise to 8-20% of global electricity use by 2030. But let us grant the benefit of the doubt to efficiency gains for now.
Internet emissions versus oil and gas emissions?
What is most striking about our numbers is that CO2-emissions to power the internet’s 700-1,000 TWH of energy needs in 2025 could emit 0.5-0.7 bn tons of CO2e. This could surpass the CO2-equivalent emissions from producing oil (if oil flaring can be eliminated) or from producing gas (if methane emissions can be eliminated).
Interesting considerations are raised for the way ESG investors allocate capital. It is doubtful that there will be mass campaigning for “divestment” out of internet stocks. Instead, we argue carbon-conscious investors, who are aiming to drive an energy transition, must look industry by industry, company by company, in order to prioritise leaders and avoid laggards.
We argue CO2-labelling is the most important policy-measure that can be taken to accelerate the energy transition: making products’ CO2-intensities visible, so they can sway purchasing decisions. There is precedent to expect 4-8% savings across global energy use, which will lower the net global costs of decarbonisation by $200-400bn pa. Digital technologies also support wider eco-labelling compared with the past. Leading companies are preparing their businesses.
Faster Efficiency gains are critical to decarbonisation. We model it is possible to fully decarbonise the world’s energy system by 2050: c17% by ramping renewables, 26% by shifting to less CO2-intensive fossil fuels (which still grow in absolute terms to 2050), 27% through carbon capture initiatives and 30% through industrial efficiency gains and demand-side technologies, which get “more for less” (chart below). To repeat, the largest contributor to eliminating 2050’s CO2 is using energy more efficiently.
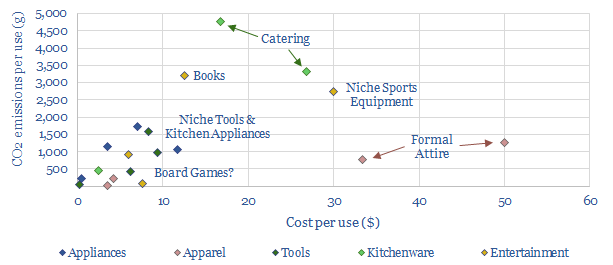
A problem: consumers currently have almost no idea whether they are consuming energy efficiently when making purchasing decisions. particularly in the food industry, which can comprise up to 30% of an individual’s carbon footprint, at 2.5T of CO2e pp pa (chart below, data here). One recent study in Nature found that 1000 consumers under-estimated the CO2 emissions of their dietary items by as much as 10x [1]. 59% of consumers confess being confused which foods count as sustainable.
A few examples show how helpless we are at fore-knowing the carbon footprints of our purchases: How much more CO2 is there in 1kg of beef versus 1kg of vegetables? (the answer is a stark 13.5x, at 27kg vs 2kg). How about 1kg of cheese vs 1kg of milk (answer: 13.5kg vs 1.9kg). How about a typical book versus a typical tennis racquet? (answer: 6kg vs 3kg, chart below, data here). How about a “high CO2” versus a “low CO2” chocolate bar (6.5kg vs 0kg, as CO2-impact can vary 50x, within producers of the same product [2]). Is more CO2 saved by driving an electric car for a whole year or by forgoing a single Trans-Atlantic round-trip flight? (answer: both are around 2-3 tons). Are there any CO2-negative products for purchase? (there are, data here).
CO2 labelling must be a solution. If consumers are to favour lower carbon products, then knowledge is the first step. It is necessary to be able to compare and contrast products. This is “eco-labelling”: placing a label for the CO2 associated with each purchasing option. Ideally it is a numerical calculation, or more simply, a traffic-light (red, yellow, green) may be adopted.
Eco-Labelling in Practice: A Short History?
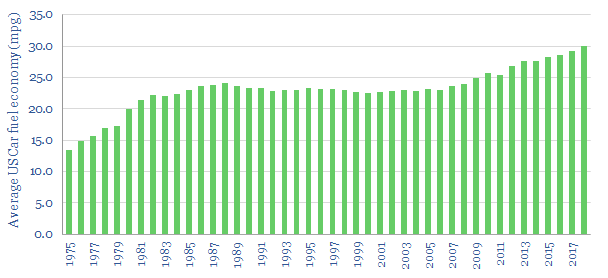
A precedent. CAFE standards for cars are the best-known, longest-running eco-labelling program. They go back to the 1973-4 oil crisis. Today, OEMs are required to use EPA-certified fuel economy test results and cannot advertise any other fuel economy metric for vehicles. Making fuel efficiency visible to consumers has been one driver behind the impressive 2% pa CAGR in US fuel economy (chart below).
Likewise, EU Ecolabels were established in 1992, to identify environmentally friendly products: at this time, 75% of fridges and freezers were rated as low efficiency (ratings D-G) while today, 98% are classed as highly efficient (ratings A++ or A+++), cutting their emissions by c7%. The label informs 85% of consumers’ purchasing decisions. What gets inspected by consumers is thus respected by suppliers.
Prior eco-labelling schemes have been attempted for broader consumer products, but the technology may not have been ready. The first supermarket carbon labelling program was implemented by Carbon Trust, in the UK, in 2006. It included Walkers Crisps, British Sugar and Quaker Oats. Tesco trialled carbon labels on milk, detergents, oranges and toilet paper in 2007, but the pilot was shelved in 2012, due to unforeseen costs and lack of take-up. Subsequent schemes have been trialed in Canada, Japan, Korea, Thailand, Switzerland, France, Finland and the US.
Digital technologies can help, making it easier to add up the CO2 associated with each input, at each successive stage of the supply chain, to yield a final estimate at the point of consumption. This will produce more precise estimates than in the past, which are more auditable and less expensive to compute.
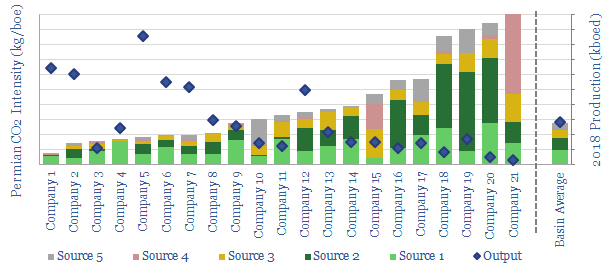
The US already has a toehold, through the EPA’s FLIGHT tool, which covers most industrial facilities and has a broad coverage. For example, it recently allowed us to decompose Permian producers’ total CO2-intensities (chart below, data here).
Technology companies are emerging to make further progress. As an example, Ecoingot is using a mobile phone-based scanner alongside app based on calculations, RFIDs and retailer data to make products’ CO2 visible to consumers. It is working with Whole Foods, Walgreens and CVS. Climate Neutral also launched in 2018, to help brands declare their intent to eliminate CO2 emissions in their products.
Policies could help further.
One past challenge has been that disclosures are voluntary, which means lagging
producers have no incentive to identify themselves. Policies for mandatory
eco-labelling may change this. For example, Denmark has announced climate
labelling on food products will accompany its plan to become carbon neutral by
2050: stickers will be placed on all food products to improve consumer choice. A
petition is currently gathering signatures in Germany, lobbying for a similar
requirement.
Consumers support it. A recent YouGov survey
of 9,000 consumers, across seven countries, found 67% support for recognisable
CO2 labelling on products. 66% of survey participants also say
they would feel more positive about companies that can demonstrate they are
making efforts to reduce carbon footprint of their products.
Companies support it. In December-2018, Carbon Trust estimated it was doing 40-50x more life-cycle CO2 analyses than a decade ago, particularly in the business-to-business category. Case studies on its website include BT, Carlsberg, Dyson, Evian, GSK, Howdens, Samsung, Vodafone et al. Pick one of these examples at random, and you learn that a Dyson Airblade hand-dryer is 80% more energy-efficient than the industry standard. It is not just in the oil industry that carbon credentials are set to impact capital costs.
What are the impacts on decarbonisation?
Impacts of Eco-Labelling? A Norwegian study has measured a 9% reduction in meat consumption, after adding traffic-light eco-labels in a University cafeteria [3]. Likewise, an Australian super-market found a 15% reduction in the sales of “black-labelled” goods and a 8% increase in green-labelled goods, after implementing its own pilot [4]. More ambitiously, Tesco and WWF have launched a campaign to cut the environment impact of the average UK shopping basket by 50%.
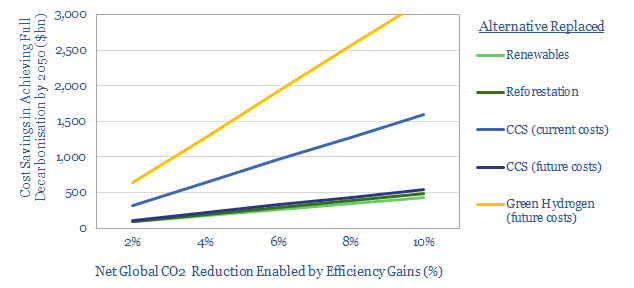
Costs of Decarbonisation could be lowered by c$200bn per annum in our base case scenario, where an c8% CO2 saving is achieved on 50% of products (chart below). Thus a lower reliance upon CCS or reforestation is required in our decarbonisation models. The savings could surpass $1trn per annum if the reliance is lowered on costly green hydrogen technologies, although these do not currently feature heavily in our decarbonisation models. Double the savings from eco-labelling, if the practice can drive a c8% efficiency gain through the entire energy system, and $400bn of annual savings are achieved.
We conclude one of the most critical policy challenges to drive the energy transition is to mandate broad CO2-labelling of products, so that consumers can begin selecting lower-CO2 items, where today’s visibility is woefully poor. In turn, this will reward companies that improve their emissions and disfavor those that do not. Decarbonisation will not be achieved by making the energy industry into a Waste Land, but by strengthening its efficiency.
References
[1] Camilleri, A., Larrick R. P., Hossain, S. & Patino-Echeverri, D. (2019). Consumers underestimate the emissions associated with food but are aided by labels. Nature.
[2] Poore, J. & Nemecek, T. (201). Reducing food’s environmental impacts through producers and Consumers. Science 360 (6392) 987-992,.
[3]
Slapo, H. B. & Karevold, K. I. (2019). Simple Eco-Labels to Nudge Customers
Toward the Most Environmentally Friendly Warm Dishes: An Empirical Study in a
Cafeteria Setting.
[4] Vanclay, J.K., J. Shortiss, S. Auselbrook, A.M. Gillespie, B.C. Howell, R. Johanni, M.J. Maher, K.M. Mitchell, M.D. Stewart, and J. Yates. 2011. Customer Response to Carbon Labelling of Groceries. Journal of Consumer Policy 34: 153–160.
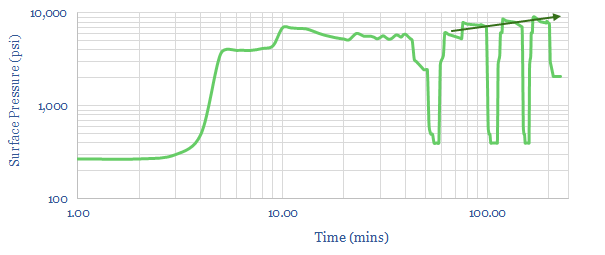
The key challenge for the US shale industry is to continue improving productivity per well, as illustrated repeatedly in our research. Hence, this short note reviews an advance in fracturing fluids, which has been patented by BP. Diverter compositions are optimised across successive pressurization cycles, to create dendritic fracture geometries, which will enhance stimulated rock volumes.
[restrict]
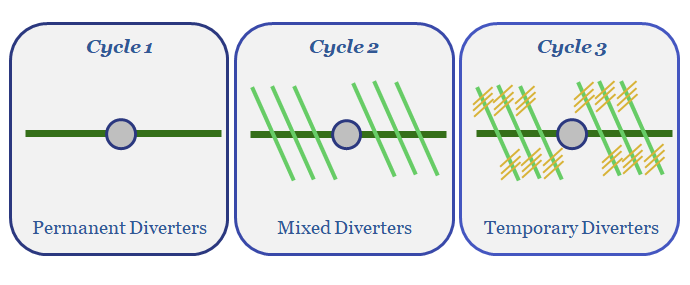
BP has patented a novel regime of fracturing fluids,which can be deployed across multiple pressurization sequences in its shale completions. The first sequence contains permanent diverting agents, introduced to create bi-wing and large fractures, then flowed back. The second fluid contains temporary, near-field diverting agents, which will dissolve in situ, usually within 24-72 hours, to expand the fracture network. Similarly, the third fluid contains temporary, far-field diverting agents.
The purpose of this completion design is to create dendritic fracture geometries. The diverting agents prevent fracturing fluids from leaking into the formation, so that primary, then secondary, then tertiary fracture networks can be created independently, each improving reservoir fluid conductivity (chart below).
The approach is data-driven. The formation of new fractures, with increasingly dendritic geometries, can be inferred from a linear slope between instantaneous shut in pressures on successive pressurization cycles. The fracturing fluids’ composition is also said to be determined based on Instantaneous Shut in Pressures, in-situ stress calculations and flowback volumes.
The permanent diverting agents may comprise mesh proppant, walnut hulls, large grain size proppants or particulates, such as polylactic acid, benzoic acid flakes, rock salt, calcium carbonate pellets. Small mesh size is envisaged (40-70 to 100 mesh), with low concentrations (0-0.1 lb/gal) to mitigate the risk of screen-outs.
The temporary diverting agents are not specifically disclosed in the patent, but are intended to dissolve in response to temperature, salinity, pH or other parameters. They may be pumped alongside proppant or standalone.
The patent is increasing evidence that Oil Majors are now innovating at the cutting edge of shale, in order to drive productivities higher. For a review of which companies screen as having the most advanced shale technologies, from the patent literature, please see our recent note, Patent Leaders.
Source: Montgomery, R., Hines, C. & Reyna, A. (2018). Hydraulic Fracturing Systems and Methods. BP Patent US2018202274
Precision-engineered proteins are on the cusp of disrupting the meat industry, according to an exceptional, 75-page report, published recently by RethinkX. The science is rapidly improving, to create foods with vastly superior nutrition, superior taste and superior costs, by the early-2020s.
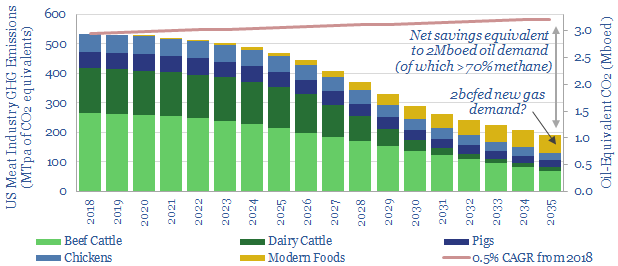
The energy opportunities are most exciting to us, after reading the report. If RethinkX’s scenarios play out, we estimate: direct CO2 savings of 400MTpa, enough to offset 10% of US oil demand; 2bcfd of upside to US gas demand; and enough land would be freed up to decarbonise all of US oil demand, or increase US biofuels production by 6x to c6Mbpd.
[restrict]
RethinkX Re-Thinks Food and Agriculture
ReThinkX argues “we are on the cusp of the deepest, fastest, most consequential disruption in food and agricultural production since the first domestication of plants and animals ten thousand years ago”. The disruption is producing proteins via precision fermentation (PF), which programs microorganisms to produce complex organic molecules in a fermenter.
It is a classic “tech disruption”. Individual molecules are now being engineered by scientists and uploaded to databases. Constant iteration is improving the process. Hence as Impossible Foods’ CEO has said: “unlike the cow, we get better at making meat every single day”. Eventually this will result in a superior product at a far lower cost than today’s cow-based meat industry.
Precision engineered proteins “will be superior in every key attribute – more nutritious, healthier, better tasting, and more convenient, with almost unimaginable variety”. Every aspect can be optimised, in a way impossible with animal-based meat, to yield better taste, more nutrients, higher purity, yet less salt, fat and no need for antibiotics. You could even, in principle, replicate meat proteins from extinct animals, if you want to eat mammoth or giant moa burgers.
The cost of producing PF molecules is deflating: from $1M/kg in 2000 to $100/kg today, on course to hit $10/kg in 2025. The descent matches genome sequencing, which now takes a few days and costs c$1,000, compared with 13-years and $1bn in 2000; and it matches computing, which now costs $60 per teraflop, down from $50M per teraflop in 2000.
The cost of producing meat. Today, animal beef costs c$4.5/kg. PF beef costs $7/kg. RethinkX expects cost parity in 2021, $2/kg pricing in 2024 and $1/kg pricing in 2030. The same trend holds for milk, where just 3.3% of the content is protein, the rest water and sugar. PF production times are also likely to be 100x faster than rearing animals.
More recent context. The number of new US food products with added protein doubled from 2013 to 2017. Protein-enriched milk is becoming popular with baristas as it’s easier to froth. Halo Top was the most popular new consumer product in 2017, an ice cream with 2x more protein than normal. Soylent’s breakfast-replacement costs $3.25 and has the equivalent of a grande latte’s caffeine, three eggs’ protein, 6 Oz tuna’s omega-3s and all 26 essential nutrients. $17bn has been invested in plant-based foods in 2013-18. Disrupting agriculture is already on the ascent.
The consequences. It is argued that “product after product that we extract from the cow will be replaced by superior, cheaper, modern alternatives, triggering a death spiral of increasing prices [for the cattle farming industry], decreasing demand, and reversing economies of scale”. RethinkX’s report explores potential savings of $100bn for families across the USA by 2030; and potential downside for the $1.25 trn per annum US livestock industry. We recommend the report. It is linked here.
Thunder Said Energy Re-Thinks Food and Agriculture Energy
PF energy economics are transformative. The rumen of cow is a 40-50 gallon reactor, with c4% feedstock efficiency, responsible for 70-120kg pa of methane emissions per year, which is in turn, a 23-36x more potent greenhouse gas than CO2. However, an industrial fermenter is a 50-10 thousand gallon reactor, with 40-80% feedstock efficiency and no methane emissions.
Implication 1. 400MTpa of Direct Decarbonisation. The US currently contains 93M cattle, which in turn account for 530MTpa of CO2-equivalent emissions, or c8% of total US greenhouse emissions. RethinkX sees cow numbers reducing 50% by 2030, as the US needs 70% fewer cow products (90% less dairy, 70% less ground beef, 30% less steak); rising to 80-90% by 2035. By 2035, the data imply 400MTpa of CO2-equivalents could be saved, which is equivalent to offsetting c2Mboed of oil consumption.
Implication 2. Incremental Gas Demand of 2bcfd? Although fermentation reactors are c10-20x more thermally efficient than cows, they will still require incremental energy. We believe natural gas is emerging as best placed to provide heating and electric energy for industrial processes. Modern foods in the US could require c2bcfed of incremental gas consumption, 2.5% upside on current US demand, and stoking our expectations for the long-run rise of gas.
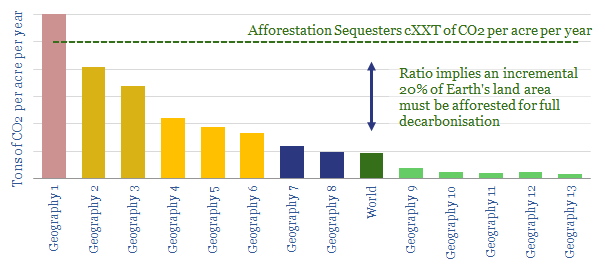
Implication 3. Decarbonising US Oil? We recently analysed seven major themes, which could eliminate 45Mbpd of global oil demand by 2050 (note here). But even on this aggressive scenario, we foresee US oil demand at 16Mbpd in 2035 and 11Mbpd in 2050. How can we decarbonise this oil? One solution is provided by re-purposing the 835M of land acres currently associated with US livestock farming: 655M for grazing, and 180M to grow crops. 60% will be freed for other uses by 2035, equivalent to 485M acres, or the entire Louisiana Purchase of 1803. If all of this land could be repurposed to grow forests, at a yield of c5.4T CO2 sequestation per acre, then we estimate enough CO2 could be absorbed to decarbonise 14Mbpd of oil demand. It is unlikely that all of this land can be repurposed in practice, but CO2 offsets could nevertheless be very large.
Implication 4. 5Mbpd of incremental biofuels. Another possibility is that some of the liberated land could be diverted into producing biofuels: Let us assume 250M acres can be devoted to growing corn, at a yield of c120 bushels per acre, and 2.8 gallons of ethanol per bushel. Multiply through and the total ethanol production would be 80 bn gallons per annum, equivalent to c5Mbpd of oil: 5x larger than current US biofuels production. Here is a positive opportunity for the energy industry, including the companies with the leading biofuels technologies.
Implication 5. Venture Opportunies? Finally, we have noted leading Energy Majors’ diversification into new energy technologies in their recent venture investments (chart below). Natural partnerships may emerge in PF companies. Indeed, we already saw BP deploy $30M investing in Calysta in June-2019, an alternative protein producer, for the aquaculture industry. Companies in the space are numerous: Beyond Meat went public in 1Q19. Impossible Foods is private, but valued at $2bn, having sold 13M units since 2016, and Burger King is introducing an Impossible Whopper in 2019, initially costing $1 more than the conventional Whopper. In March 2019, Geltor announced HumaColl21, the first human collagen created for cosmetics. We will tabulate other companies in a future screen.
Tubb, C. & Seba, T. (2019). Rethinking Food and Agriculture 2020-2030. RethinkX Sector Disruption Report. Full report linked here.
[/restrict]
We would be delighted to introduce clients of Thunder Said Energy to the reports’ authors, Catherine Tubb and Tony Seba. Please contact us if this is useful.
Cookies?
This website uses necessary cookies. Our cookies are simply to improve your experience. We do not undertake any advertising or targeting via our cookies. By clicking 'accept' or continuing to use the website, you consent to our use of cookies.AcceptRead More
Privacy & Cookies Policy
Privacy Overview
This website uses cookies to improve your experience while you navigate through the website. Out of these, the cookies that are categorized as necessary are stored on your browser as they are essential for the working of basic functionalities of the website. We also use third-party cookies that help us analyze and understand how you use this website. These cookies will be stored in your browser only with your consent. You also have the option to opt-out of these cookies. But opting out of some of these cookies may affect your browsing experience.
Necessary cookies are absolutely essential for the website to function properly. This category only includes cookies that ensures basic functionalities and security features of the website. These cookies do not store any personal information.
Any cookies that may not be particularly necessary for the website to function and is used specifically to collect user personal data via analytics, ads, other embedded contents are termed as non-necessary cookies. It is mandatory to procure user consent prior to running these cookies on your website.