Political shifts: do energy shortages cause revolutions?

from energy shortages to revolutions

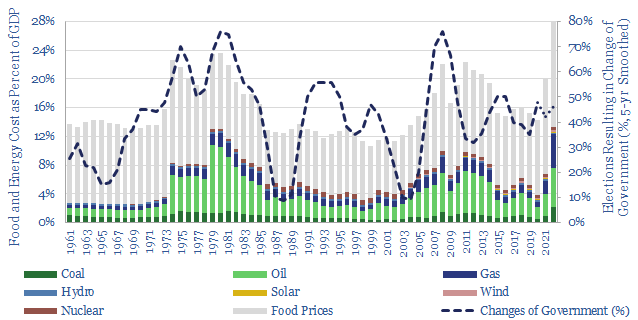
We tabulated data from 138 elections over 60 years in 7 countries. When food and energy prices spike, there is a 75% chance of government change. Revolutions can sometimes be triggered by food-energy shortages too. Hence this 14-page note evaluates whether major policy changes are coming?


Energy shortages and inflation have been recurring topics in our research over the past 18-months. Their causes, consequences and underlying ideologies are spelled out on pages 2-4. We fear that deeply held ideologies may soon be uprooted by political shifts.

Do rising food and energy prices cause revolutions? We looked back at a dozen examples on pages 5-7. Outright revolutions can be triggered by food and energy shortages, per the French Revolution in 1789, or the Arab Spring in 2011. But some revolutions had no antecedent food-energy shortages (Iran 1979, Cuba 1957, Ethiopia 1974). And many past shortages did not produce revolutions. So the causality is loose.

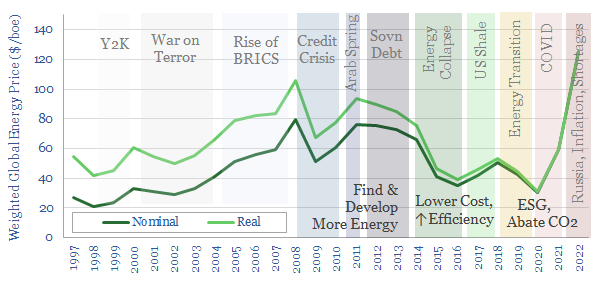
However democratic changes of government are 60% correlated with food and energy prices (chart above). Economic shocks yield a >70% chance of regime change at the next election. And the government that later oversees a stabilization tends to remain in power for a decade. This is the history from 138 general elections reviewed on pages 8-11.

What does it mean for upcoming energy and ESG policies? On pages 12-14, we present our conclusions. We suggest the ‘least bad’ path for today’s policy-makers to avoid crushing electoral defeats in 2024-25. This could yield enormous and surprising policy shifts in 2022-24. Otherwise, we fear the rise of populist governments, which may walk back today’s policies: prioritizing living costs, overlooking moral and environmental costs?

Further research. Our outlook on how deepening energy shortages could affect low-income countries is linked here. Our global energy supply-demand balance is linked here.

Solar contacts: silver bullet?

Solar contacts silver and copper

The front contacts in today’s solar cells are made of screen-printed silver. Thus solar cells absorbed 11% of 2021’s silver market, and growing. Solar silver contacts can be substituted with copper. But manufacturing is more complex and c5x more costly. So we expect a silver spike, then a switch. This 16-page note explains our outlook, and who benefits?


Silver demand in the solar industry is currently running at 3.6kTpa, or 11% of the total global silver market, and growing. The use of silver in the front contacts of solar cells is explained on pages 2-4. We envisage that silver is going to become a bottleneck.

Silver’s advantages are that it is the most conductive metal in the world, it is unreactive, and it is easy to screen print. These advantages are explained on pages 5-8, including an overview of the screen printing process for manufacturing front contacts, and a quantification of the costs (in $/kW).

Copper is 100x cheaper and 1,000x more abundant than silver. However, there are two key challenges for replacing silver with copper in the front contacts of solar cells. It diffuses into the silicon, where it is an “efficiency killer”. And it cannot readily be screen-printed. These issues are spelled out on pages 8-9.

But copper contacts can be manufactured. It is simply a more complex and costly process. Examples of different processes, and their approximate costs, are outlined on pages 10-11.

In particular, we focus in upon SunDrive, a private company based in Australia, which made headlines in 2021, and we have reviewed its patents (pages 12-13).

Our outlook on silver and copper solar contacts is therefore that silver prices will spike, then this will ultimately motivate the industry to dampen the inflationary impacts, by switching out silver for copper. This view, and our best guesses on timings, are presented on pages 14-15.

Finally, the note ends with a review of leading silver mining companies, which will clearly be impacted by the solar industry’s whipsawing silver demand (page 16).

To read about our outlook on PV silicon costs, please see our article here.

Energy transition: wheel of time?

Energy transition mega-trends

This 15-page note reflects on the last 15-years of energy, the world and our own experiences. Energy transition mega-trends do not move in straight lines. The world has often changed direction, getting waylaid by unexpected crises. Thus we wonder if energy transition goals, policies, and solutions may shift?


This note is based on anecdotal experiences, looking back at events remembered across 15-years covering the energy industry, and beyond. If you had lived through these experiences (and honestly, some of these over-extrapolations), how would this re-shape your view of the world’s transition towards net zero?

The world’s transition to net zero is described on pages 2-3, and we think this has become something of a consensus view, meant to play out following “straight line” extrapolations, which have note served us well in our analytical career.

Our experiences of world events are re-capped on pages 4-6, noting frequent ‘shocks’ and ‘crises’, changing the direction of big trends in human history, often unpredictably.

Our experiences in energy markets are re-capped on pages 7-11. The main focus transformed from ‘finding and developing more energy’ (2011-14) to ‘cutting costs and raising efficiency’ (2015-18) to ‘ESG and decarbonization’ (2019-22).

Five conclusions are drawn from these anecdotes on pages 12-14. Doom-mongering has tended to be wrong. The real crises have been the ones that no-one predicted. Straight-line extrapolations have been painfully wrong. Mega-trends exist, but their progress waxes and wanes over time.

Conclusions. We wonder whether the energy transition mega-trends could see a few years of waning progress in the mid-2020s, despite its long-run importance. Low-cost, pragmatic and resilient solutions may fare best in this timeframe.

To learn more about our thoughts and insights on energy transition and how we evaluate some of the short- and medium-term options to alleviate energy shortages, please see our article here.

Savanna carbon: great plains?

Savanna Carbon

Savanna carbon is stored in an open mix of trees, brush and grasses. Savannas comprise up to 20% of the world’s land, 30% of its annual CO2 fixation, and we estimate their active management could abate 1GTpa of CO2 at low cost. This 17-page research note was inspired by exploring some wild savannas and thus draws on photos, observation, anecdotes, technical papers.


Savannas landscapes are summarized on pages 2-4, following some on-the-ground exploration of these landscapes near Kruger National Park in 2022, which made us take a deeper interest in savanna carbon.

As a result, we are re-thinking three conclusions about nature and climate, as part of our roadmap to net zero:

(1) Conservation is as important as reforestation and should not be dismissed. Once slow-growing trees and endangered species are lost, they are not coming back (pages 5-7).

(2) Optimization of CO2 is particularly nuanced in savanna landscapes and must be balanced with other environment goals, especially biodiversity (pages 8-11). This is especially true for fire suppression (pages 12-14). Learning curves are crucial (pages 11, 15).

(3) Re-wilding pasturelands into savannas may absorb 50–100 tons of CO2 per acre. This is less than forests. But it may be more achievable in certain climates. And where it attracts tourist revenues, CO2 abatement costs may actually be sub-zero (pages 14-16).

Our conclusions and CO2 quantifications of savanna carbon are summarized on page 17.

Underlying data into the CO2 absorption of tree species and savanna landscapes is tabulated here. As an approximate breakdown, 33% of the CO2 is stored in soils, 33% in living woody tissue, and the remainder is distributed across roots, dead wood, shrubs and litter.

Levelized cost: ten things I hate about you?

Challenges for levelized cost analysis

‘Levelized cost’ can be a useful concept. But it can also be mis-used, as though one ‘energy source to rule them all’ was on the cusp of pushing out all the other energy sources. Cost depends on context. Every power source usually ranges from 5-15c/kWh. A resilient, low-carbon grid is diversified. And there is hidden value in materials, power quality and electronics. Our 15-page note explores nuances and challenges for levelized cost analysis.


Finding value in the nuance is increasingly important to us, after 3.5 years focused on the energy transition. This note looks back through our various electricity market models, and wonders whether ‘levelized cost’ analysis might be overlooking some nuances? (page 2).

Vast variations are visible in our databases of capex, prevailing conditions (windiness, sunniness, wetness, geothermal gradients, fuel prices) and hurdle rates (pages 3-5).

The asset base. No doubt, a Volkswagen Golf costs about 75% less than a Tesla Model S. This does not mean that money has been ‘saved’ if you dismantle the Tesla Model S in your drive-way, and then go out and purchase a Golf. Nor is money saved if you decide you need to own a Tesla Model S and a Golf, rather than just one of the two. Building new and excess capacity can cost 2x more than simply running existing capacity (pages 6-7).

In one of the best jokes in quantum mechanics, an angry scientist protests “that’s not fair, you changed the outcome by measuring it”. It is not dissimilar with a new technology that appears to be at the bottom of the cost curve. Scale it up too quickly, too extensively, and you can change the costs of deployment by deploying it, including through materials shortages, and ever higher transmission costs (page 8).

Apples-to-apples. A good comparison should compare apples to apples, which in electricity markets, includes reliability, flexibility, inertia, reactive power, and other power quality components. Our view is that these values, or the costs of backstopping them, should be considered in an apples-to-apples calculation of levelized cost (page 9-13).

Value in nuance. The purpose of this report is not to troll other commentators, by raising challenges for levelized cost analysis. It is that there is value in the overlooked nuance (often, precisely because it is overlooked). We think this creates excess return opportunities in neglected energy sources, materials, transmission infrastructure and power electronics.

TOPCon: maverick?

TOPCon solar cells

A new solar cell is vying to re-shape the PV industry, with 2-5% efficiency gains and c25-35% lower silicon use than today’s PERC cells. This 12-page note reviews TOPCon solar cells, which will take some sting out of solar re-inflation, tighten silver bottlenecks and may further entrench China’s solar giants.


This report starts with our best attempt to condense everything you need to know about the science of solar cells, PV-junctions, and solar efficiency losses into a ‘single page’ on page 2.

PERCs are the incumbents, comprising 80-90% of all solar produced in 2020-21. PERC stands for Passivated Emitter Rear Contact. Page 3 explains what this means and where the remaining bottlenecks are on this design.

TOPCon cells are now taking off, yielding new ‘world records’ on solar cell efficiencies, seemingly every month, in 2022. We have aggregated some of these announcements, commercial deployments and scale-up announcements, from companies such as Longi, Trina, Jinko, Jolywood on page 4. We explain TOPCons on page 5, including the innovations that enable these world-record efficiency levels.

What does it mean for future solar efficiency and why does this matter for ultimate solar costs? Our views on solar cost inflation, materials usage and ultimate price trajectories are spelled out on pages 6-9.

What bottlenecks? TOPCons will most likely use at least 50% more silver per solar cell than PERCs. Thus the bottleneck in PV silicon will be softened, but the bottleneck in silver may be heightened. Who benefits? (page 10).

China’s dominance of the PV solar industry is also likely to be entrenched in the short-term by the rise of TOPCon cells. Although we see a door opening for re-shoring in the longer term. Our overview of energy transition re-shoring is linked here.

Which companies? We think greater deployment of TOPCon cells will be an industry-wide trend, possibly even a stampede. However, leaders so far are profiled on pages 11-12, including a Western private pure-play that may help to accelerate future efficiency gains.

FACTS of life: upside for STATCOMs & SVCs?

Upside for STATCOMs

Wind and solar have so far leaned upon conventional power grids. But larger deployments will increasingly need to produce their own reactive power; controllably, dynamically. Demand for STATCOMs & SVCs may thus rise 30x, to over $25-50bn pa. This 20-page note outlines upside for STATCOMs and who benefits?


This 20-page research note is about controlling reactive power in increasingly renewable-heavy grids. We believe this theme is going to become increasingly important, but it has been overlooked, for two reasons, laid out on pages 2-3.

What is reactive power? After reviewing hundreds of technical papers and patents, our ‘best explanation’ is set out on pages 4-7, to explain concepts such as real power, reactive power, power factor, power triangles, phase angle and VARs.

Lean on me. Wind and solar assets inherently produce no reactive power and may even have consumed it. This was fine in the early days, as renewables assets could rely on the large and controllable output of reactive power from spinning generators. But regulations are tightening. And if renewables are to dominate future grids, replacing spinning generators, then they will increasingly need to produce their own reactive power (page 8).

FACTS = Flexible AC Transmission Systems. We review different options for renewables to control reactive power on pages 9-14. The discussion covers switched capacitor banks, synchronous condensers, upsized inverters, Static VAR Compensators (SVCs) and Static Synchronous Compensators (STATCOMs). In each case, we review the costs ($/kVAR), advantages and challenges for each technology. We think STATCOMs are taking the lead to back up large wind projects.

Market sizing for STATCOMs and SVCs market suggests that a 30x ramp-up is not mathematically inconceivable. If wind capacity additions ramp from 100 GW pa to 300-500 GW pa, and we install 0.5 MVAR/MW of STATCOMs/SVCs at an average of $160/kVAR, then this would become a $25-50bn pa market. Huge numbers. Worked examples and quotes from technical papers are also given (page 15-16).

Who benefits? Leading companies in STATCOMs and SVCs are profiled on pages 17-20, after reviewing 2,500 patents. The market is incredibly concentrated, with two leading large-caps, and a handful of smaller and interesting semi-pure plays. Our screen is linked here.

To read more about the upside for STATCOMs & SVCs, please see our article here.

Capacitor banks: raising power factors?

Wind and solar power factor corrections

Wind and solar power factor corrections could save 0.5% of global electricity, with $20/ton CO2 abatement costs at typical facilities in normal times, and 30% pure IRRs during energy shortages. They will also be needed to integrate more new energies into power grids. This 17-page note outlines the opportunity in capacitor banks, their economics and leading companies.


Reactive power is needed to create magnetic fields within ‘inductive loads’ like motors, electric heat, IT hardware and LEDs. But it is wasteful. 0.8-0.9 x power factors mean that 10-20% of the flowing current is not doing any useful work; it is simply amplifying I2R resistive losses; and if it is not compensated, then voltage drops can de-stabilize the grid.

All of these statements might seem a little bit confusing. Hence, after reading hundreds of pages into this topic, our ‘best explanation’ of the physics, the problem and the solution are set out on pages 2-6 of the report. We would also recommend the excellent online videos from the Engineering Mindset.

Power factor correction technologies are seen accelerating for three reasons. Saving electricity is increasingly economic amidst energy shortages (pages 7-8).

Second, they will enable greater electrification for around 30% less capex (pages 9-11).

Third, the rise of renewables will see large rotating turbines (especially coal) replaced with distributed generators that inherently offer no reactive power (wind and solar). This is not a “problem”. It simply requires conscious power factor correction (pages 12-14).

What challenges? Capacitor banks are likely to be the lowest cost solution for power factor correction, but they are also competing with other technologies, as reviewed on page 15. For ultra-high quality grid-scale wind and solar power-factor corrections, we think there is greater upside in STATCOMs (note here).

What opportunities? Leading companies are profiled on pages 16-17, based on reviewing patents, and include the usual suspects in power-electronic capital goods.

Biofuels: the best of times, the worst of times?

Outlook for biofuels in energy transition

Our outlook for biofuels in energy transition investigates how food and energy shortages will re-shape liquid biofuels? This 11-page note explores four questions. Could the US re-consider its ethanol blending to help world food security? Could rising cash costs of bio-diesel inflate global diesel prices to $6-8/gal? Will renewable diesel expansion ambitions be dialed back? What outlook for each liquid biofuel in the energy transition?


In principle, price spikes for conventional energy should be ‘the best of times’ for diversified energy sources, such as liquid biofuels. But in practice, there is also a possibility of food shortages in 2022-23. Biofuels are made from agricultural products that are usually in some way fungible with food supplies. And thus could this turn into ‘the worst of times’ for corn ethanol, bio-diesel and renewable diesel? The outcome depends on the numbers, which are explored in this report.

Our outlook for US corn ethanol is laid out on pages 4-5, including typical costs, CO2 intensity, feedstock inflation and possible impacts on the gasoline market. We wonder whether world events, especially 2022-3 food shortages, might motivate the US to re-visit diverting 40% of its corn crop into producing a biofuel, in the name of humanitarian aid?

Our outlook for bio-diesel is laid out on pages 6-7, including typical costs, CO2 intensity, feedstock inflation, and possible impacts on the diesel market. We wonder whether 0.8Mbpd of bio-diesel is now effectively the ‘marginal supply source’ for diesel markets, and if in turn, vegetable oil shortages could push world diesel prices up to $6-8/gallon?

Our outlook for renewable diesel is laid out on pages 8-9, including typical costs, CO2 intensity and the importance of used cooking oil as a feedstock. We wonder whether it is realistic for the US to scale its renewable diesel capacity by 7x, without relying on vast imports of agricultural oils, even palm oil, and whether the expansion will be softened?

Conclusions and some speculations are given on pages 10-11. We think biofuels may have a role in the energy transition, but the best pathway is bio-diesel from used cooking oil, while abatement costs of other options are on the higher side.

To read more about our outlook for biofuels in energy transition, please see our reports here, here and here. We are most excited about opportunity in landfill gas.

East to West: re-shoring the energy transition?

re-shoring the energy transition

China is 18% of the world’s people and GDP. But it makes c50% of the world’s metals, 60% of its wind turbines, 70% of its solar panels and 80% of its lithium ion batteries. Re-shoring the energy transition will likely be a growing motivation after events of 2022. This 14-page note explores resultant opportunities.


World events in 2022 have created a new appetite for self-reliance; avoiding excessive dependence upon particular suppliers, in case that relationship should sour in the future. China’s exports are 5x Russia’s. And it dominates supply chains that matter for the energy transition. The trends and market shares are quantified on pages 2-4.

There are five challenges that must be overcome, in order to re-shore value chains from China to the West: input materials, energy costs, 2-3 re-inflation risks, dumping and general Western NIMBY-ism. We outline each challenge on pages 5-6.

Re-shoring the energy transition and its best opportunities are summarized, looking across all of our research, for metals and materials (page 7), wind (page 8), solar (page 9) and batteries (pages 10-11). In each case, where would be the most logical to site the infrastructure, and which companies are involved?

An unexpected implication of re-shoring these value chains is that their underlying energy demand would be re-shored too. Our current base case is that Western energy demand per capita has peaked and Western oil demand is in absolute decline. These markets may be re-shaped, with resultant opportunities for infrastructure investors (pages 12-14).

For an outlook on China’s coal industry and how we compare Chinese coal companies to Western companies, please see our article here.

Copyright: Thunder Said Energy, 2019-2024.