Global energy: ten themes for 2023?

Predictions for global energy in 2023

This 14-page note lays out our top ten predictions for global energy in 2023. Brace yourself for volatility, a possible recession due to energy shortages, and deepening bottlenecks on accelerating new energies? However, the biggest change for 2023 is that an energy super-cycle is now gradually coming into view.


Energy markets are uncertain. Everyone is guessing. But our own best guesses for 2023 are outlined in this note.

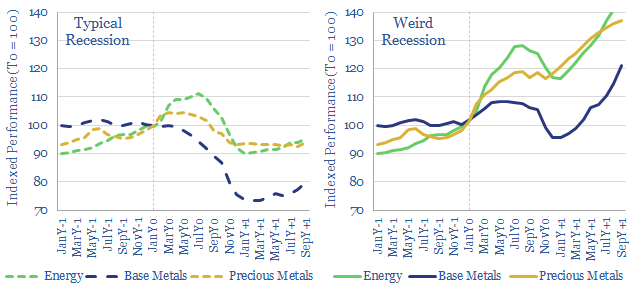
Global energy demand (forecasts on page 2) and disrupted global energy supplies (page 3) continue to be mis-matched. Thus the first law of thermodynamics creates a need to ‘destroy aggregate demand’, or in other words, there are risks of a commodity-led recession.

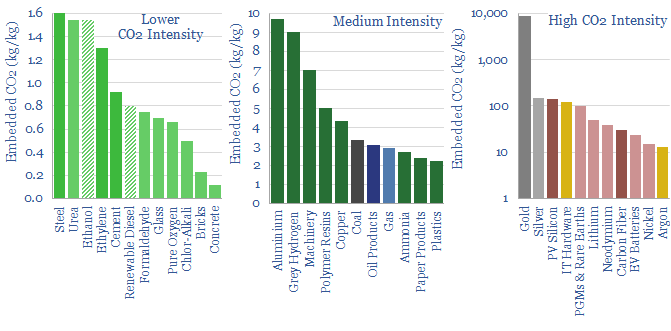
The most favored policy response will still be to ramp wind and solar ever faster (forecasts on page 4). This creates bottlenecks. In 2023, it will be crucial to distinguish between ‘soft bottlenecks’, ‘hard bottlenecks’ and ‘inverse bottlenecks’. This means some materials prices will spike, while others collapse (pages 5-8).

In conventional energy, we expect growing controversies for how to deploy record free cash flow. Especially for shale (page 9). Should it be for ever-greater shareholder returns, funding more growth to alleviate energy shortages, decarbonization, or eaten up by re-inflation in the energy services industry?

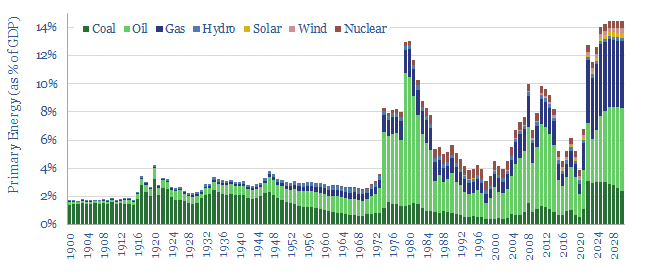
Another energy super-cycle is on the horizon (page 10), especially for low-carbon natural gas (page 11). But for investors, timing considerations are very important (page 12).

Three bright spots will stand out in 2023, and against this macro background, as summarized on pages 13-14. They include energy efficiency, nature and CCUS.

Our ten predictions for global energy in 2023 are presented in the full note. Here is to an interesting year ahead, and to the investments and innovations that yield a better-supplied and cleaner energy system, as the world progresses towards net zero.

Decarbonizing global energy: the route to net zero?

Roadmap to Net Zero

This 17-page report revisits our roadmap to ‘net zero’, after integrating over 1,000 pieces of research from 2019 through 2022. Our updated roadmap includes large upgrades for renewables and energy efficiency; less reliance on new energies breakthroughs; but most of all, simple, pragmatic progress is needed as bottlenecks and shortages loom.

This report is still available on our website for reference, but please note that it is since superseded by our 2023 roadmap to net zero.


At the end of each year, we look back upon all of our research, to update our roadmap to net zero. This is the fourth year we have undertaken this exercise. It is fascinating how the numbers have continually evolved in 2022 versus 2021 and 2020.

Our baseline is 80GTpa of possible emissions in 2050, which would be emitted in 2050 if the world’s population and energy demand scaled up from today’s CO2 baseline of 50GTpa without action (pages 2-3).

Across 1,000 pieces of research, we have mapped technologies that can decarbonize this 2050 baseline 2.5x over. That is up to 200GTpa of CO2 abatement, with costs ranging from $0/ton to $1,000/ton (cost curves and big-picture numbers on pages 4-6).

Commodity markets? The resultant balance of wind, solar, nuclear, oil, gas and coal is bridged on page 7 (in underlying units, and common-currency TWH), and the investment needed to deliver the transition is quantified on page 8 (in $bn pa by category).

What has changed? An attribution from 2020 -> 2021 -> 2022. Over time, our roadmap has relied less and less on totally novel technologies, and gravitated further towards the challenges of building real technologies, which exist today, but must simply scale up (Fig 13 on page 10 is a favorite chart!). The biggest change is that the world is now in an era of pervasive shortages, meaning slower progress, re-inflation, higher risking (pages 9-10).

Our full roadmap to net zero is summarized on pages 11-17. The goal here is not to re-write War and Peace, by copying out all of the details from 1,000 items of research. It is to draw out the crucial points and best opportunities for busy decision-makers.

Moving Heaven and Earth to ramp up renewables is covered on pages 12-13. The importance of displacing high-carbon coal with 50% lower-carbon gas is on page 14. Our ‘top ten’ opportunities in energy efficiency are summarized (with links) on page 15. A more concentrated and heavily risked outlook for CCS is on page 16. Finally, the vast potential for nature-based carbon removals is presented and bridge on page 17.

Nature based solutions: CO2 removals in 2022?

Market for nature based carbon offsets

Is the nascent market for nature based carbon offsets working? We appraised five projects in 2022, and contributed $7,700 to capture 440 tons of CO2, which is 20x our own CO2 footprint. This 11-page note presents our top five conclusions. Today’s market lacks depth and efficiency. High-quality credits are most bottlenecked. Prices will likely rise further in 2023. As a result, a new wave of exponentially better projects is emerging?


The market for nature based carbon offsets has a crucial role in the energy transition, removing up to 20GTpa of CO2 from the atmosphere, at long-term prices averaging $50/ton of CO2. The goal is to pull CO2 out of the atmosphere and store it in a natural eco-system, such as a forest. This directly offsets the impact of unavoidable emissions (e.g., 85Mbpd of oil, 300TCF pa of gas, in 2050, per our energy market models). Five advantages make this market increasingly important, as reviewed on pages 2-3.

But is the market working? Since July-2022, we have evaluated one nature based carbon removal project each month, using a five point scale. Buyers want to ensure projects are real, incremental, measurable, long-lasting and biodiverse. To illustrate each of these challenges, an example is given on page 4.

Portfolio perspectives. So far, we have appraised five nature based projects and allocated $7,700 to these projects. Our best mid-point estimate is that this will directly offset 440 tons of risked, net present CO2. There are also clear portfolio benefits. Allocating to multiple projects lowers risk and uncertainty. Some satisfying Monte Carlo analysis is presented on pages 5-6.

But today’s market for nature based carbon offsets lacks depth, as it comprises a relatively small number of projects, which were initiated between 3-25 years ago. Sourcing high-quality credits was more challenging than we expected. The average project scored 70/100 on our framework. But three of the five projects in our sample had drawbacks in their additionality, measurability, or biodiversity. And all could have had better permanence (pages 7-9).

The market is also not entirely efficient. In a mature and efficient market for nature based CO2 removal credits, we would envisage that price and quality would correlate very closely. Projects that are demonstrably real, incremental, measurable, long-lasting and biodiverse should command a premium, possibly in the range of $50-100/ton. Our review shows only a loose correlation today (page 10).

Our conclusion from 2022 is that the market for high-quality nature-based CO2 removal credits is currently bottlenecked. As a result, we expect further price inflation in 2023. But we are also aware of a new generation, of especially high-quality projects, coming to the market. The step-change feels similar to the contrast between modern renewables and the small, inefficient wind and solar plants being constructed in the mid-2000s. We offer up some predictions on page 11.

Electrification: the rings of power?

Electrification in the energy transition

Electrification is the most overlooked, most misunderstood opportunity in the energy transition. Hence this 10-page note aims to explain the upside, simply and clearly, for electrification in the energy transition. Electricity rises from 40% of total useful energy today to 60% by 2050. Within the next decade, this adds $2trn to the enterprise value of capital goods companies in power grids and power electronics.


Electrification in the energy system. In the past five-years, 38% of global useful energy has been consumed as electricity. Our forecasts for 70,000 TWH of total global electricity demand are explained on pages 2-3.

The single biggest reason for accelerating electrification is to expand renewables as much as possible, while also keep renewables as a right-sized share of the total power grid. After four years of research, our simplest, clearest explanation of this effect, along with our ‘top three charts’ are presented on pages 4-5.

What about energy storage? Can batteries and hydrogen solve the various volatility issues, and increase the percentage share of renewables. Again, summarizing four years of research, our conclusions and key numbers are summarized on page 6.

The best solution to backstop renewables is via electrification. Expand the grid. Hence renewables will not reach ‘problematic’ or ‘impassable’ shares of the total. We summarize how this will actually happen, and ‘how it works’, with examples, on pages 7-8.

Who benefits? Electrification requires expanding power grids and power electronics. The extent of this upside is truly overlooked, due to its complexity. We quantify the upside, and why it is overlooked on pages 9-10.

(There is also upside for nuclear, gas and CHPs, which will provide most of the remaining shares of an increasingly large grid).

1,100 companies have crossed our screens since starting Thunder Said Energy, including dozens in power grids and power electronic capital goods. Although four listed companies seem to come up again and again, with leading positions in some of the different market segments that excite us most (page 11).

Solar capacity: growth through 2030 and 2050?

Solar capacity growth

Forecasts for future solar capacity growth have an unsatisfyingly uncertain range, varying by 3x. Hence this 15-page note discusses the future of solar. Solar capacity additions likely accelerate 3.5x by 2030 and 5x by 2040. But this creates bottlenecks, including for seven materials; and requires >$1trn pa of additional power grid capex plus $1trn pa of power electronics capex.


There is a 3x margin of uncertainty over future solar capacity growth. This is the range of forecasts that have crossed our screen. And the IEA has revised its assessment of 2030 solar capacity growth upwards by 3x in the past 3-years. We quantify the uncertainty on pages 2-3.

Definitions are an issue. Some forecasts of solar growth are discussing panel additions in GW, others are considering full AC solar project additions in GWe, and others still are quantifying net capacity change in GWe after deducting retirements. A summary of ‘who uses which definition’ is given on pages 4-5.

Our numbers see an acceleration to a peak of 500GWe of net capacity growth in 2040. The first reason that growth ‘peaks’ is that the average solar panel in the field today is 4-years old, and eventually panels get retired (page 6), and our full numbers are spelled out on page 7.

How much solar energy will be produced in 2030, 2040 and 2050? Our numbers, in “useful TWH” terms, are discussed on page 8.

Why can’t the numbers be higher? This would clearly be helpful. We want faster solar growth in order to achieve important goals in the energy transition, and to alleviate devastating energy shortages. With some help from Nigel Tufnel, in the cult 1980s rock comedy, This is Spinal Tap, we discuss the limits on solar capacity growth on page 9.

Seven materials are going to act as bottlenecks on growth. The numbers are truly staggering. Our solar trajectory raises total global demand for these materials by 20-120%. Fig 11, on page 11, is possibly the most important chart of energy transition bottlenecks that we have produced all year.

Bottlenecks also exist downstream of the solar projects, as our numbers require a vast expansion of power grids and power electronics. We quantify the growth for both of these markets at around $1trn each, with discussion and links to further research on pages 13-15.

Fluorinated polymers: flying under the radar?

fluorinated polymers in the energy transition

Fluorinated polymers are a ‘stealth bottleneck’ for the energy transition: used in solar back-sheets, battery binders/separators, wind blades, and across the hydrogen chain. But low down the bill of materials, they are easily overlooked. This 400kTpa market grows 6x by 2050. Rising 2021 margins already suggest tightness. And the ‘CO2 curve’ is steeper than any other material. So Western companies must scale up? Our 15-page report explores the upside for fluorinated polymers in the energy transition, and who benefits.


Fluorine is the smallest and simplest halide, with an atomic number of 9 and an atomic mass of 19. C-F bonds have high enthalpy and resistance to thermal and chemical attack. Thus fluorinated polymers are among the most resilient polymers in the world (page 2).

Yet they are overlooked. When you think about the materials in solar panels, you are primarily going to think about silicon, and maybe secondarily silver. When you think about wind, you are primarily going to think about glass fiber, and maybe secondarily resins. When you think about batteries, you are primarily going to think about lithium, and then maybe secondarily graphite or nickel.

Fluorinated polymers are lower on the bill of materials. Yet they are crucial to producing solar panels (page 3), lithium ion batteries (page 4), helpful for wind turbine blade-moulding (page 5) and more broadly in electrification and hydrogen (page 6). In each case, we have estimated future market upside.

Can fluorinated polymers be substituted? We answer this question on page 7, including interesting data on the cracking of solar panel back-sheets. So how are fluorinated polymers produced?

The first stage for producing fluorinated polymers is to mine fluorspar. The key mineral in fluorspar is CaF2. Our outlook for fluorspar markets is discussed on page 8.

The next stage in producing fluorinated polymers is to produce hydrofluoric acid, by reacting acid-grade fluorspar with sulphuric acid, modeled here. Our outlook for hydrofluoric acid is discussed on pages 9-10. Hint: it is used everywhere!

The complicated part is converting methane, chlorine gas and hydrofluoric acid into useful fluorinated polymers. This is one of the most complex value chains we have evaluated in our works. Halocarbon emissions, with GWPs well over 10,000x CO2, can blow the CO2e intensity of these materials out of the water. Some FP product on the market can surpass CO2e intensity of 500 tons/ton, especially for producers that are not focused on environmental credentials (see pages 11-12).

Leading companies in fluorinated polymers, and the upstream value chain, are going to be needed to meet the call for rising future demand, and environmentally minded production processes. Our company screen includes a dozen OECD leaders, and ideas, as discussed on pages 13-15.

Energy shortage: fear in a handful of dust?

Reasons energy shortage matters

Should restoring the world’s energy surplus be seen as the most important ESG goal of the 2020s? This 12-page note outlines our top ten reasons energy shortage matters. Our energy balances have deteriorated even further in the last year. Under-supply could persist through 2030. Energy shortages have cruel consequences. And unexpected ripple effects. Energy surplus also helps energy transition.


Global energy is complex. Commentators often write long and equivocal reports, where key points can get lost. This note aims to illustrate a simple and unequivocal point. Getting back to ‘energy surplus’ should be the #1 ESG goal of the 2020s. We must avert the truly catastrophic scenario charted below.

Reasons energy shortage matters

Basic human needs require energy. Energy costs are now consuming an additional 10% of global incomes. It takes 0.09 units of modern energy to create each unit of food. And the single largest cause of environmentally damaging deforestation is a shortage of modern energy for the world’s poorest 4bn people (pages 3-6).

History shows that geopolitical tensions, changes of government and even outright wars and revolutions are all more likely during times of energy shortages. The pain and suffering caused by these events outweighs anything else in ESG (pages 7-8).

We want to achieve an energy transition. This is easier with an energy surplus. In the short term, building renewables and EVs consumes net energy (solar case study here). There are also materials bottlenecks. And CCS, batteries, biofuels, hydrogen have energy penalties (pages 9-11).

Our final consideration is that harnessing energy has been one of the greatest enablers of human progress. It truly has. One narrative for net zero is that we will unlock the best outcomes for humanity via a century of ‘energy thrifting’, and the goal is simply to take today’s energy system and decarbonize it. How depressing. A more exciting future for humanity might perhaps include new ways of using energy (page 12).

Energy transition is a crucial goal for the world. It involves meeting the future energy needs of human civilization, while decarbonizing, and protecting nature. But after reviewing the reasons energy shortage matters, we believe this goal is easier to achieve from a position of energy surplus, and may be near-impossible to achieve with persistent energy deficits. Here is hoping for more progress in 2023, including a constructive, ‘all of the above’ approach to unlock energy and infrastructure investment. This remains the focus in our energy transition research.

Reaching criticality: nuclear re-accelerates?

Outlook for nuclear in the energy transition

400 GW of nuclear reactors produce 2,800TWH of zero carbon electricity globally each year. But the numbers have been stagnant for two decades. This is now changing. This 14-page note explains our outlook for nuclear in the energy transition. We expect a >3% CAGR through 2030, and hope for a 2.5x ramp through 2050. A ‘nuclear renaissance’ helps the energy transition.


The world generated 2,800 TWH of nuclear electricity in 2021, across 444 operable reactors with 400 GW of total capacity, spread across 33 countries. This is 10% of all global electricity. It is 4% of all useful global energy consumption. However, capacity has been stagnant for 20-years, as the OECD has closed 5 GW pa of reactors (pages 2-3).

History suggests that energy crises underpinned the first large wave of nuclear construction, where new capacity additions peaked in the half-decade from 1984-89. The evidence suggests energy crises in the 2020s will re-awaken this sense of pragmatism (pages 4-6).

Near-term upside, including slower shutdowns, faster construction schedules and the re-start of idled nuclear capacity (especially Japan) are explored on pages 6-7.

There is longer-term upside for nuclear in the energy transition. A good target is to ramp nuclear from 4% to at least 6% of the world’s total useful energy, which in turn requires a 2.5x capacity expansion. The size of the capex cycle is compounded by needing to replace old plants reaching end of life. Spending may ramp by 4x to as much as $150bn pa (pages 8-9).

A renaissance in new nuclear technology will help to meet the call. Out of hundreds of technologies we have reviewed in the energy transition, we have found new nuclear concepts to be some of the least hyped yet “most real” and most natural to de-risk. We note particularly interesting concepts and companies on pages 10-13.

What outlook for uranium? 2-3% demand growth for nuclear already leaves uranium markets deeply under-supplied by late in the 2020s. After re-accelerating our outlook for nuclear in the energy transition, updated numbers, and leading uranium miners are noted on page 14.

Weird recessions: can commodities de-couple from GDP?

Can commodities de-couple from GDP?

In a ‘weird recession’, GDP growth turns negative, yet commodity prices continue surprising to the upside. This 10-page note explores three reasons that 2022-24 may bring a ‘weird recession’. There is historical precedent, prices must remain high to attract new investment, and buyers may stockpile bottlenecked materials. So can commodities de-couple from GDP and how will this affect different industries?


This 10-page note condenses all of our research from 2021-22, into an updated ‘macro thesis’. We wonder whether 2022-24 could bring a ‘weird recession’, where traditionally cyclical commodities and industrials proved unexpectedly resilient.

The conventional wisdom is that commodities get crushed in a recession, declining by at least 30%. We re-cap this conventional wisdom on page 2, using data from historical recessions. However, could 2022-24 defy conventional wisdom?

(1) What is the right analogue? It is tempting to take 2007-09 as a case study for commodity price performance during recessions. It was recent. But we explore other analogues and case studies, which may be more appropriate on pages 3-4, focusing in particular upon the 1973-75 oil shock.

(2) Supply-side paradox? A major reason to fear recession in 2022-24 is persistently high commodity prices. New investment is ultimately needed to normalize commodity prices in the late 2020s. But a commodity crash would disrupt that investment. This argument is quantified on pages 5-7.

(3) Stockpiling? The average material needed in the energy transition sees its demand quintuple between now and 2050. Buyers are already worried about shortages for many key materials. Hence we speculate that buyers may enter bottlenecked markets and counteract price weakness (see pages 8-10).

The note ends with a list of materials that we think may offer the most resiliency in the ‘weird recession’ scenario described in this note. Can commodities de-couple from GDP? We think so. We are happy to discuss the work in more detail with TSE clients.

Silver and gold: medal winners?

Overview of gold and silver production

Gold and silver are stores of value, especially in a world of persistently high inflation and low rates. Silver is also likely to be the main bottleneck for solar in the 2020s. Hence this 18-page note is an overview of gold and silver production, from mining to refining. We find very steep energy/CO2 curves, and fear supply shortages. What upside for well-run gold-silver incumbents?


Gold and silver are well-known stores of value, going back over 11,000 years. They may protect value in a world of persistently high inflation. While we also see silver becoming the key bottleneck for solar growth in the 2020s. Key numbers, and the reasons for exploring this topic are explained on pages 2-4.

How do you make silver and gold? This turns out to be one of the most complex supply-chains we have ever modelled, on a par with carbon fiber. In this note, we have broken down a typical mining-refining operation, into ten discrete steps. Each one is summarized, and then modeled individually on pages 5-15.

Different steps include mining, crushing, flotation, roasting, leaching, Merrill-Crowe, dore casting, Miller chlorination, the Wohlwill process and the Moebius process. Specifically, this overview of gold and silver production has estimated the capex costs, opex costs, energy consumption and CO2 emissions along each step of the chain. And then we can simply add all the steps together.

One conclusion is that silver and gold are two of the most energy intensive and CO2 intensive materials we have evaluated in our research to-date (chart below).

Overview of gold and silver production

The reason this matters is that complex and energy intensive processes are more likely to get disrupted, in the strange, under-supplied world of 2022-2030. The key pinch points are identified on pages 16-17. This re-affirms our fears for a silver supply shortage, and a solar bottleneck.

Well-run incumbents may enjoy pricing power, and may be able to avoid bottlenecks. Leading integrated producers of silver and gold are charted and summarized on page 18.

Copyright: Thunder Said Energy, 2019-2024.