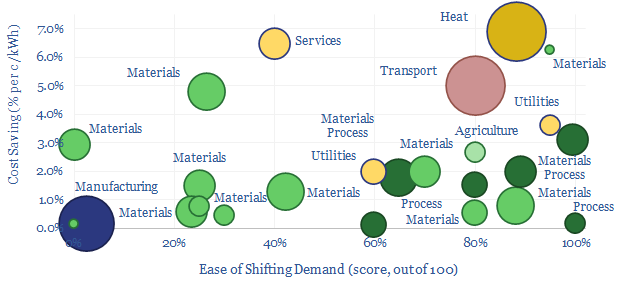
Some industries can absorb low-cost electricity when renewables are over-generating and avoid high-cost electricity when they are under-generating. The net result can lower electricity costs by 2-3c/kWh and uplift ROCEs by 5-15% in increasingly renewables-heavy grids. This 14-page note ranges over 10,000 demand shifting opportunities, to identify who can benefit most.
Newlight AirCarbon: bioplastics breakthrough?
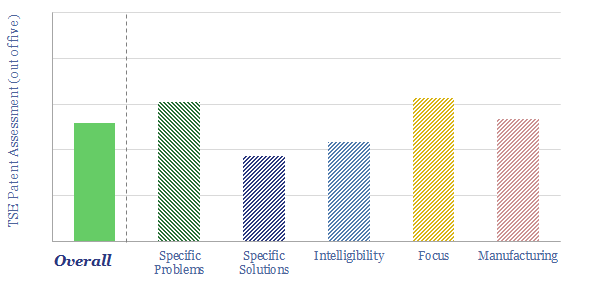
Newlight is a private company, founded in 2003, based in California, aiming to convert (bio-)methane and air into polyhydroxybutyrate (PHB), a type of polyhydroxyalkanoate (PHA), a biodegradable bio-plastic which is marketed as AirCarbon. The product is said to be carbon negative, biodegradable, strong, “never soggy”, dishwasher safe. Our AirCarbon technology review found some good underlying innovations, but was unable to de-risk cost and capex aspirations.
Global plastic demand likely rises from 470MTpa in 2022 to almost 800MTpa by 2050 (model here). Biodegradable bioplastics are a particularly fast-growing segment of the market (overview here).
Hence this data-file presents our conclusions from reviewing patents filed by Newlight, a private company that is commercializing AirCarbon, a biodegradable bioplastic, polyhydroxybutyrate, which is a type of polyhydroxyalkanoate.
What is PHB? Polyhydroxybutyrate is a type of bioplastic produced by micro-organisms (especially methane-consuming bacteria), in response to physiological stress, as a form of energy storage when nutrients are scarce.
Newlight is already delivering AirCarbon to brands such as Nike, Target, Shake Shack, US Foods, H&M, Ben & Jerrys, and hotel chains, from its Eagle 3 demonstration plant, which produced 60M “units” in 2022 (although this might imply relatively small volumes, of around 300Tpa, if we assume a mix of 0.5 gram straws and 10 gram cutlery items?).
Newlight’s goal through 2025+ is to scale up production into the 10s and 100s of kTpa, and displace synthetic plastics, especially in the $140bn pa foodware market, $30bn pa fashion products market, $64bn pa diaper/personal care market and automotive industries.
Does Newlight have a breakthrough technology for PHB production? Producing PHB from methane is complex with over 10 different processing stages. The patents focus particularly upon one stage, which may be a rate limiting stage, enhancing the production of one out of two possible variants of an enzyme. Details, numbers and yields have been gleaned from reviewing Newlight’s patents and are noted in the data-file.
Is PHB carbon negative? Reading between the lines of its patents, we think methane is most likely to be sourced from landfill gas. And the process screens as carbon negative relative to a baseline alternative where the landfill gas or methane was simply vented to the atmosphere. In our view, this is not strictly ‘carbon negative’, but may be ‘Scope 4 negative‘.
What does PHB cost? Attempts to commercialize PHB bioplastics go back to ICI in the 1980s, but have struggled to compete economically. PHAs on the market today tend to have a cost of $2.5 – 6/kg, versus synthetic plastics closer to $1-1.5/kg.
What are the capex costs of producing bioplastics? We would typically assume $1,300/Tpa for an ethane cracker, $1,500/Tpa for an integrated crude to chemicals plant, but think bioplastics plant capex will be in the range of $10,000-50,000/Tpa.
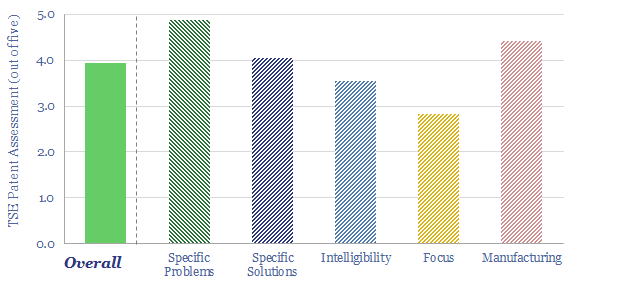
Can we de-risk a breakthrough in our AirCarbon technology review? The purpose of our patent reviews is to use an apples-to-apples framework, to assess whether we can de-risk technologies in our roadmap to net zero. We were not entirely able to de-risk a widespread breakthrough in our AirCarbon technology review, for reasons noted in the data-file.
Acetylene: production costs?
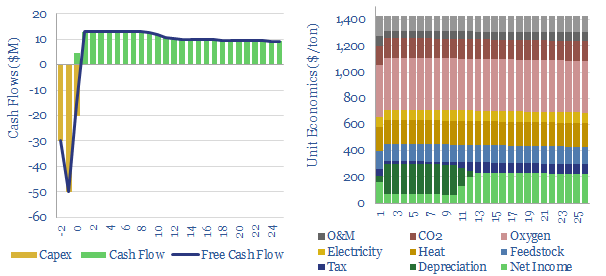
Acetylene production costs are broken down in this data-file, estimated at $1,425/ton for a 10% IRR on a petrochemical facility that partially oxidizes the methane molecule. CO2 intensity is over 3 kg/kg. Up to 12MTpa of acetylene is produced globally for welding and in petrochemicals.
Acetylene is a gas with the composition C2H4 (H-C≡C-H), formed via three main production pathways, used mostly as a petrochemical feedstock, but also in welding and metal-working. The gas was discovered by Edmund Davy in 1836. However, Walter Reppe (1892-1969) of BASF is considered the founder of modern acetylene chemistry, creating a safe process to handle acetylene at 25 bar pressures..
Market sizing data on the global acetylene market is highly variable, with different commentators reaching starkly different numbers. One reason is that many integrated petrochemical facilities produce their own acetylene on site, and only a small share of production is sold onwards. Upper estimates that have crossed our screen imply around 12MTpa of acetylene production in 2022.
Acetylene use in the petrochemical industry consumes around 70-80% of global market volumes. It is an important gas because the C≡C triple bond can easily be vinylated to produce H-X compounds. This pathway yields vinyl acetate, acrylonitrile, acetaldehyde and butane-1,4-diol for polyurethanes such as ‘spandex’. BASF discloses that up to 20 processes at Ludwigshafen use acetylene as an input.
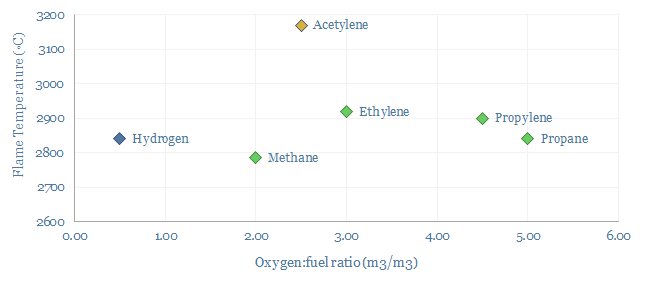
Acetylene use in the welding and metal-working industry consume around 20-30% of global market volumes. This is because of acetylene’s combustion properties, forming a very high flame temperature around 3,000◦C, high enthalpy of combustion of 50 MJ/kg, a fast flame speed of 10-12 m/s versus 2-6 m/s for other gases and a low moisture content in the exhaust gas. Oxy-acetylene flames cut quickly, saving cost. And ferrous metals are often flame hardened, to improve their longevity, which requires a hot and low moisture flame. Although we wonder whether electric arc welding will increasingly displace acetylene.
Production of acetylene occurs via three main pathways. We think the dominant process in the West is partial oxidation of methane, at very hot temperatures, around 2,000-3,000◦C. Another method purifies acetylene by-products from ethane cracking. A third pathway uses a reaction between calcium carbide and water to form C2H2 and calcium hydroxide.
Acetylene production costs are estimated at $1,425/ton in this data-file, in order to earn a 10% IRR on a large production facility, and after reflecting capex costs, feedstock gas prices, heat, electricity, cryogenic oxygen, opex costs and CO2 prices. Production costs are most sensitive to input gas prices, and recent gas prices from 2022 can result in cash costs around $2,500/ton in Europe, almost 2x normal levels.
Energy intensity is high, as the partial oxidation reaction of methane forms large quantities of CO and water vapor. 3 CH4 + 3 O2 → C2H2 + CO + 5 H2O, in order to generate high reaction temperatures that yield acetylene. We estimate the CO2 intensity of acetylene production is over 3 tons/ton (Scope 1+2 basis), which flows through to the embedded CO2 intensity of products in downstream value chains.
Companies producing acetylene include many of the usual suspects in chemicals and industrial gases, such as BASF, Linde, Air Products, Air Liquide, Praxair, LyondellBasell, Asia Technical Gas and many Chinese producers. All of our petrochemicals research is summarized here.
Purified terephthalic acid: PTA production costs?
This data-file captures PTA production costs, breaking down the costs of producing purified terephthalic acid (PTA), a chemical intermediate that gets polymerized with ethylene glycol, in order to make PET, for packaging materials (bottles, clam-shells) and for fibers (polyester, the most commonly used textile fiber on Earth).
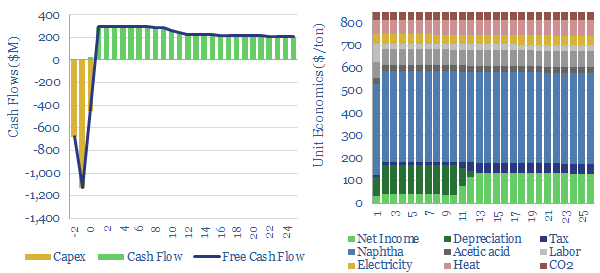
A PTA price of $800-850/ton is needed to earn a 10% IRR across an integrated petrochemical facility, which first catalytically reforms naphtha into BTXs, then separates out the paraxylene (PX), then oxidizes the paraxylene into crude TA, and finally purifies the PTA.
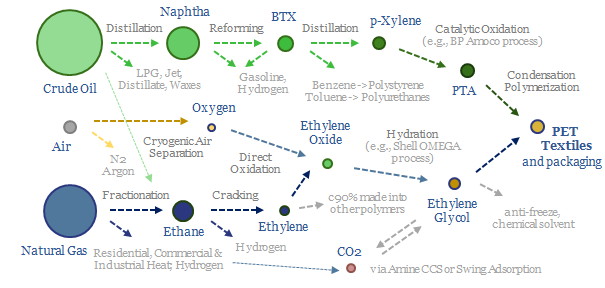
PTA is most commonly polymerized into PET, the most commonly used textile on planet Earth, also used for packaging materials, as summarized in the chart below and in our polyester note here.
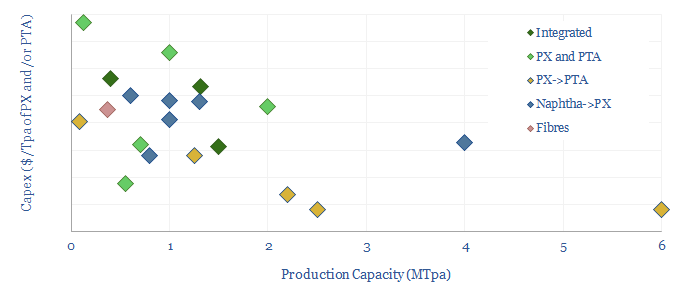
Capex costs across an integrated PTA petrochemical value chain might run to around $1,300-1,500/Tpa, including both the paraxylene line and the PTA line, and our numbers are informed by aggregating capex costs of PTA plants, capex costs of paraxylene plants and capex costs of naphtha reformers (chart below).
The CO2 intensity of PTA is estimated at 1.45 kg/kg (i.e., kg of CO2 per kg of PTA), of which 1.3 kg/kg is embedded in the paraxylene inputs, of which in turn, the largest contributor is process heat for the cracking/reforming of naphtha. Energy costs are a major contributor to PX production costs, but less significant for oxidizing PX into PTA.
How does the cost of feedstock affect PTA economics? Each $10/bbl variation in the oil price reduces the marginal cost of PTA production by around $50/ton, as a rule of thumb. Or alternatively, at constant pricing, $10/bbl lower oil inputs improve full cycle IRRs by around 3 percentage points. Sourcing low cost naphtha could therefore provide a major uplift, especially as the rise of electric vehicles displaces naphtha demand in our oil models.
To reach these numbers, this data-file contains two separate models, which are then added together. The first model captures the production costs of paraxylene, from naphtha as an input. The second model captures the production costs of PTA, from paraxylene as an input.
Notes into the PTA production process are also set out in the final tab of the model. Oxidation of PX into crude terephthalic acid (CTA) takes place at 175-225◦C and 15-30 bar of pressure (to keep PX as a liquid). Separating out the PTA uses a crystallizer, steam heating and pumps/blowers to drive off the liquid. Acetic acid is used as a solvent and small portions are consumed (not recovered).
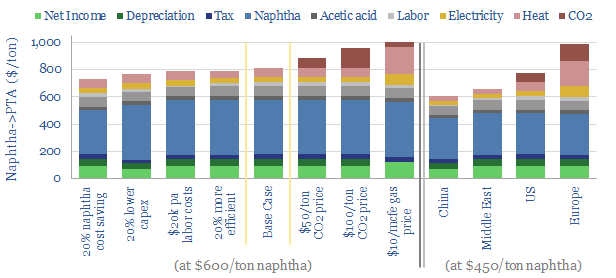
Other inputs can be stress-tested in the model, such as capex costs, O&M costs, labor rates, uptime and utilization, process efficiency, gas prices, electricity prices, CO2 prices and tax rates. Some sensitivity analysis is plotted above, showing how these variables impact costs, including in different regions. We have also written a summary aggregating all of our plastics research.
Global decarbonization: speeding up or slowing down?
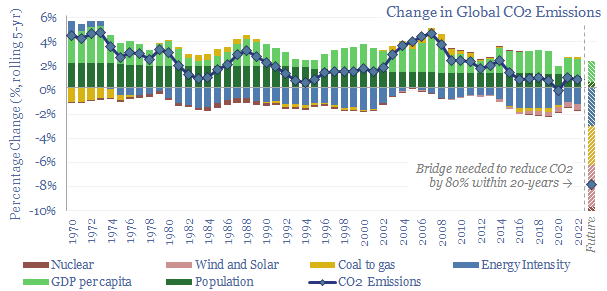
This 16-page report beaks down global CO2 emissions, across six causal factors and 28 countries and regions. Global emissions rose at +0.7% pa CAGR from 2017-2022, of which +1.0% pa is population growth, +1.4% pa rising incomes, -1.4% pa efficiency gains, -0.5% renewables, 0% nuclear, +0.2% ramping back coal due to underinvestment in gas. Depressingly, progress towards net zero slowed down in the past five years. Reaching net zero requires vast acceleration in renewables, infrastructure, nuclear, gas and nature.
AirJoule: Metal Organic Framework HVAC breakthrough?
Montana Technologies is developing AirJoule, an HVAC technology that uses metal organic frameworks, to lower the energy costs of air conditioning by 50-75%. The company is going public via SPAC and targeting first revenues in 2024. Our AirJoule technology review finds strong rationale for next-gen sorbents in cooling, good details in Montana’s patents, and challenges that decision-makers may wish to explore further.
The global HVAC market is worth $355bn per year, as air conditioning consumes 2,000 TWH per year, or 7% of all global electricity (note here).
Each one of the world’s 1.7bn vehicles also has an in-built air conditioner, and in hot/congested conditions, the AC can sap 70% of the range of an electric vehicle.
Typical air conditioners have a coefficient of performance (COP) of 2.5-3.5x, which means that each kWh of electricity inputs will deliver 2.5-3.5 kWh-th of cooling energy.
Cooling energy, in turn, is used to reject heat from air (about one-third of the total) and to reject heat from the inevitable condensation of water, as air cools down (about two-third of the total). To re-iterate: (a) cooler air can hold less water; (b) hence some water will condense as air is cooled; (c) condensation of water releases energy (called the latent heat of vaporization, and running at 41 kJ/mol, or 640 Wh/liter); and (d) this adds to the cooling load that the air conditioner needs to provide; (e) by a factor of 1-2x more than the cooling load needed to cool down the air in the first place (called the specific heat of air, or 1.0 kJ/kg-K). For more details, please see our overview of air conditioning energy demand.
Metal Organic Frameworks are a type of sorbent with a high surface area, able to adsorb water from air. To re-release that water, a vacuum pump can be used to lower the pressure (chart below). Effectively this is a swing adsorption process rather than a cryogenic process.
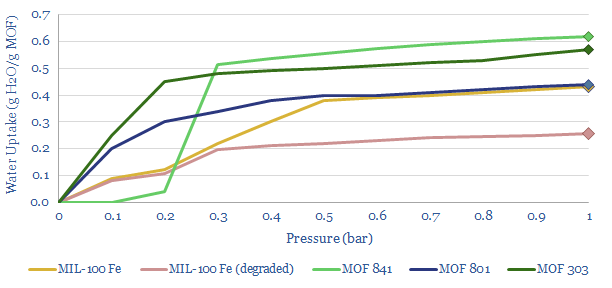
How does AirJoule technology work? This data-file pieces together details from Montana’s disclosures and patent filings. In particular, the work covers five core patents describing a Latent Energy Harvesting System, using Metal Organic Frameworks to adsorb and re-vaporize atmospheric water; test stable MOFs, and novel methods for manufacturing those MOFs.
What COP for AirJoule? After reflecting the loads of the vacuum pump, other fans and blowers, heat transfer from an adsorption chamber to a desorbtion chamber, and auxiliary loads, AirJoule is targeting a total electricity use of 60-90 Wh/liter of water. Hence if water is adsorbed, then desorbed, then misted, it will absorb 640Wh/liter as it re-vaporizes (see above). Divide 640Wh/liter by 60-90Wh/liter, and you derive a coefficient of performance of 7-10x. Or in other words, the energy consumption will be 50-75% below a typical air conditioner. More details are in the data-file.
What are the key challenges for AirJoule technology? We see five thematic challenges for using MOFs and sorbents in cooling systems, and two specific challenges based on reviewing Montana’s patents.
Overall, we think there is very strong potential for next-gen sorbents, and metal organic frameworks, across cooling and other industrial processes, as described in our recent research note here. Key conclusions into Montana’s technology are in our AirJoule technology review below.
Polyester: production process?
Polyester is the most produced textile fiber on Earth. Of the world’s 8GTpa of oil and gas production, 80MTpa, or 1%, ends up as PET, via eleven chemical processing stages that span naphtha-reforming, BTX separation into paraxylene, oxidation to PTA, plus ethane cracking, ethylene oxide and ethylene glycol. This data file covers the polyester production process, step by step, including yields and reaction conditions.
Global textile production stood at around 110MTpa in 2021, of which 60MTpa is polyester (and c50MTpa is PET), 25MTpa is cotton, 10MTpa is other polymers, 6MTpa is cellulosics (e.g., linens from flax, hemp, jute), 1-2 MTpa is wool, c1-2MTpa is leather.
Uses of polyester? Statistically, there is a c50% chance that the shirt on your back is made of hydrocarbons derived from the chemical processes described in this data-file and spun into PET fibers. But note that the uses of fibers are also broader than just clothing. Solar panels often use PET as an underlying layer of their backsheet.
Uses of PET? Global production of PET stands at 80MTpa. 50MTpa is used as textile fiber. And another 30MTpa is used as a plastic packaging material, e.g., for water bottles and clam-shell food containers. Note that our database of global plastic production only counts the 30MTpa of PET used as packaging material, while PET used in textiles are counted separately. Some classifications do not even count them as “plastics”. Because, well, they don’t look like other plastics or feel like other plastics.
The polyester production process? This data-file gives an overview of polyester production, specifically PET fiber production process, building up from first principles, covering inputs, outputs, mass balances, yields and reaction conditions.
There are eleven separate chemical processes in the value chain for producing PET, the hottest of which reaches 800ºC (ethane cracking), the coldest of which reaches -200ºC (cryogenic air separation), but the average process takes place at 200ºC.
PET is produced from the condensation polymerization of PTA and ethylene glycol at 220-260ºC and 3-6 bar pressure. The PTA is produced from the catalytic oxidation of paraxylene (e.g., using BP’s Amoco process), which in turn is derived from catalytic reforming of naphtha. The ethylene glycol is produced from hydration of ethylene oxide (e.g., using Shell’s OMEGA process), which in turn is derived from cracking ethane, which is the most common NGL during the fractionation of natural gas.
There are three sources of upside for PET in the energy transition. Most interestingly, the electrification of vehicles will lower demand for motor gasoline, tempting refiners to flow less reformate into the gasoline pool, and more reformate into BTX for chemicals, with the overall effect of lowering the input costs for PTA? Effectively, there is a pathway where the electrification of vehicles improves the margins of polyester producers?
Similarly, if gas is ramped up to displace 2-2.5x more CO2 intensive coal, this will yield more ethane as a by-product, which may flow through to lower input costs for ethane crackers, and ultimately lower the input costs of ethylene glycol.
Third, PET is one of the few polymers that is already fully recyclable, which is also an advantage for sustainability. In our broader research, we have looked at next-gen PET recyclers, such as Carbios.
Land use of global textile production? Producing 25MTpa of cotton ties up 85M acres of land globally. This matters as deforestation has driven 25-30% of all anthropogenic emissions historically (data here and here). In principle, if 85M acres of land could be reforested, it would absorb c500MTpa of CO2, or 1% of today’s global CO2 emissions.
Leading companies in polyester value chains? The world’s largest PET producers include Indorama (Indonesia), Alpek (Mexico), Yasheng, Sanfame, CRC, FENC (China) and Reliance (India). Across the input value chain, leading PTA producers also include BP, Sinopec, Reliance, SABIC, Lotte; and leading ethylene glycol producers include Shell, Dow, SABIC, BASF, Sinopec, Formosa, Reliance, et al.
Polyurethane: leading companies?
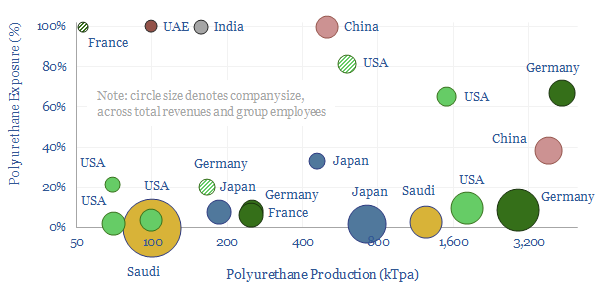
This data-file is a screen of leading companies in polyurethane production, capturing 80% of the world’s 25MTpa market, across 20 listed companies and 3 private companies. We see growing demand for polyurethanes — especially for insulation, electric vehicles and consumer products — while there is also an exciting prospect that EVs displace reformates from the gasoline pool, helping to deflate feedstock costs. So who benefits?
This screen of polyurethane producers captures about 80% of all global polyurethane production, across 23 chemicals companies, across different parts of the value chain.
Global production of polyurethane stands at around 25MTpa as of 2022, with major uses in insulation materials, elastic fibers (e.g., spandex/lycra), foamed furniture materials such as mattresses, consumer products like shoes, vehicles, electrical products and adhesives/resins. The World Cup Football famously incorporated polyurethanes from Covestro. Global plastics production, by polymer, is quantified here.
Five companies dominate the polyurethane industry and produce over half of all global polyurethanes, of which two are listed in Germany, two are listed in the US and one is listed in China. 5-7 lines of key details on each company are summarized the data-file, including product exposures, geographic exposures and CO2 intensity.
Are polyurethane producers concentrated or diversified? Concentration varies widely by company. The median company in the screen is diversified, and derives just 10% of its business from polyurethanes. Although seven companies derive over half of their revenues from polyurethanes and five are over 80% concentrated.
Are polyurethane producers integrated? Some companies in our screen simply purchase polyols and dio-isocyanate intermediates as commodity chemicals, and specialize in their polymerization, foaming, and forming into products (e.g., one company in the screen has a 30-40% market share for mattresses in geographies such as India and Australia). Others are vertically integrated all the way back to naphtha, benzene, toluene or propylene inputs.
Inorganic activity has also been prevalent in the polyurethanes business, as some companies have suffered from weak 3-7% margins and ROICs, especially in challenging geographies. Dow and DuPont famously merged and then unmerged. Thailand’s PTT has been buying up niche polyurethanes businesses. And Aramco bought Novomer’s CO2-absorbing polyols technology for up to $100M back in 2016.
The polyurethane industry is opaque and complex, hence this data-file is not going to be perfect. We have used our best guesses from public disclosures, and triangulation of reported reports, to make informed estimates, breaking down volumes for the leading companies in polyurethane. All of our plastics and polymers research is summarized here. For further details please see our outlook for polyurethane in the energy transition.
Hydrogen reformers: SMR versus ATR?
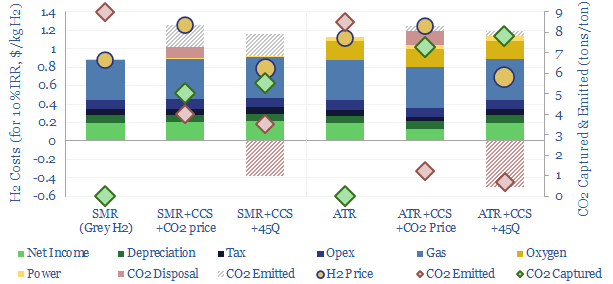
Blue hydrogen value chains are gaining momentum. Especially in the US. So this 16-page note contrasts steam-methane reforming (SMR) versus autothermal reforming (ATR). Each has merits and challenges. ATR looks excellent for clean ammonia. While the IRA creates CCS upside for today’s SMR incumbents, across industrial gases, refining and chemicals.
Demand shifting: electrical flexibility by industry?
Demand shifting is the process of flexing electrical loads in a power grid, in order to smooth out volatility. Especially short to medium-duration volatility associated with wind and solar. This database scores technical potential and economical potential of different electricity-consuming processes to shift demand, across materials, manufacturing, industrial heat, transportation, utilities, residential HVAC and commercial loads.
Renewable output is volatile. Solar generation is volatile. Wind generation is volatile. The volatility spans from second-to-second volatility, through to minute-by-minute, hour-by-hour, day-by-day, season-by-season and even year-by-year.
Demand shifting is an excellent solution. It may be easy. It may cost nothing. It may not incur any energy penalties. Unlike batteries and hydrogen. And we think that ultimately 20-30% of the power grid may ultimately able be able to shift demand in some way.
To put it more bluntly, if your investment thesis for grid-scale batteries and green hydrogen is that electrolysers will be able to mop up “free power” at times when excess renewables “have nowhere else to do”, then here is a catalogue of 25+ other commercial and industrial that can literally start printing money first, simply using smart logic and power electronics, but without having to make any major new capital investments.
What is demand shifting? Demand shifting might involve turning an electrical load off when renewables are not generating, and turning it back on when renewables are generating. Or as a less extreme example, demand shifting might involve turning an electrical load down when renewables are not generating, and turning it back up when renewables are generating.
Electric vehicle chargers can slow their current flow minute-by-minute, or time non-critical charging activities for off peak times (note here, model here).
In residential heat, likewise, imagine a house that has both a gas-fired boiler and/or a heat pump and/or a resistive electrical heater in its well-insulated hot water tank. It is trivial to shift loads by a few minutes-hours, or switch between gas heating and electrical heating depending on prevailing prices. Especially with help from smart energy systems or predictive AIs.
In utilities, a nice example is the production of water by reverse osmosis, which yields 35bn tons of desalinated water each year, absorbing 250 TWH of electricity, as pumps force water molecules – but not salt ions – across a semi-permeable membrane, using about 3-4 kWh/m3 of pumping energy. Pumps can easily ramp up and shut down, and each 1c/kWh saved would decrease the cost of desalinated water by around 3.5% (membrane note here, osmosis model here). Similar examples include pipelines and utility pumps.
In the tech industry, the internet uses 1% of all global energy and 2% of all global electricity, of which one-third is data-centers (note here). But around 40% of data center loads can be shifted, of which two-thirds is temporal shifting and one-third is routing process loads to a data center at a different geographic location (more here).
In materials, there is great opportunity for demand shifting, because EBIT margins are usually around 20% and electricity is often c10% of total costs. If demand shifting save around 1c/kWh, or around 1pp of electricity cost, this is tantamount to a 5% uplift on EBIT, and by extension, a 5pp uplift on ROCE.
Whether materials can demand shift is highly dependent on the material production process, which itself can get quite complex. A “simple” pulp and paper plant has 18 separate stages, from de-barking (easy to flex) to pressing and drying (the process may need to be precisely controlled in order to make specialty grades of paper).
Across the materials industry, this data-file considers cement plants, industrial gas production, electric arc furnaces, aluminium, chlor-alkali, polymers, paper, silicon, sulphur, glass, hydrofluoric acid, small-scale hydrogen and hydrogen cyanide.
A best to worst ranking depends on the technical potential and economic potential. An electric arc furnace for steel recycling might typically have a low utilization as it is constrained by the ability to source scrap. A cement plant might use 110kWh/ton of electricity, of which 100kWh/ton is a non-time-critical comminnution circuit, grinding input rocks and output clinker into talcum powder. It may be easy to flex these loads and offer large savings. Conversely, you probably do not want to tinker with the process flows in a 1,100ºC process moving toxic gases when making Hydrogen Cyanide, or risk damaging semiconductors as pure silicon boules are crystallized out at 25 mm per hour in the Czochralski process.
Mining processes perhaps screen best of all? Processes such as communition, flotation, heap leaching and electrowinning screen as some of the most flexible processes in our entire data-file. And indeed, the Super-Majors of energy transition may include Super-Miners, as metals and materials demand booms.
In industrial gases, there is also a fascinating shift underway, where pressuring swing adsorption (using compressors and vacuum pumps, note here) is much more flexible than cryogenic plants that take days to cool down (note here).
Manufacturing operations may generally find it harder to demand shift. Consider that a modern auto plant might assemble a car by moving each vehicle along a production line with c1,000 x 1-minute discrete stages, in a continous process, where pausing any one stage effectively halts the entire line; and a full scale auto plant employs 1,000-3,000 people, whose sudden idling would be very expensive for the auto-maker (model here).
This data-file will serve as our reference file for which processes can shift demand and use demand shifting to integrate more renewables. We will continue building the data-file out over time.

