Energy technologies: the pace of progress?

energy technology development

This 12-page note looks back over 5-years of energy technology research. Progress has often been slower than we expected. Maturing early-stage technology takes 20-30 years. Progress slows as work shifts from the lab to the real world. We wonder whether 2050 will look more like 2023 than many expect; or if decarbonization must rely more on today’s mature technologies?

Alterra Energy: technology review?

Alterra Energy technology

Alterra Energy built the US’s first larger-scale plastic pyrolysis facility, in Akron, Ohio, and has steadily been refining its plastic recycling technology. The company recently signed license agreements with Neste and Freepoint. Alterra’s technology is a continuous plastic pyrolysis reactor, with seven discrete stages, using scavengers to remove contaminants, and patented hardware to minimize fouling and devolatilize chars.


Alterra Energy is a private company, headquartered in Ohio, which has been developing thermochemical plastic recycling technology since at least 2009.

The company built the US’s first larger-scale plastic pyrolysis plant in Akron, Ohio, at 60Tpd (23kTpa), starting up in 2017, stress-tested in 2018-19, and fully commissioned in 2020, converting 65-75% of hard-to-recycle mixed plastic waste into 115kbbls of oil fractions (PyOil), chemical feedstocks and waxes.

Alterra now aims to license its plastic recycling technology to large international companies, to generate licensing fees and revenues.

Plastic pyrolysis is a thematically exciting space, which we have been following since the early days of Thunder Said Energy in 2018 (note here), eliminating landfilling of hard-to-recycle plastics and denting long-term oil demand by multi-Mbpd.

However, progressing this chemical technology to commercial scale has been challenging (note here). Two thirds of the companies in next-generation plastic recycling have encountered setbacks or slow progress. And most recently, a select few leaders have risen to the top of our screen. Alterra is amongst them.

Neste Energy has now trialled the technology in Finland and plans to build plants at Vlissingen, Netherlands (55kTpa) and Porvoo, Finland, early steps in a plan to process 1MTpa of plastic waste from 2030 onwards (press release here).

Freepoint Eco-Systems also selected Alterra technology for a 192kTpa advanced recycling facility on the US Gulf Coast, in February-2023, with the output expected to be sold on to Shell (press release here).

Hence we have reviewed Alterra’s technology. Based on the patents, we can pinpoint five challenges in the plastic recycling industry, which Alterra aims to overcome.

Alterra’s patents cover a continuous process, with seven distinct stages (chart below), each with optimized reaction temperatures and residence times. Scavengers are added at the feed stage to remove impurities. And specific hardware is also discussed for mitigating fouling and de-volatilizing char. Good details are given in the patents.

Our observations on Alterra’s technology are covered in the data file. For example, heavy uses of scavengers may add costs above those considered in our simple plastic pyrolysis economic model. However, five years on from first looking at this technology, we also see increasing value in reliability, uptime and the ability to operate robustly.

Vehicle fleets: service life and retirement age by vehicle type?

The weighted-average combustion vehicle in the world has a current age of 12-years and an expected service life of 20-years. In other words, a new combustion vehicle entering the global fleet in 2023 will most likely be running through 2043. Useful data and notes are compiled here.


How long will new combustion vehicles remain in service and contribute to global oil demand? To answer this question, we have compiled data into different vehicle types.

One method to estimate the average service life of a vehicle is simply to take the average age of that type of vehicle in today’s fleet as a proxy. For example, the average passenger car in operation is around 12-years old, implying that half of cars might last less than 12-years and half last longer.

However this is a 25-50% under-estimate of ultimate vehicle life, because unless all global vehicles are suddenly scrapped tomorrow, then most of these vehicles will last a good while longer. The average age at retirement for vehicles in the US is closer to 16-years (charts below).

In many categories, the average has been pulled downwards by rapid expansion of the fleet in the emerging world. For example, some of the world’s youngest airplane fleets today belong to China’s Hainan Airlines (5.1-years), Saudia (5.1-years), Sichuan Airlines (5.7-years) and Brazil’s Azul Linhas (6.0-years). Likewise, the excellent “global bus survey” notes that the age of the average bus in service globally has effectively been halved by rapid growth of the bus fleet in China, Russia, Brazil, Indonesia, Mexico and Korea.

Another challenge is that vehicles getting retired in the developed world often simply get transported to frontier economies in the emerging world, where they have an entire second life. Africa imported 1.5M vehicles from the US, EU and Japan in 2018, and a significant share are over 15-years old at the time of arrival (!). The UN is advocating for tighter legislation here. For example, in 2022, Nigeria lowered the age limit on imported vehicles from 15-years to 12-years.

There are also broad distributions in vehicle ages, around the stated averages (chart below). And the rate of new vehicle purchases and old vehicle retirements also seems to fluctuate with economic conditions.

Hence we think the best overall estimates for vehicle lives is the targeted service life from the manufacturer, and some guidelines are tabulated in the data-file along with our notes. The average combustion vehicle entering service in 2023 is expected to last 20-years.

The shortest vehicle lifespans are expected for buses and heavy trucks, at c15-years, while the longest service lives are expected for new planes, ships and trains at 25-35 years.

The longest-lasting vehicles in our data-set include 0.5% of passenger cars in the US that are over 30-years old (chart above), and we also occasionally see a Soviet Zhiguli death-trap on the roads in Tallinn over here in the year of our lord 2023. Elsewhere, there are rail cars in service with half-a-century of history. In 2021, Mitsui noted it had scrapped its first LNG carrier, the Sunshu Maru, after a 37-year service life starting in 1984. And there are planes still taking to the skies that were constructed in 1978-81 before the oil shocks (e.g. from Iranian and Venezuelan carriers).

The full data-file contains estimates into the current fleet age (in years) and service life (years) for different types of vehicles, such as light vehicles, heavy trucks, airplanes, buses, bulk freighters, diesel trains, container ships, liquid tankers and other general ships.

Entropy CCS: natural gas CCS breakthrough?

Entropy CCS technology

Advantage Energy is a Montney gas and oil producer, which recently sourced a $300M investment from Brookfield to scale up its Entropy23 amine blend for natural-gas CCS. Entropy CCS technology has captured 90-93% of the CO2 at the first pilot plant at Glacier, Alberta, with 2.4 GJ/ton reboiler duty, which is 40% below MEA. This 7-page report summarizes Entropy patent details, confirming a moat around the technology, but three key points for de-risking.


Two challenges for post-combustion CCS have recently been in focus in our research. The first one is energy penalties of CCS (note here, data here). And the second one is amine degradation and possible release of toxic breakdown products to the atmosphere (note here).

One solution is to scrub the gas extensively before it reaches a CCS plant, including with a SO2 scrubber, SCR denox loop and electrostatic precipitator, which all add cost. Another solution is to prioritize relatively pure input streams and stable CCS solvents. For example we have recently looked at Aker’s JustCatch and Shell’s CANSOLV.

Advantage Energy, listed on TSX, has also been gaining attention in CCS markets, as it claims to have developed a solvent with low reboiler duty, low degradation rates. The Entropy CCS solvent has been tested at multi-kTpa scale at the Glacier gas plant in Alberta, and Brookfield has agreed to invest $300M in its scale-up (page 3).

We reviewed a highly detailed, 58-page patent from Entropy Inc in 2023, covering 25 different solvents that were tested in the lab, and scored the technology on our usual patent assessment framework.

Based on our Entropy CCS technology review, we can confidently guess what the solvent blend is (i.e., specific components, chart below), how and why it works, how degradation has been tested in the past, and whether there is a moat around the technology (pages 4-6).

Remaining challenges: what residual areas to de-risk for Entropy CCS technology? We outline three constructive findings, which decision-makers may wish to consider and explore. They are noted on page 7.

Industrial gases: air separation units?

industrial gases

Cryogenic air separation is used to produce 400MTpa of oxygen, plus pure nitrogen and argon; for steel, metals, ammonia, wind-solar inputs, semiconductor, blue hydrogen and Allam cycle oxy-combustion. Hence this 16-page report is an overview of industrial gases. How does air separation work? What costs, energy use and CO2 intensity? Who benefits amidst the energy transition?

Cement costs and energy economics?

Cement costs and energy economics

This data-file captures cement costs, based on inputs, capex and energy economics. A typical cement plant requires a cement price of $130/ton for a 10% IRR, on capex costs of $200/Tpa, energy intensity of 1,000 kWh/ton and CO2 intensity of 0.9 tons/ton. Cement costs can be stress tested in the data-file.


The world produces 4GTpa of cement, which is blended with aggregates to yield 30GTpa of concrete in the construction industry; some of the most extensively produced materials in industrial civilization.

Cement is also important for the energy transition. A wind turbine uses 67 tons of cement per MW. So too might foundations of utility scale solar, power transmission lines, or the “pads” used to house batteries and hydrogen plants.

The marginal cost of cement production is estimated at $130/ton in this data-file, in order to achieve a 10% IRR, which is similar to the average price of cement in the US in 2021-22.

The breakdown of costs, in USD per ton of cement, includes: $40/ton for limestone inputs which are then calcined into clinker; $20/ton for heat which is mainly coal and petcoke today; $20/ton in capital costs for a 10% IRR; $20/ton for CO2 and the CO2 price can be flexed in the model; $10/ton for electricity; and $20/ton for other material inputs, labor, O&M and taxes.

CO2 intensity is estimated at 0.9 tons/ton in our base case, but there are interesting opportunities for decarbonization. Half of the CO2 from a cement plant is 20-30% concentrated CO2 from the thermal decomposition of limestone (CaCO3->CaO + CO2) which could be amenable to CCS.

Switching out solid fuels (coal) for gas would save 0.1 tons/ton. Around 100kWh/ton of electricity use is the grinding of inputs and clinker, and this is a very flexible load that can easy “demand shift” to run off a heavy share of renewables in future power grids.

Inflation in cement costs could be a challenge in the energy transition. European heat, electricity and CO2 prices can very easily double the marginal costs of production. Much of the growth in cement demand is also concentrated in emerging world countries, where cost sensitivity is high and CO2 is lower down the priority list. 

We have also screened technologies aimed at decarbonizing cement and concrete, such as Solidia, CarbonCure, or thinking laterally, substitution towards timber products.

Power grids: down to the wire?

Power grid metals demand

Power grid circuit kilometers need to rise 3-5x in the energy transition. This trend directly tightens global aluminium markets by over c20%, and global copper markets by c15%. Slow recent progress may lead to bottlenecks, then a boom? This 12-page note quantifies the rising demand for circuit kilometers, grid infrastructure, underlying metals and who benefits?

Wind turbine generators: DFIGs or Rare Earth magnets?

wind turbine generators

Wind turbine generators can use doubly fed induction generators (DFIGs) or permanent magnet synchronous generators (PMSGs) based around Rare Earth metals. This data-file captures the trends in DFIGs vs PMSGs over time by tabulating 40 examples, as turbines have grown larger, and different wind turbine manufacturers have adopted different strategies.


How do wind turbines generate electricity? Both doubly fed induction generators (DFIGs) and permanent magnet synchronous generators (PMSGs) retain a balanced market share in modern wind turbines, converting rotational energy into electrical energy.

For an overview of the different designs, please see our overview of magnets, overview of electricity and overview of wind power-electronics.

This data-file tabulates data into forty recent wind turbine designs, sampling across all of the leading wind turbine manufacturers. We have tabulated the model, manufacturer, country, capacity (MW), year introduced (YYYY), rpm, gear system, typical voltages (kV, where available), generator system and other power electronic details.

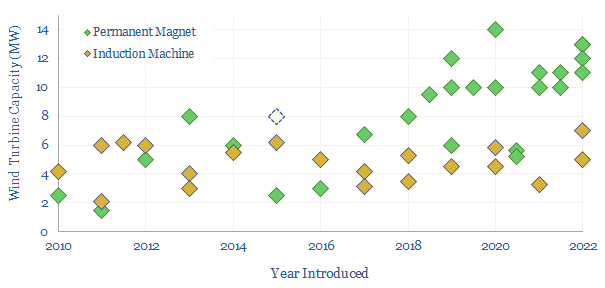
Capacity trends. The maximum power capacity for DFIG turbines has been hovering around the 6-8MW mark for the past decade, while the trend towards larger 10-15MW turbines, especially offshore, is almost always associated with PMSG turbines.

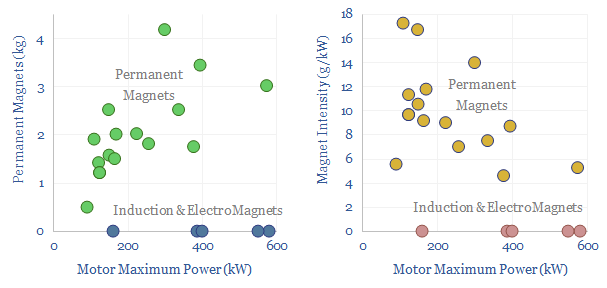
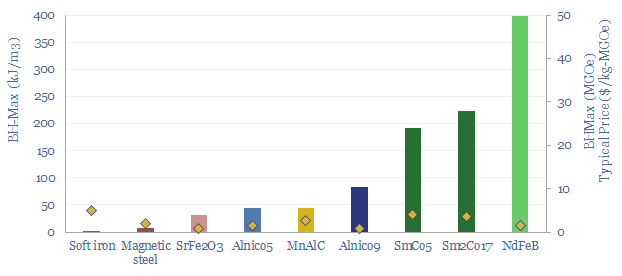
Why do wind turbines use Rare Earth magnets? The short answer is that Rare Earth magnets have greater magnetic field strengths (flux densities), which opens up direct drive generator configurations with much lower gearing, and without requiring their own input power supply like the electromagnets in DFIGs do.

Advantages of PMSGs are cited by different operators, including higher >96% efficiency, fault ride-through, lower maintenance, more compact nacelles, easier installation.

Elimination of gears is an advantage for PMSGs as it can help to avoid maintenance issues, which typically costs $40/kW of capacity and 1-2c/kWh on levelized cost. For geared turbines, the gearbox is by far the largest source of maintenance issues (data here).

About two-thirds of the PMSGs in our data-file use direct drive to impart rotation into their power-dense magnets (no gears). Almost all of the IGBT turbines use gears, to step up the rotational speed by around 100:1, on average. Some PMSGs retain gears in order to lower the amount of Rare Earth materials/magnets required by up 90% (e.g. Vestas).

More compact turbines are associated with PMSGs, and this is an advantage, as it lowers the costs associated with wind turbine installation and offers faster commissioning.

Fault ride-through is one of the most commonly cited issues for using Rare Earth PMSGs rather than DFIG turbines. A DFIG requires a power connection to magnetize the electromagnets in its rotor. If the power input drops, then the power output also drops.

Chinese manufacturers have been gravitating towards PMSGs especially since 2016. For example when Goldwind switched from DFIGs to PMSGs, the company noted it was able to eliminate 13 gears and “hundreds of parts”.

Vestas and GE have been relatively vocal about benefits of permanent magnets. GE back to 1998 (!). Vestas is now using Rare Earth elements in all new grid turbine models (per the Vestas website here).

Conversely, two other European manufacturers stand out as they have been more reluctant to use permanent magnets, and more focused on DFIG designs, especially in smaller turbines and onshore turbines.

Our forecasts for Rare Earth magnet use in future wind turbine’s bill of materials, both in mass terms (kg/kW) and in cost terms ($/kW) is modelled here.

Underlying data behind these observations is set out in the data-file of wind turbine generators. If you want to understand how magnets in wind turbines work, we recommend our overview of magnets. All of our broader wind research is here.

Electric vehicles: motors and magnets?

Electric vehicle magnets

This data-file assesses electric vehicle magnets, the use of permanent magnets and the use of Rare Earth materials such as neodymium (NdFeB). 80-90% of recent EVs have used Rare Earth permanent magnets, averaging 1.5 kg per vehicle, or 7.5g/kW of drive-train power, across the data-file. But the numbers vary vastly. From 0-4 kg per vehicle. 20 vehicles from different OEMs are tabulated in the data-file.


Electric vehicle motors produce torque as magnets in their rotors try to align with rotating magnetic fields that are created in their stator windings by traction inverters. For more details and underlying theory, please see our overview of magnets.

What magnets are used in electric vehicles? 80-90% of electric vehicles sold in the past half decade have used permanent magnets in their rotors, according to different sources.

This data-file tabulates the magnets used by different manufacturers, in kg/vehicle, kg/kW of power, and over time. The average EV in our screen used 1.5kg of Rare Earth Magnets per vehicle, which equates to 7.5 g/kW of power.

The scatter is broad. Some vehicles will use 4 kg of Rare Earth magnets, or as much as 15 g/kW. Almost all of the Rare Earth Magnets are NdFeB, although there are differing blends of other Rare Earths, including dysprosium and praseodymium.

Rare Earth magnets are preferred, because they are more efficient and more reliable. For example, one alternative is to use an electro-magnet in the rotor, but then this magnet needs a power supply (impacting efficiency by 1-3pp) and there is a risk of degradation on the rotating electrical connection (brushes) that feed this power supply in. Another alternative is to use induction, to magnetize the rotor core, but core losses and iron losses also leak power (impacting efficiency by 2-7pp) and generate heat via hysteresis.

Thrifting Rare Earths from EVs. One strategy we have seen from EV makers is to use less magnetic material. For example, this can be achieved by using a permanent magnet motor for the rear wheels, and induction machines on the front wheels. The induction motors are often idled for efficiency reasons, and only used when extra front-wheel power is required. Another approach to thrifting out Rare Earths optimizes the shapes or “slots” of the rotor, or winding configurations in the stator. The materials make-up of different EVs is charted below.

Supply chains. Another strategy we have seen is for EV makers to sign agreements that help guarantee security of supply. For example, in 2022 Hyundai-Kia signed an 1,000-1,5000 Tpa offtake agreement for NdPr oxides from Arafura Resources at the Nolans mine, 135km North of Alice Springs (reported here). Likewise, General Motors will source Rare Earths from MP Materials’ Mountain Pass mine project (reported here).

A final strategy is to use electro-magnets or induction motors in lieu of permanent magnets. Famously, this strategy was used by Tesla in the Model S and Model X, while Tesla said in early-2023 that it would also move away from Rare Earth magnets in future versions of the Model Y. Some European auto-makers are also adopting this strategy (details in the data-file).

There is some guesswork in the data-file. For some companies, clear data are available. For others, more painfully, googling the vehicle’s name and the keyword “magnets” was more likely to return hundreds of hits for promotional fridge magnets depicting the vehicle’s sleek design features, rather than reveal information about the use of Neodymium in its drivetrain.

Will Rare Earths be a bottleneck for electric vehicles? We think that the ramp-up of wind turbines and electric vehicles will require very large expansions in Rare Earth metals production, while in times of shortage, OEMs will sacrifice efficiency by thrifting out bottlenecked materials and relying on induction or electromagnetic machines. For more details, please see our broader research into Rare Earths.

Magnets and energy: fundamental attraction?

Overview of magnets

Electric currents create magnetic fields. Moving magnets induce electric currents. These principles underpin 95% of global power generation, 50% of wind turbines, motors that comprise 45% of electricity use, heat pumps, and electric vehicles. But what actually are magnets? How are they measured? Why do so many use Rare Earth metals? This 15-page overview of magnets explains key magnet concepts for the energy transition.

Copyright: Thunder Said Energy, 2019-2024.