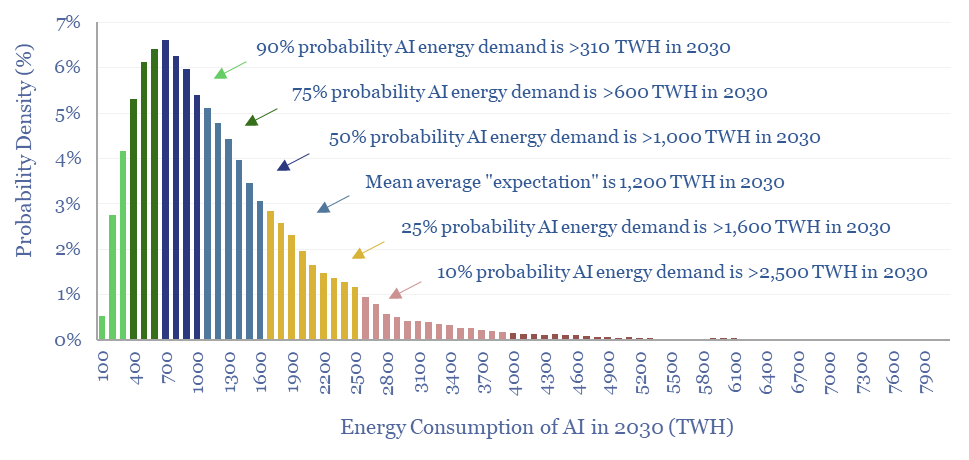
Rising energy demands of AI are now the biggest uncertainty in all of global energy. To understand why, this 17-page note is an overview of AI computing from first principles, across transistors, DRAM, GPUs and deep learning. GPU efficiency will inevitably increase, but compute increases faster. AI most likely uses 300-2,500 TWH in 2030, with a base case of 1,000 TWH.
The midstream industry moves molecules, especially energy-molecules, and especially in pipelines. Despite the mega-trend of electrification, there are still strong midstream opportunities in the energy transition, backstopping volatility and moving new molecules. This short note captures our top ten conclusions.
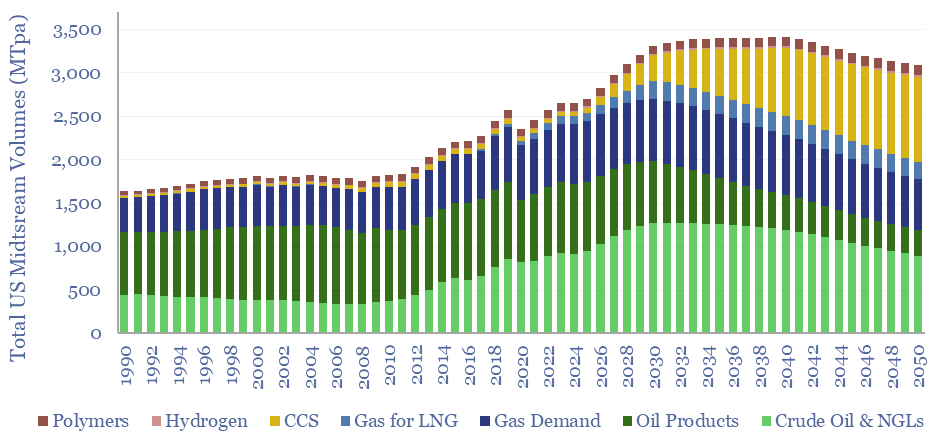
(1) Our overall outlook on the US midstream industry sees the total tonnage of molecules moved rising by 25%, from 2.6GTpa in 2023 to 3.3GTpa in 2030, and then plateauing around these levels. This illustrates that growth opportunities in gas, CCS and some hydrogen value chains outweigh declines in markets such as oil.
(2) Global gas demand doubles in our roadmap to net zero, in order to displace coal; global LNG trebles; while another under-appreciated angle is that growing applications like blue hydrogen, LNG and polymers all require more gas processing within the midstream sector as part of their value chains. Narrowing in on the US market, US gas demand rises 8% by 2030 and 12% by 2035 as captured in our US energy model.
(4) Volatility is also rising in the global energy industry, due to the inherent volatility of solar and wind. Rising volatility increases the value of midstream infrastructure, which by definition, can arbitrage the volatility by moving molecules from areas of low pricing to high pricing.
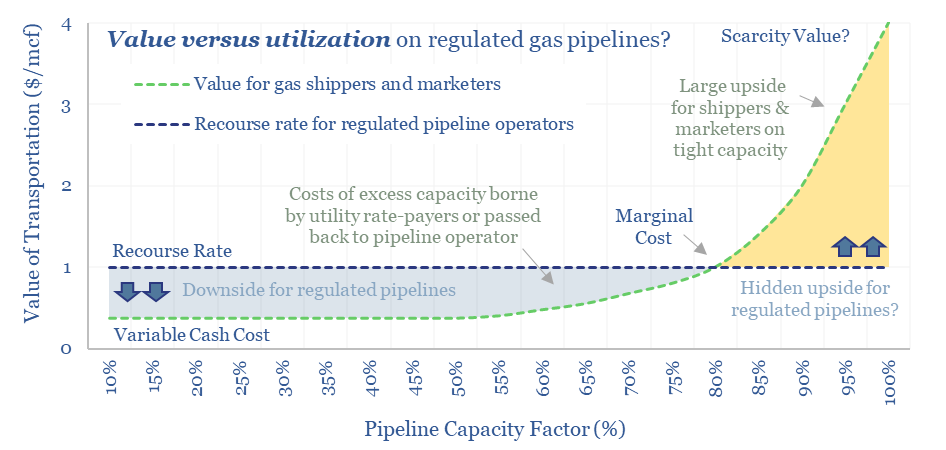
(5) The upside from tighter capacity and rising volatility primarily accrues to marketers and traders, because of the way pipeline assets are regulated (e.g., by FERC), but some upside inevitably trickles back to the regulated pipelines too, per our 13-page note here.
(6) Global oil demand does soften to 85Mbpd by 2050 in our roadmap to net zero, but the mix shift may be more sanguine for midstream companies, scaling back products that tend NOT to be delivered by pipeline (e.g., gasoline) while scaling up products that do (e.g., jet fuel, BTXs, intermediates for polymers). Looking by region, we also see continued growth through 2030 in US shale output.
(7) CO2 disposal ramps up most of any new midstream opportunities, from c40MTpa in the early-2020s to 7GTpa globally by 2050, in our roadmap to net zero, across conventional CCS, blue hydrogen, CO2-EOR and novel combustion and next-gen DAC. We think c1GTpa will be in the US. CO2 purity must be >90%, ideally >97%. This is the largest new growth opportunity for midstream companies.
(9) Mitigating methane leaks remains a crucial priority, especially in gas gathering lines. The best opportunities are captured in our report on mitigating methane leaks and by building our more midstream infrastructure to reduce flaring, where as much as 8% of the methane may slip through the flares uncombusted.
FERC regulations are surprisingly interesting!! In theory, gas pipelines are not allowed to have market power. But they increasingly do have it: gas use is rising, on grid bottlenecks, volatile renewables and AI; while new pipeline investments are being hindered. So who benefits here? Answers are explored in this 13-page report.
Electronic devices are changing the world, from portable electronics to AI data centers. Hence what materials are used in electronic devices, as percentage of mass, and in kg/kW terms? This data-file tabulates the bill of materials, for different devices, across different studies.
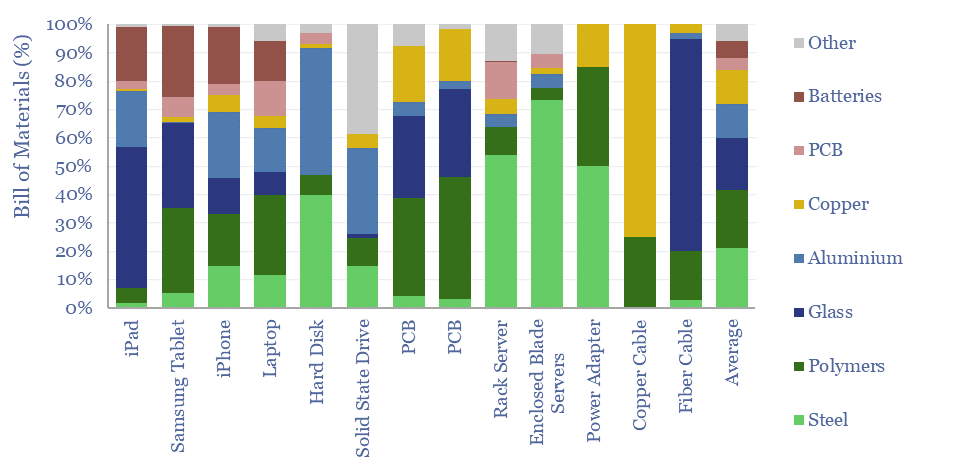
This data-file captures the bill of materials for electronic devices, such as cell phones, tablets, laptops, hard discs, solid state-drives, printed circuit boards, servers in data-centers, power supply units, adapters, copper cables and fiber optic cables.
Five materials make up c85% of the mass of typical electronic devices: advanced polymers (c20%), steel (c20%), glass (18%), aluminium (12%) and copper (12%). However, the exact numbers vary by product, as shown in the chart above.
Steel is the joint largest material exposure for electronic devices, although this is unsurprising, as steel is the most-used structural material on the planet, and in digital devices as well, it is used for the chassis/enclosure of data-center racks and other components, in switchgears, fans, heat sinks, etc.
Advanced polymers are the single most important material, both by mass and by specialization. HDPE and PVC are often used for electrical insulation in wires, cables and power supply units. PCBs are c35% epoxy resin. Polycarbonates are used in hard drives and optical disc drives. Solid state drives use specialty polymers, such as liquid crystal polymers.
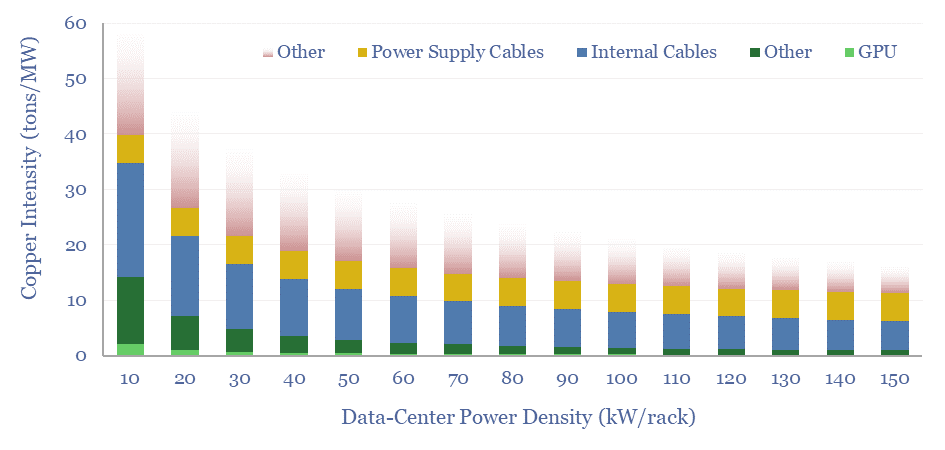
Copper use from the rise of AI is more debatable. For example, several older studies suggest copper use in AI data-centers can range from 30-60 tons/MW. But on the other hand, these older studies may not fully reflect the scale-up of computing density per rack, which could reduce copper use to 10 tons/MW, albeit this would still tighten global copper balances by around 1% per year through 2030.
The ability to thrift out bulk material intensity factors by raising computing performance density, using advanced materials and manufacturing techniques is highly reminiscent of the same trend in new energies (raising solar efficiency, raising battery voltages). This creates opportunities in vapor deposition equipment, advanced polymers, and ultra-high purity materials including tantalum, silver, gold, tin, et al.
This data-file evaluates transmission and distribution costs, averaging 7c/kWh in 2024, based on granular disclosures for 200 regulated US electric utilities, which sell 65% of the US’s total electricity to 110M residential and commercial customers. Costs have doubled since 2005. Which utilities have rising rate bases and efficiently low opex?
Regulated electrical utilities in the US are required to submit their capex, opex and SG&A costs to FERC via Form 1 filings. The data are used to determine acceptable utility charges, and also made freely available to the public, after a lag.
Costs of transmission and distribution utilities have doubled in the past 20-years, even in real terms, from 3.5 c/kWh in 2004-05 to 7c/kWh in 2024. Rising costs would seem to incentivize self-generating especially amidst grid bottlenecks?
The largest reason for rising costs is rising transmission and distribution capex to accomodate renewables, trebling from 1c/kWh to 3c/kWh. Our numbers actually understate the costs charged to consumers, which will also include a statutory return on prior period capex, in addition to the direct costs that are tabulated in the file. This underscores a conclusion in our recent research: while renewables are a good, low-cost way of decarbonizing, they do add costs on a total system basis.
Over the past ten years, we estimate that 50% of utilities’ direct costs are capex and 50% are opex. The capex is 50% distribution, 35% transmission and 15% plant. The opex is 60% customer G&A, 25% T&D opex and c15% T&D maintenance.
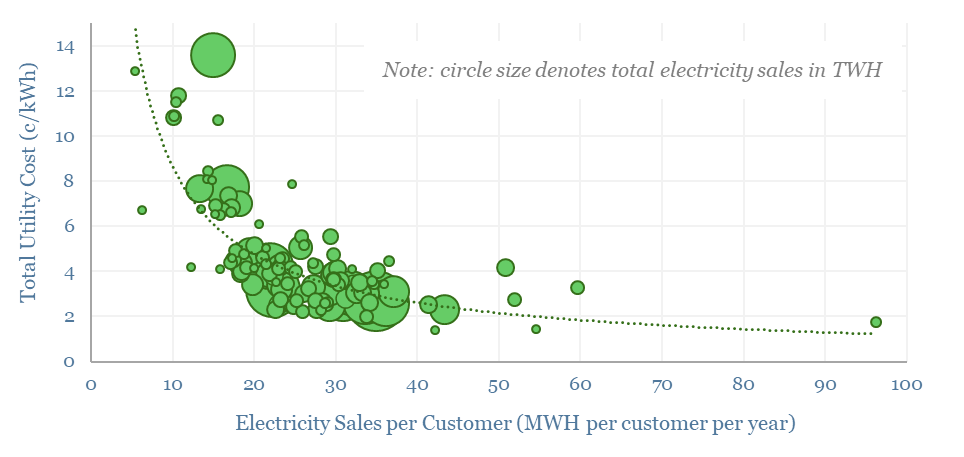
Costs are -60% correlated with average power sales per customer, or in other words, customer type. Across the US, the average residential household uses 10MWH pa, the average commercial busines uses 70MWH and the average industrial facility uses 2GWH. Costs approximately halve when average power use per custromer doubles.
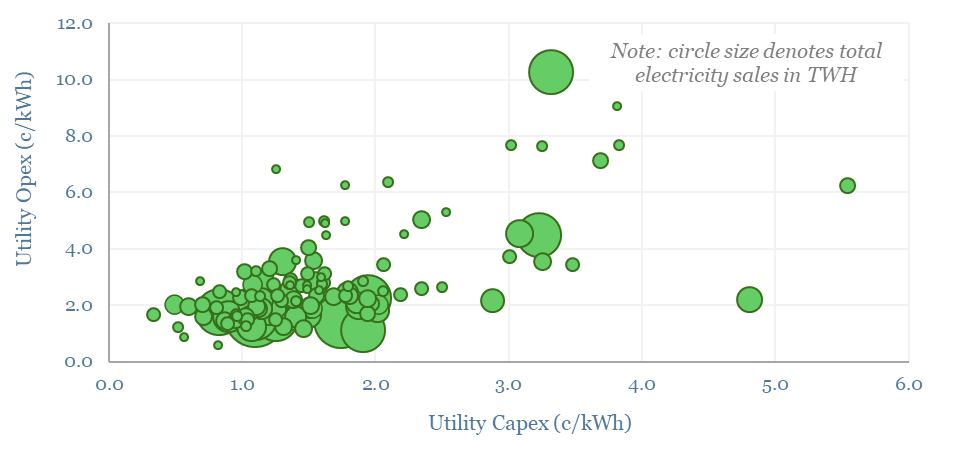
The largest US utilities, with 2-5M customers each and 80-120 TWH pa of electricity sales include PG&E, SCE, FPL, Oncor, ConEd, ComEd, Duke, Centerpoint, DTE. Capex costs range from 0.5-5 c/kWh and opex cost range from 1-10 c/kWh.
The ideal mix is high capex and low opex, as this indicates a well-run utility with a rising rate base and thus rising earnings potential? PSEG, SCE, ConEd, FPL perhaps stand out most on these metrics.
Regulated utilities are not really meant to have pricing power. But bottlenecks are biting, and we do wonder whether value inevitably trickles back to infrastructure owners and operators, in power grids and especially in gas pipelines.
The key drawback to the data that are tabulated in this file is their recency. FERC has released data from 1994-2019 in Excel format, utility by utility. The FERC website has data through 1H21 in dbf format. We will update this data-file if and when further data are made available by FERC.
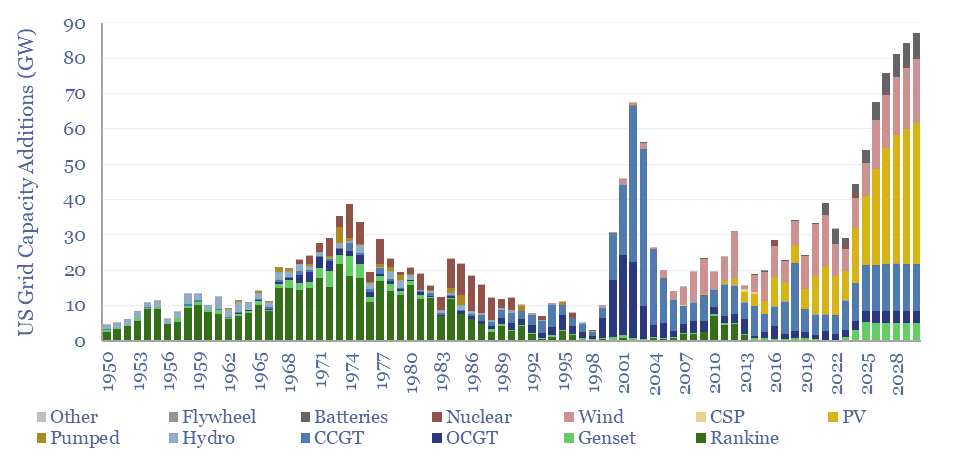
The power demands of AI will contribute to the largest growth of new generation capacity in history. This 18-page note evaluates the power implications of AI data-centers. Reliability is crucial. Gas demand grows. Annual sales of CCGTs and back-up gensets in the US both rise by 2.5x?
Cummins is a power technology company, listed in the US, specializing in diesel engines, underlying components, exhaust-gas after-treatment, diesel power generation and pivoting towards hydrogen. We reviewed 80 patents from 2023-24. What outlook for Cummins technology and verticals in the energy transition?
Hence we have been exploring companies in medium-scale commercial and industrial power generation, such as Generac.
Cummins was founded in 1919, headquartered in Indiana, with 75,500 employees and is listed on NYSE with c$40bn of market cap in 2024.
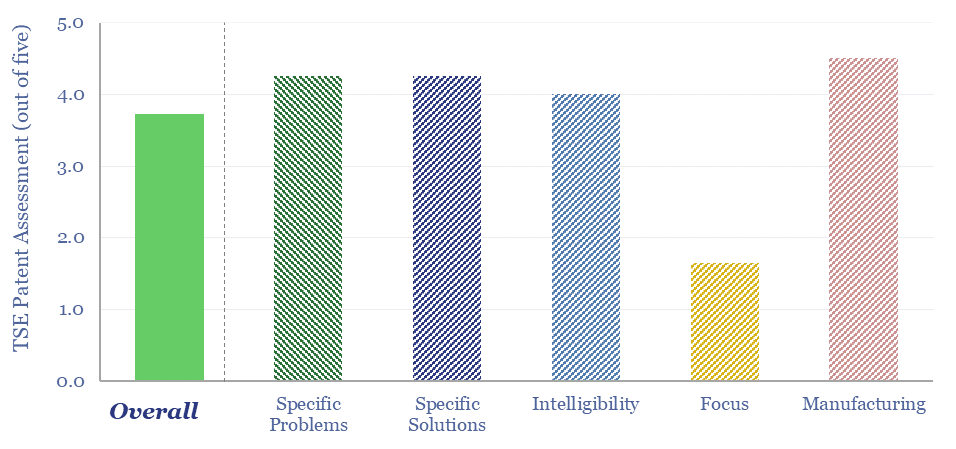
Cummins has filed c5,000 patents historically. We reviewed 80 of the most recent patents filed in 2023-24. Most are clear, articulate specific issues that need to be addressed, including lower-cost or easier manufacturing, then describe specific components and solutions alongside detailed engineering diagrams.
The breakdown of Cummins’s business, by revenue, EBITDA and patent filing focus surprised us, with lower exposure to power generation and a growing focus upon hydrogen.
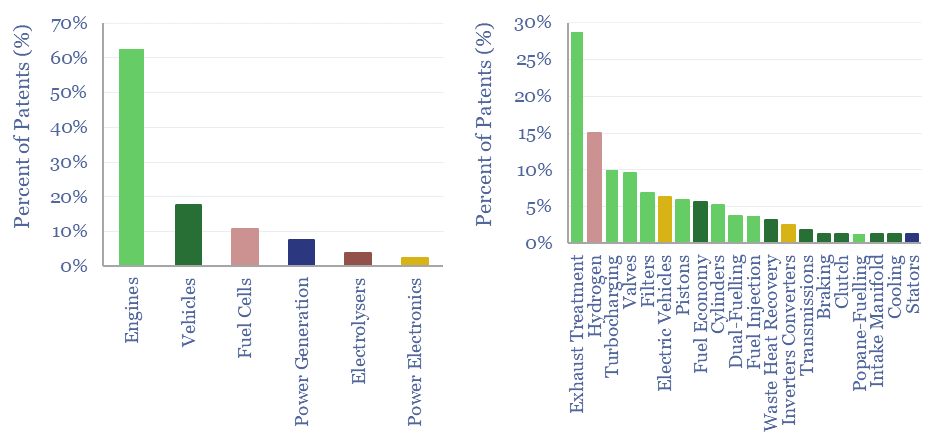
Based on patent filings, it may even seem as though power generation is being de-prioritized, while hydrogen is being heavily re-prioritized and comprised c15% of recent patents in 2023-24 (chart below).
However the largest focus area remains its core business of diesel engines and exhaust-gas after-treatment (to remove NOx). Our long-term oil demand outlook does see growing demand in this end market.
Exhaust from a diesel engine contains NOx and particulates. An after-treatment unit typically reduces NOx into N2 and H2O using a 30-35% solution of urea in 65-70% deionized water. Heated urea decomposes: CO(NH2)2 + H2O -> 2NH3 + CO2. NH3 then reacts with NO: 4NH3 + 4NO + O2 -> 4N2 + 6H2O. The urea solution is marketed under brands such as AdBlue from BASF. Cummins is among the largest vendors of after-treatment systems in the world, worth >$5bn pa in sales.
However, this business is casting off the shadow of a $1.7bn Clean Air Act fine in 2023, for installing defeat devices. Yet we did find clear, specific and detailed patents improving after-treatment systems.
Another large component of the patents focuses upon diesel engines, improving the fuel economy and resiliency of engines, valves, pistons, cylinders and other components. Details are in the data-file.
This data-file contains our conclusions into Cummins’s diesel engine and generator technology, a broader outlook for some of the company’s verticals, and some undiplomatic comments which we should probably have left out.
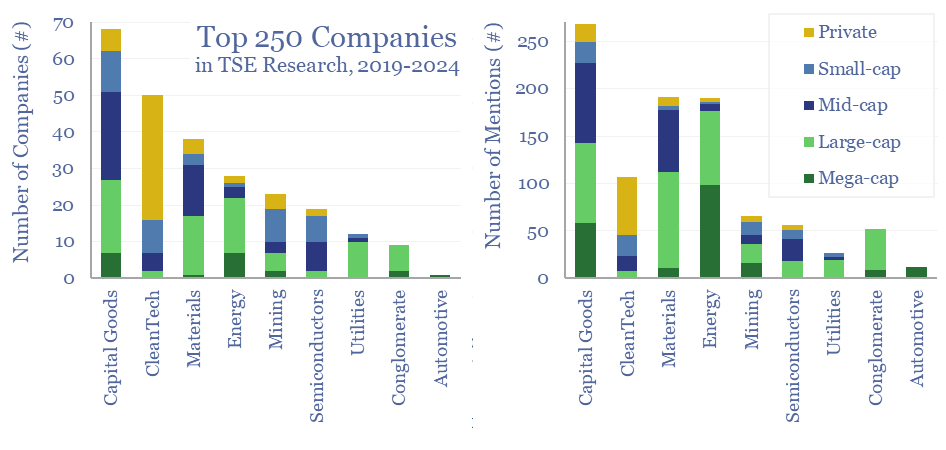
This note summarizes the key conclusions from our energy transition research in 1Q24 and across 1,400 companies in total. Volatility is rising. Power grids are bottlenecked. Hence what stands out in capital goods, clean-tech, solar, gas value chains and materials? And what is most overlooked?
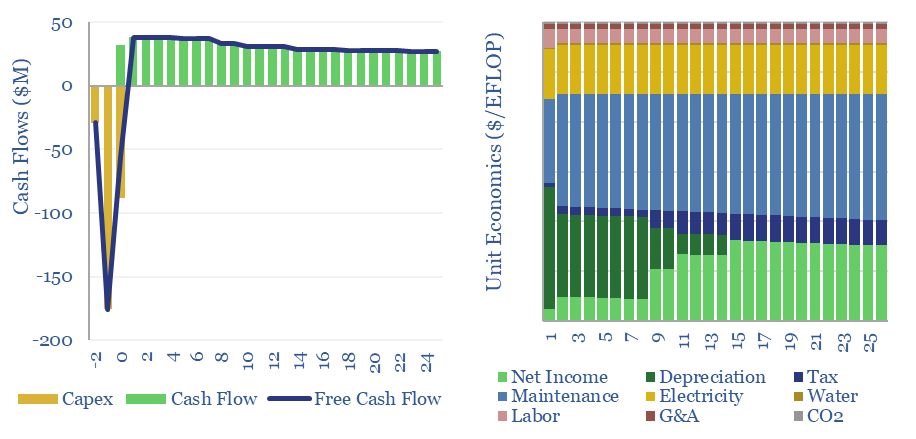
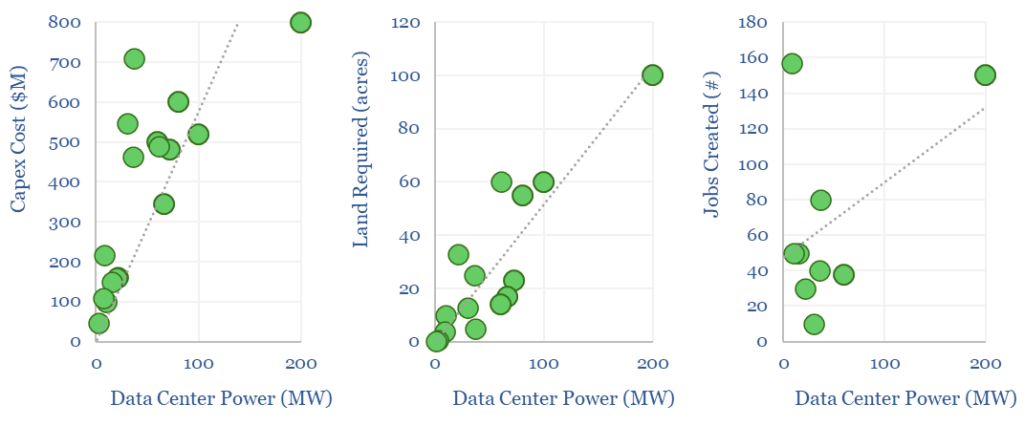
The capex costs of data-centers are typically $10M/MW, with opex costs dominated by maintenance (c40%), electricity (c15-25%), labor, water, G&A and other. A 30MW data-center must generate $100M of revenues for a 10% IRR, while an AI data-center in 2024 may need to charge $3M/EFLOP of compute.
Data-centers underpin the rise of the internet and the rise of AI, hence this model captures the costs of data-centers, from first principles, across capex, opex, land use and other input variables (see below).
In 2023, the global data-center industry is $250bn, across 500 large facilities, 20,000 total facilities, and around 40 GW of capacity, which likely rises by 2-5x by 2030.
A 30MW mid-scale data-center, costing $10M/MW of capex, must generate $100M pa of revenues, in order to earn a 10% IRR, after deducting electricity costs and maintenance.
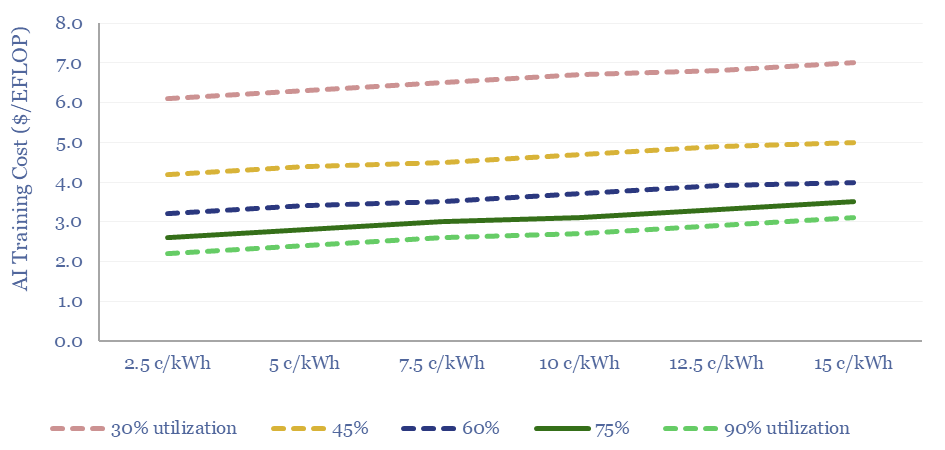
If the data-center is computation heavy, e.g., for AI applications, this might equate to a cost of around $3/EFLOP of compute in 2023. This fits with disclosures from OpenAI, stating that training GPT 4 had a total compute of 60M EFLOPs and a training cost of around $160M.
However, new generations of chips from NVIDIA will increase the proportionate hardware costs and may lower the proportionate energy costs (see ComputePerformance tab).
Reliability is also crucial to the economics of data-centers: uptime and utilization have a 5x higher impact on overall economics than electricity prices. This makes it less likely that AI data-centers will be demand-flexed to power them using the raw output from renewable electricity sources, such as wind and solar?
Economic considerations may tip the market towards sourcing the most reliably power possible, especially amidst grid bottlenecks, and it also explains the routine use of backup power generation.
Another major theme is the growing power density per rack, rising from 4-10kW to >100kW, and requiring closed-loop liquid cooling.
Please download the data-file to stress-test the costs of a data-center, performance of an AI data-center, and we will also continue adding to this model over time. Notes from recent technical papers are in the final tab.
What if large quantities of power could be transmitted via the 2-6 GHz microwave spectrum, rather than across bottlenecked cables and wires? This 12-page note explores the technology, advantages, opportunities, challenges, efficiencies and costs. We still fear power grid bottlenecks.
Cookies?
This website uses necessary cookies. Our cookies are simply to improve your experience. We do not undertake any advertising or targeting via our cookies. By clicking 'accept' or continuing to use the website, you consent to our use of cookies.AcceptRead More
Privacy & Cookies Policy
Privacy Overview
This website uses cookies to improve your experience while you navigate through the website. Out of these, the cookies that are categorized as necessary are stored on your browser as they are essential for the working of basic functionalities of the website. We also use third-party cookies that help us analyze and understand how you use this website. These cookies will be stored in your browser only with your consent. You also have the option to opt-out of these cookies. But opting out of some of these cookies may affect your browsing experience.
Necessary cookies are absolutely essential for the website to function properly. This category only includes cookies that ensures basic functionalities and security features of the website. These cookies do not store any personal information.
Any cookies that may not be particularly necessary for the website to function and is used specifically to collect user personal data via analytics, ads, other embedded contents are termed as non-necessary cookies. It is mandatory to procure user consent prior to running these cookies on your website.