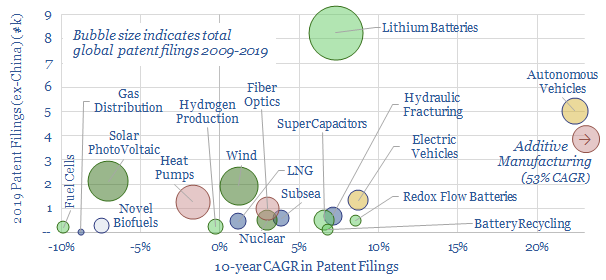
This short 3-page note summmarizes 20 different TSE patent screens, to assess the pace of progress in different energy technologies. Lithium batteries are most actively researched. Autonomous vehicles and additive manufacturing technologies are accelerating fastest. Wind and solar remain heavily researched, but the technologies are maturing. The steepest deceleration of interest has been in fuel cells and biofuels. It remains interesting to compare the pace of progress within sub-industries. Our full underlying data-file behind this research paper is linked here.
This data-file looks through 20 technologiesthat can reduce the CO2 intensity of the oil and gas sector. It contains our economic assumptions and our workings behind each technology.
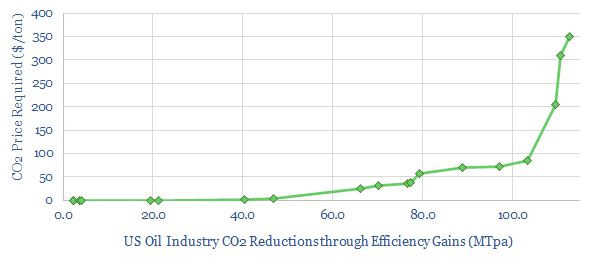
A CO2 priceof $40/ton could effectively encourage 10% CO2 reductions that are already economic but have not yet taken place, while an $80/ton CO2 price could incentivize total decarbonization of 20%.
The CO2 price requiredto incentivize a CO2 saving project is closely correlated with its capex cost, and our data allows us to derive rules-of-thumb.
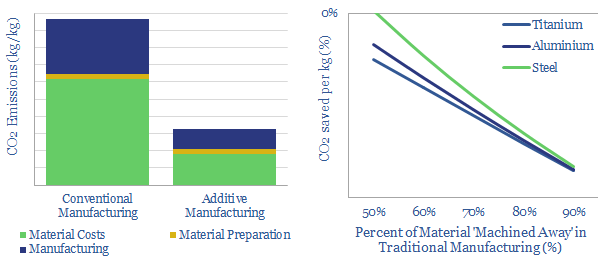
Manufacturing metal components can be extremely energy intensive, emitting 50-250kg of CO2 per kg of finished parts, as 60-95% of original materials are machined away in the manufacturing process.
This is where additive manufacturing is able to deliver c65% CO2 savings, per kg of materials, in our base case. The savings will be greater for more energy-intensive material inputs and when >80% of materials are machined away in the manufacturing process.
This data-file quantifies the CO2 savingsof additively manufactured processes versus conventional manufacturing processes in kWh/kg and kgCO2e/kg. The calculations include material costs, preparation, machining and additive manufacturing itself. Our numbers are based on technical papers.
Industrial heat comprises around 20% of global CO2 emissions, but around half of all the heat generated may ultimately be wasted. Hence, this model simplifies the economics of waste heat recovery, capturing the costs of heat exchangers at industrial facilities, based on the engineering equations of heat exchange and recent technical papers.
Different estimates place the global heat exchanger market value at around $20bn per year as of 2022, as captured in our database of market sizing.
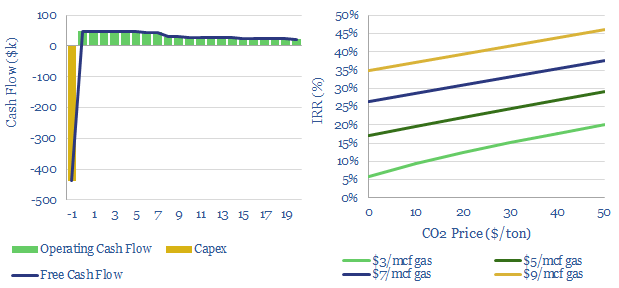
Installing a heat exchanger to capture waste heat will likely earn a 6% IRR in our base case assumptions for the US at $3/mcf natural gas.
IRRs are uplifted to above 20%, either if we assume higher gas prices ($6/mcf) or a $50/ton CO2 price. IRRs can reach 40% with both.
High IRRs may be necessary to unlock waste heat recovery. First, each project is complex, with large amounts of engineering, and implementation disrupts operations at a plant.
Second, although IRRs are high, NPVs are low, as many projects will be small-scale. For example, the NPV10 may be less than $1M on a single, small heat exchanger project, even if it achieves a 40% IRR.
The capex costs of heat exchangers are estimated at $200/m2 on average, but this varies between $100/m2 and $500/m2 depending on the thermal swing and corrosiveness of fluid streams being heat exchanged. Some systems use stainless steel and others require high grade nickel steels. Plate-fin designs are 2x more efficient than shell-tube designs.
Capex costs of heat exchangers in $ per m2
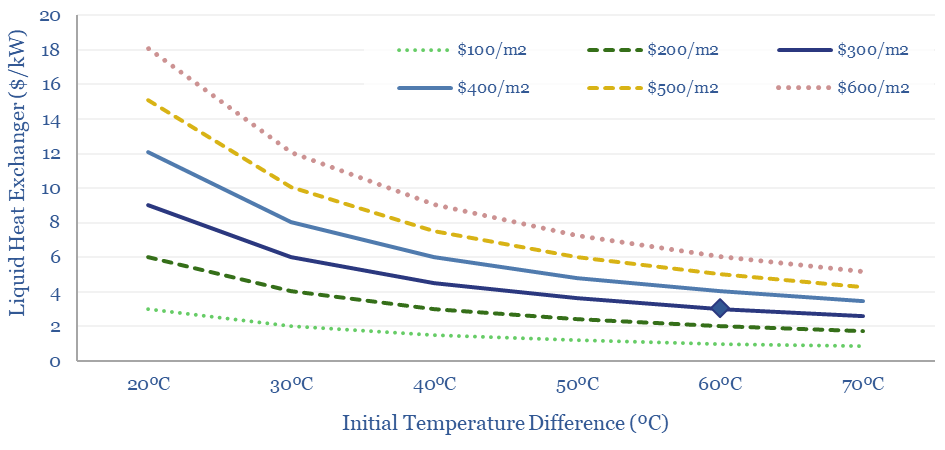
The capex costs of heat exchangers in $/kW terms are variable, and complex to calculate, but we have made an attempt in the ‘Cost Estimates’ tab. Heat exchanger cost depends on the heat transfer coefficient of the heat exchanger in kW/m2-K (which itself can vary by a factor of 200x), the size of the heat exchanger (in m2 of surface area and m3 of capacity), while the amount of heat exchange (in kW) will mostly be determined by the temperature difference of the fluids being heat-exchanged.
Capex costs of heat exchangers in $ per kW of heat exchange
The model contains a variation looking at waste heat recovery in gas-fired facilities, and another variation looking at waste-heat recovery in coal-fired facilities. Then there are backup tabs with tabulated costs for heat exchangers (in $/m2), translating $/m2 cost terms into $/kW terms, and notes from technical papers.
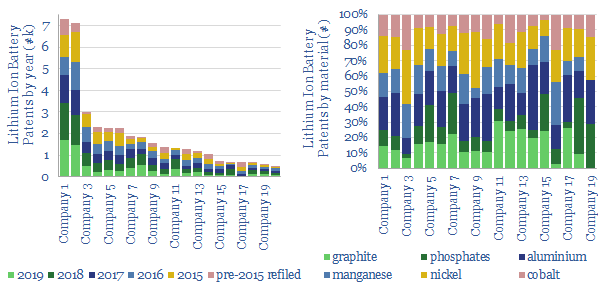
This data-file tabulates the number of patents filed into different types of batteries, by year and by geography. Hence, we have identified the patent leaders in lithium ion technology, based on 158,000 patents and the battery materials that they describe (above).
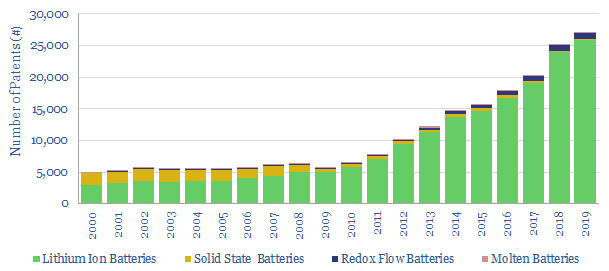
Continued cost-deflation in lithium ionis suggested by the 26,000 patents filed in 2019, which has doubled in the past 5-years (below), led by China (two-thirds of the patents). The data-file also shows a clear technology leader, while some companies are accelerating. Others are pulling back on R&D or over-concentrating on cobalt.
Competition is accelerating,making leading technologies important. We recently argued supercapacitors could be better suited for hybridizing industry and transport. Moreover, redox flow batteries are emerging as the most exciting new battery technology for grid storage, with patent activity doubling since 2014, to 894 in 2019 (also above). Hence we include notes on ESS Inc.
A descriptionof each battery type is shown in the ‘battery types’ tab. Download the data-file for a break-out of the data by country.
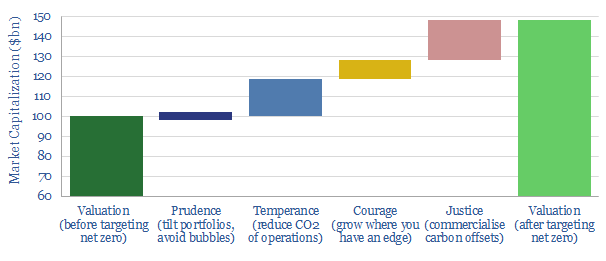
Attaining ‘Net Zero’ can uplift an Energy Major’s valuation by c50%. Specifically, this means emitting no net CO2, either from the company’s operations (Scope 1&2 emissions) or from the use of its products (Scope 3). This 19-page report shows how a Major can best achieve ‘net zero’ by exhibiting four cardinal virtues. Decarbonization is not a threat but an opportunity.
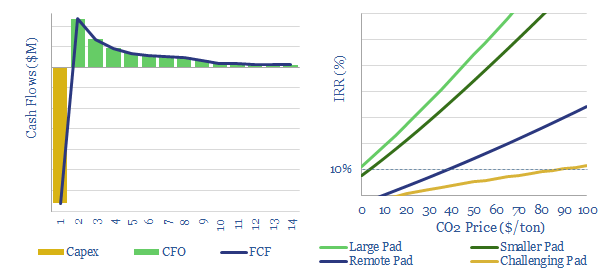
c150bcm of gas was flared globally in 2019, including 15bcm in the United States, which emitted 30MT of CO2-equivalents. This data-file simplifies the economics of flare gas capture, by gathering the gas, cleaning the gas, and compressing the gas into a regional pipeline.
Generally, double-digit returns are achievableat a large new shale pad, by capturing and commercialising associated gas rather than flaring it. Economics are more challenging at smaller pads, remote pads and for wet or contaminated gas. Economics are highly variable, site-by-site, as can be stress-tested in the model.
Carbon prices would dramatically improve the economicsof capturing flare gas. A c$40/ton CO2 price would incentivize capturing gas from the majority of remote pads, while it would unlock c40-50% IRRs on flare gas capture from large pads, a very expensive opportunity cost for any operator to ignore. As a rough estimate, a $100/ton CO2 price could eliminate flaring in the US, subject to pipeline availability.
Please download the data file to stress test our numbers for flare gas capture. Our conclusions from this analysis are summarised in the article sent to our distribution list here, along with our related report discussing the improvements within oil and gas from a CO2 price.
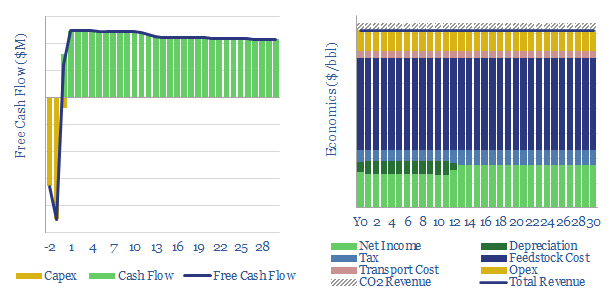
Our aim of this model is to capture the economics of different green diesel plants: specifically, converting waste oils into renewable diesel via hydro-processing; and converting biologically derived oils into bio-diesel via trans-esterification.
Our base case is that a US renewable diesel facility must achieve $4.6/gallon sales revenues (which is c$200/bbl) as it commercializes a product with up to 75% lower embedded emissions than conventional diesel.
Similarly, a US bio-diesel facility must achieve $3.6/gallon sales revenue (which is c$150/bbl) as it commercializes a product with around 60% lower embedded emissions than conventional diesel. A detailed breakdown of biodiesel CO2 intensity is also included in the model.
The models are most sensitive to input feedstock prices, then conversion efficiencies, and only secondarily to other cost lines. Detailed cost data are broken out from companies, projects and technical papers.
Our notes from technical papers are also captured in the data-file. Economics can be disaggregated as a function of feedstocks, feedstock:product ratios, heat inputs, gas prices, electricity consumption per gallon, electricity prices, utilization rates, capex costs, other opex costs, tax rates and other reagents (e.g., hydrogen, methanol, sodium hydroxide, hydrochloric acid, etc)..
Capex costs are estimated on both a top-down and a bottom-up basis. The average greenfield is costing around $30M/kbpd (details in the data-file), while have also disaggregated typical costs over 25 different input lines.
To read more about our conclusions on renewable diesel economics versus carbon credits, please see our article here. For our outlook on meeting renewable diesel expansion targets see here.
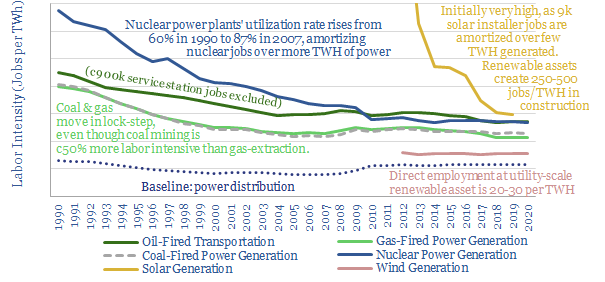
How many jobs are created by different types of energy? This data-file aggregates the labor intensityof different energy sources: wind, solar, oil, gas, coal and nuclear, based on data from the United States and from underlying projects.
Direct labor intensity of different energy sources tends to vary between 75-150 workers per TWH of useful energy. The gas industry is among the most efficient power sectors, providing 100 jobs per TWH of useful energy. Oil-fired transportation is less efficient at 135 workers per TWH, rising to 730 per TWH if you include service station staff.
Renewables have a jagged profile. A typical wind and solar project creates 250-500 jobs per TWH during the construction phase, but only just 20-30 during the operational phase. So in the short-run, jobs may be created by expanding renewables but in the long-run, they may be destroyed.
One observation is that different stakeholders often have different ambitions over labor intensity of different energy sources. Investors and consumers often prefer less labor-intensive projects, as they are more economical. However policymakers see to prefer more labor-intensive projects, in order to promote employment.
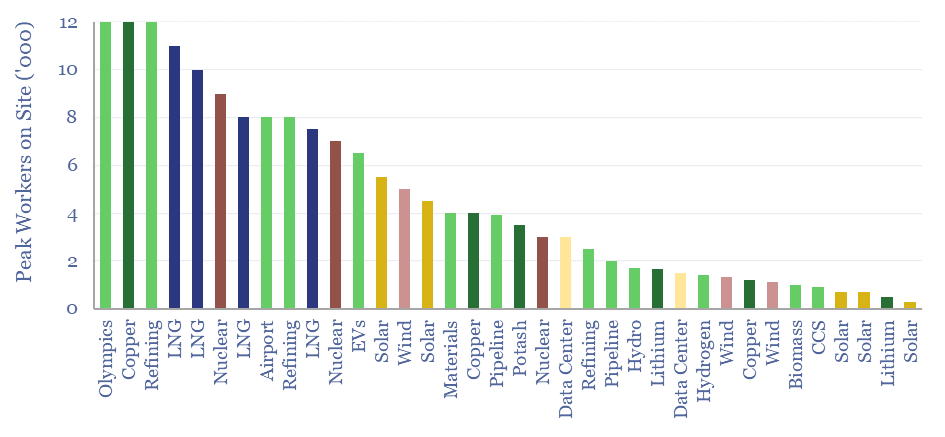
The peak number of workers on site is plotted for 35 large projects across the energy, materials and infrastructure sectors, as a further useful reference in this data-file. For example, constructing the London Olympics required 12,000 workers at peak, while constructing Heathrow Terminal 5 used 8,000 workers at peak. Similar numbers can be calcualted for LNG projects, large-scale wind, solar, pipelines, CCS and mining projects.
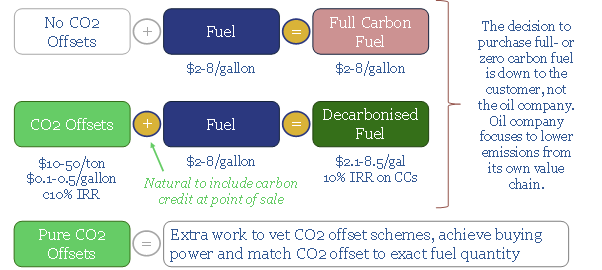
Fuel retailers have a game-changing opportunity seeding new forests. They could offset c15bn tons of CO2 per annum, enough to accommodate 85Mbpd of oil and 400TCF of annual gas use in a fully decarbonized energy system. The cost is competitive, well below c$50/ton. It is natural to sell carbon credits alongside fuels and earn a margin on both. Hence, we calculate 15-25% uplifts in the value of fuel retail stations, allaying fears over CO2, and benefitting as road fuel demand surges after COVID.
Cookies?
This website uses necessary cookies. Our cookies are simply to improve your experience. We do not undertake any advertising or targeting via our cookies. By clicking 'accept' or continuing to use the website, you consent to our use of cookies.AcceptRead More
Privacy & Cookies Policy
Privacy Overview
This website uses cookies to improve your experience while you navigate through the website. Out of these, the cookies that are categorized as necessary are stored on your browser as they are essential for the working of basic functionalities of the website. We also use third-party cookies that help us analyze and understand how you use this website. These cookies will be stored in your browser only with your consent. You also have the option to opt-out of these cookies. But opting out of some of these cookies may affect your browsing experience.
Necessary cookies are absolutely essential for the website to function properly. This category only includes cookies that ensures basic functionalities and security features of the website. These cookies do not store any personal information.
Any cookies that may not be particularly necessary for the website to function and is used specifically to collect user personal data via analytics, ads, other embedded contents are termed as non-necessary cookies. It is mandatory to procure user consent prior to running these cookies on your website.