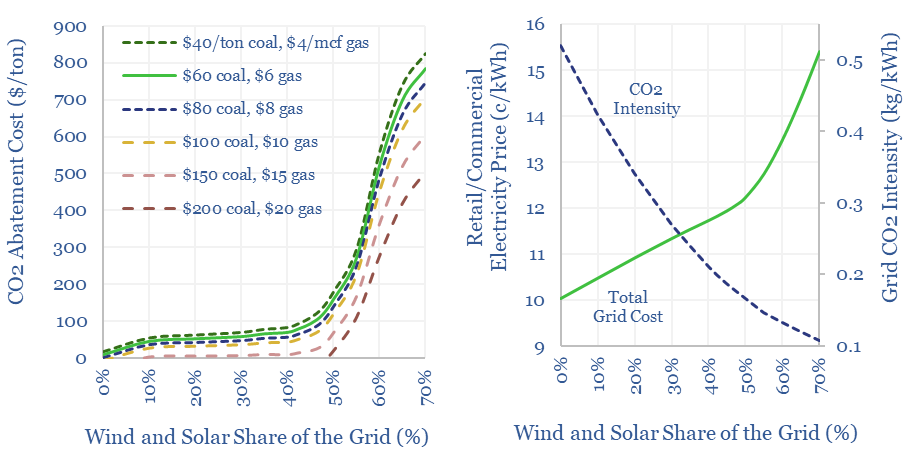
The costs of decarbonizing by ramping up solar and wind depend on the context. But our best estimate is that solar and wind can reach 40% of the global grid for a $60/ton average CO2 abatement cost. This is a relatively low cost. Yet it still raises retail electricity prices from 10c/kWh to 12c/kWh. This 7-page note explores numbers and implications.
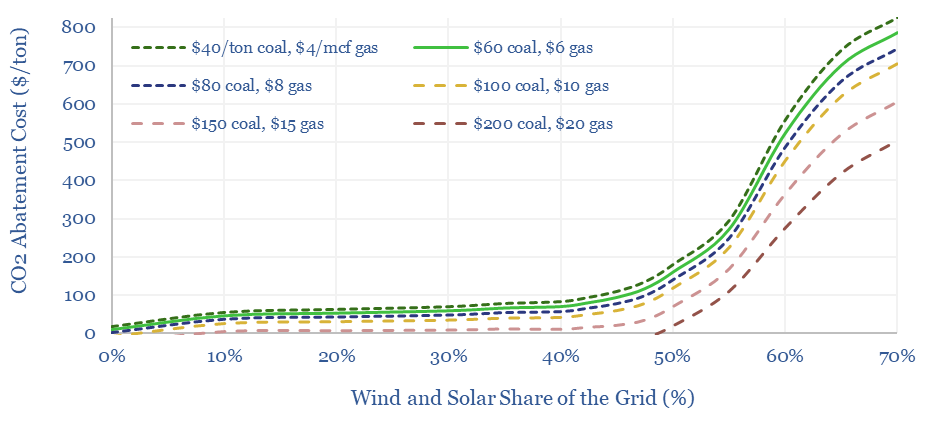
The costs of decarbonizing by ramping up solar and wind are highly dependent on context. The purpose of this data-file is to enable stress-testing of the CO2 abatement costs of renewables, in different contexts and at different grid penetrations. Our own estimate is that solar and wind can reach 40% of the global grid for a $60/ton average CO2 abatement cost of wind and solar.
Thunder Said Energy is a research firm focused on energy technologies and energy transition. In our roadmap to net zero, we have plotted hundreds of different options on a cost curve, according to their CO2 abatement cost, i.e., what is the cost in $/ton to remove each ton of CO2 from the global energy system?
The costs of wind and solar are often quoted in c/kWh terms, but what is their cost in CO2 abatement terms, i.e., in $/ton of CO2 avoided. We have written a research note (below) aiming to answer this question and this data-file contains the underlying modelling.
The CO2 abatement costs of solar and wind are highly context-dependent. For example, a utility scale solar assets that prevents having to build a new diesel genset has deeply negative CO2 abatement cots, while new offshore wind farm that displaces a fully depreciated nuclear plant has a CO2 abatement cost of infinity!
This data-file enables stress-testing of the CO2 abatement costs of solar and wind. The proper way to calculate this is on a total grid basis, dividing the total change in the cost of the grid (in c/kWh) by the total change in the CO2 intensity of the grid (in kg/kWh) and then juggling the units.
Calculating CO2 abatement costs of renewables in this way is necessary, because otherwise the numbers will not reflect the CO2 intensity of what is being displaced, falling grid utilization, rising curtailment rates and the concomitant rise in total grid costs.
In the model, you can also flex your assumed costs and grid shares for wind, solar, hydro, nuclear, gas and coal, the share of displaced generation that is assumed to be ully depreciated versus greenfield, and the rise in transmission costs associated with increasing renewables.
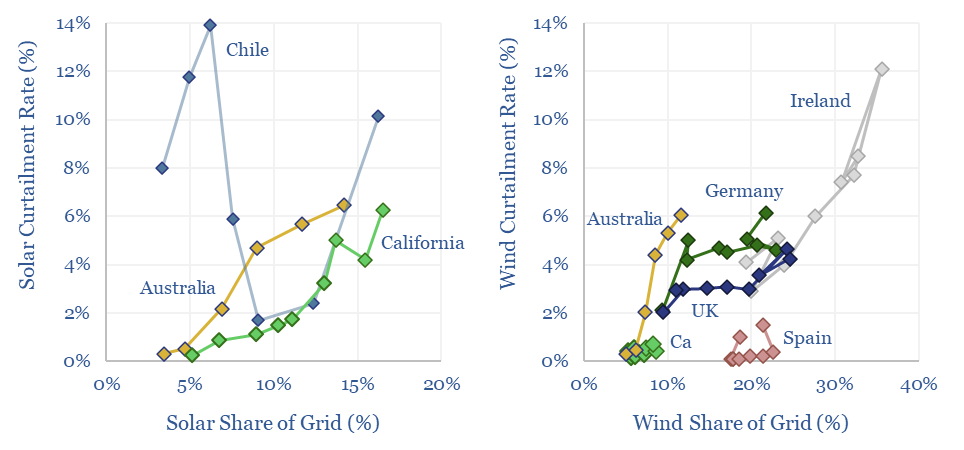
Wind and solar curtailments average 5% across different grids that we have evaluated in this data-file, and have generally been rising over time, especially in the last half-decade. The key reason is grid bottlenecks. Grid expansions are crucial for wind and solar to continue expanding.
Curtailments occur when wind and solar are capable of generating electricity, but operators cannot dispatch that electricity into the grid.
This data-file tabulates curtailment rates in California, Australia, the UK, Germany, Spain, Chile and Ireland, averaging c5% in 2022.
The main reason for curtailment is bottlenecks in the grid — i.e., moving renewables from points of generation, to points of unmet demand — rather than renewables having saturated total grid demand.
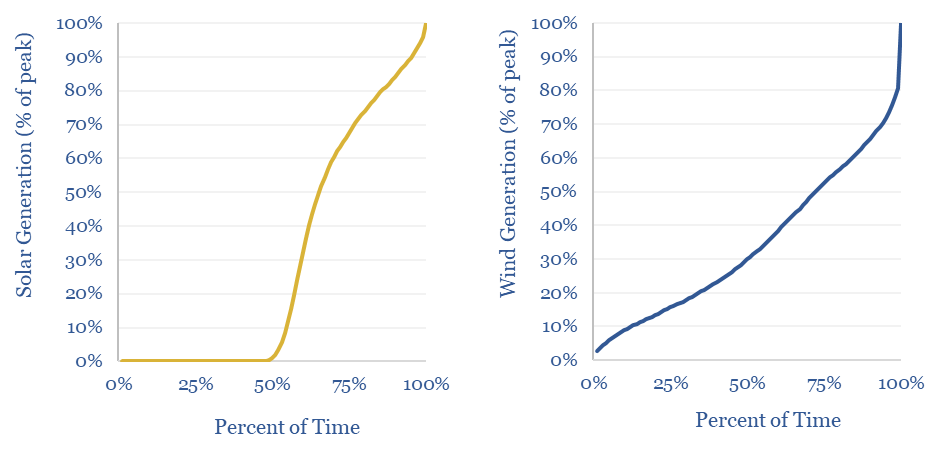
In a recent research report into the ultimate share of renewables in power grids, we calculated that based on their statistical distributions, solar would only start meeting 100% of a grid’s total demand around 1% of the time when solar was providing c30% of the total grid, while wind would only start meeting 100% of a grid’s total demand around 1% of the time when wind was providing 40% of the total grid (see below). We are not at these levels yet, in the countries in this sample.
The bottleneck is power grids. You might have a 100MW grid,composed of 10 x 10MW inter-connected nodes, and the issue causing curtailment is trying to flow 20MW through a 10MW node.
This confirms that meeting the theoretical potential of renewables (per the note above) requires vast grid expansion, and indeed, countries that have seen YoY reductions in curtailment rates have often achieved this by building new interconnectors.
Second, it gives a new lens on energy storage. Battery deployments can absorb low-cost renewables and prevent curtailment, by circumventing grid bottlenecks, especially for renewables developers who fear bottlenecks in the grid will be persistent.
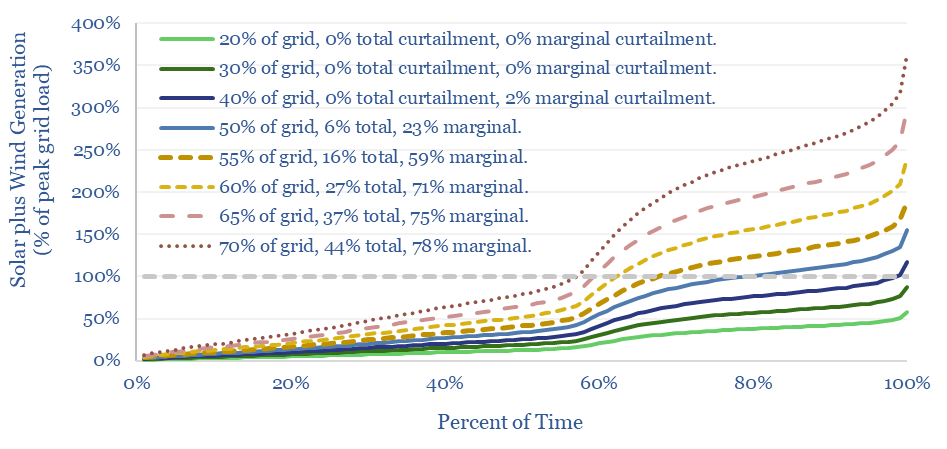
Wind and solar peak at 50-55% of power grids, without demand-shifting or storage, before their economics become overwhelmed by curtailment rates and backup costs. More in wind-heavy grids. Less in solar heavy grids. This 12-page note draws conclusions from the statistical distribution of renewables’ generation across 100,000 x 5-minute grid intervals.
This data-file aggregates wind and solar statistical distributions, plotting solar generation and wind generation, every 5-minutes, across California, for the entirety of 2022, in order to understand their volatility and curtailment rates. The data suggest that wind and solar will most likely peak at 50-55% of renewables-heavy grids.
How will ramping up wind and solar increase volatility of other generation sources, lower the utilization rates of the overall grid, and where will wind and solar naturally peak?
We can answer these questions by evaluating 100,000 x 5-minute intervals of power generation, from California’s power grid in 2022, then calculating the statistical distributions of wind, solar and total demand.
As always, we publish the data behind our analysis, to give transparency on the methodology, and assumptions can be stress-tested.
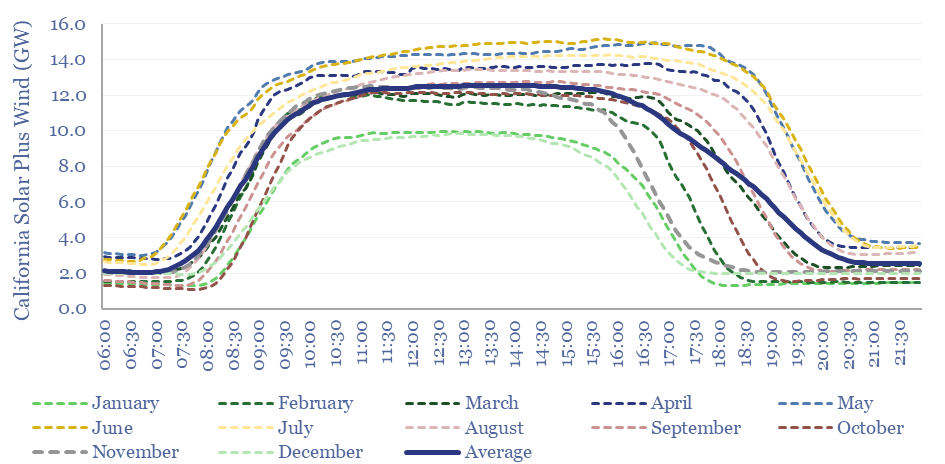
Tabs ending _Averages plot the average load across different five-minute intervals, across the year, showing wind and solar statistical distributions, and how they vary throughout the day, in different months.
Tabs ending _DitsributionFlex plot the distribution of each time series, by percentile, across the entire year.
The analysis then asks: if the future distribution matches today’s distribution, how much of a hypothetical ‘constant’ grid load could wind, solar and wind+solar supply, at different curtailment thresholds.
If we assume that supply will stop growing when marginal capacity additions are likely to incur 30-60% curtailment rates, this suggests that solar would most likely peak out at 35-40% of a grid, wind would most likely peak out at 60-70% of a grid, while a mixture of wind and solar would most likely peak out at 50-55% of a grid.
Please see our broader research into power grids, into California’s grid and for similar statistical analysis of wind generation elsewhere, we have run similar analysis for the UK power grid.
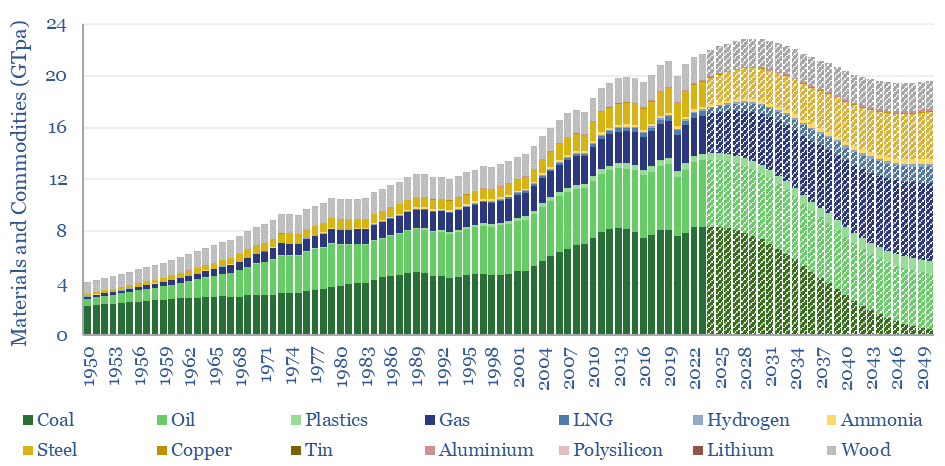
This 15-page note evaluates 10 commodity disruptions since the Stone Age. Peak demand for commodities is just possible, in total tonnage terms, as part of the energy transition. But it is historically unprecedented. And our plateau in tonnage terms is a doubling in value terms, a kingmaker for gas and materials. 30 major commodities are reviewed.
Thermal energy storage will outcompete other batteries and hydrogen for avoiding renewable curtailments and integrating more solar? Overlooked advantages are discussed in this 21-page report, plus a fast-evolving company landscape. What implications for solar, gas and industrial incumbents?
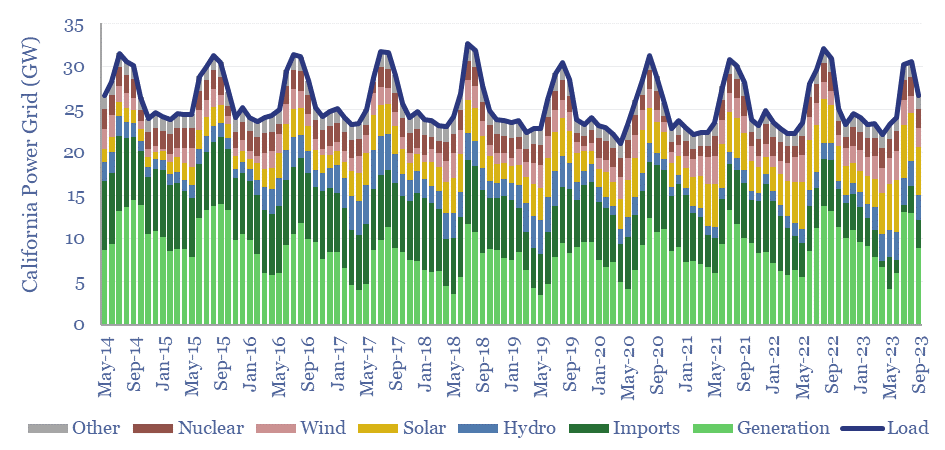
California’s power grid ranges from 15-61GW of demand. Utility scale solar has almost quadrupled in the past decade, rising from 5% to almost 20% of the grid. Yet it has not displaced thermal generation, which rose from 28% to 36% of the grid. We even wonder whether wind and solar are entrenching natural gas generators that can backstop their daily, weekly and even seasonal volatility.
This data-file aggregates descriptive statistics into California’s power grid, plotting California power generation over time, looking across 150MB of CAISO data into solar, wind, nuclear, hydro, imports and thermal generation, every five minutes, for almost a decade.
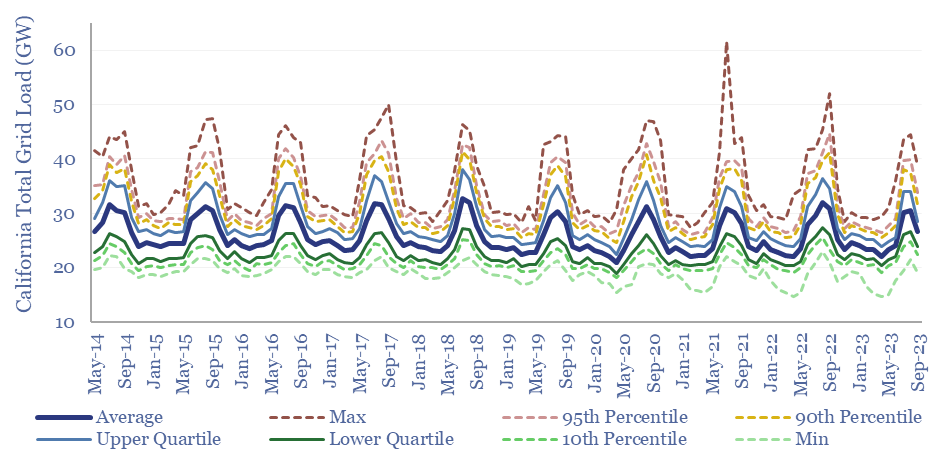
Over the past decade, California’s power grid has averaged 26GW of load, but the demand is highly variable, troughing at 15GW in April-2022 and peaking at over 61GW in July-2021. Summer demand is almost 50% higher than winter demand due to air conditioning.
California Power Grid Descriptive Statistics Average Load, Minimum, Maximum and Quartiles
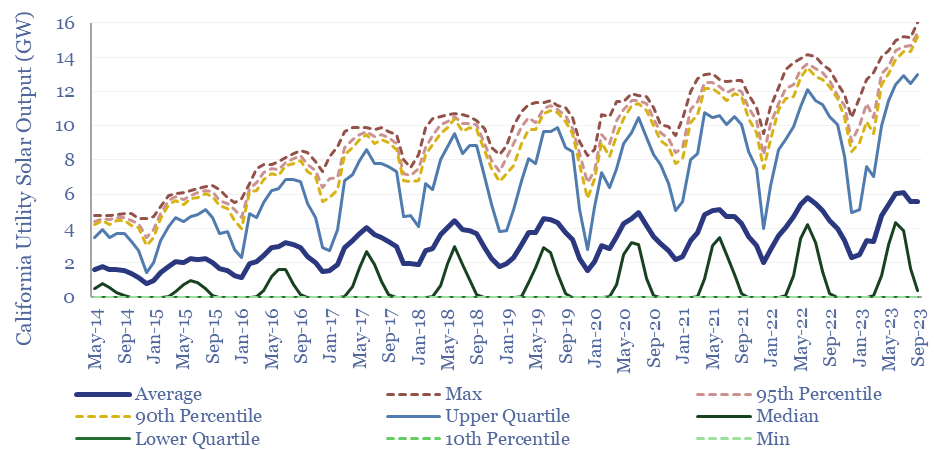
Utility-scale solar is the biggest change in the generation mix, rising from 5% of the grid to almost 20% of the grid over the past decade. Solar generation is volatile. The average load from solar was 4GW in the trailing twelve months, but c40% of the time, solar generation is zero, while 25% of the time it is above 10GW and 5% of the time it is above 13GW.
California Utility-Scale Solar Generation Over Time in GW
Seasonality also matters for solar. Solar generates around 2x higher output during the summer months than the winter months. Similar charts for wind are in the data-file.
Thermal generation has not necessarily been displaced by the rise of solar and wind in California’s grid, but arguably, entrenched, as gas-fired power plants can rapidly ramp up production, after the sun sets, or in non-sunny months.
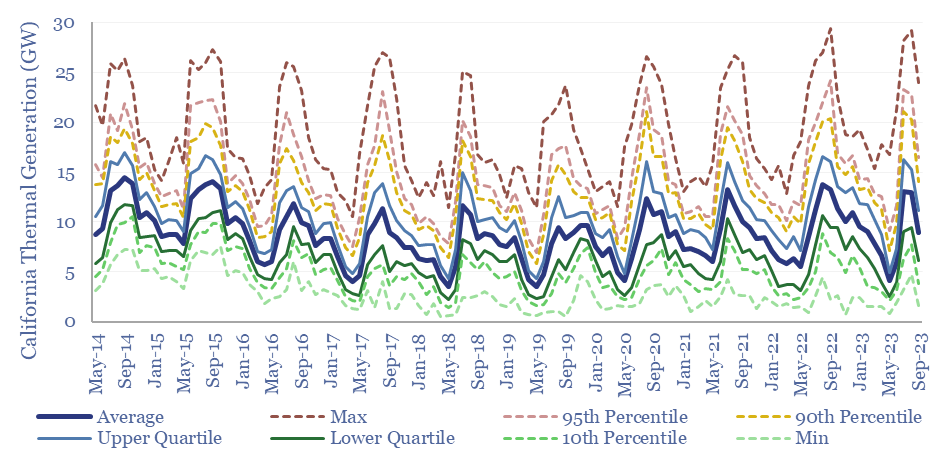
Total thermal generation has actually risen from 28% of the grid in 2017 to 36% of the grid in 2023, albeit the picture is somewhat distorted by annual fluctuations in hydro output and the change in imports, tabulated in the data-file.
California Thermal Generation Over Time in GW
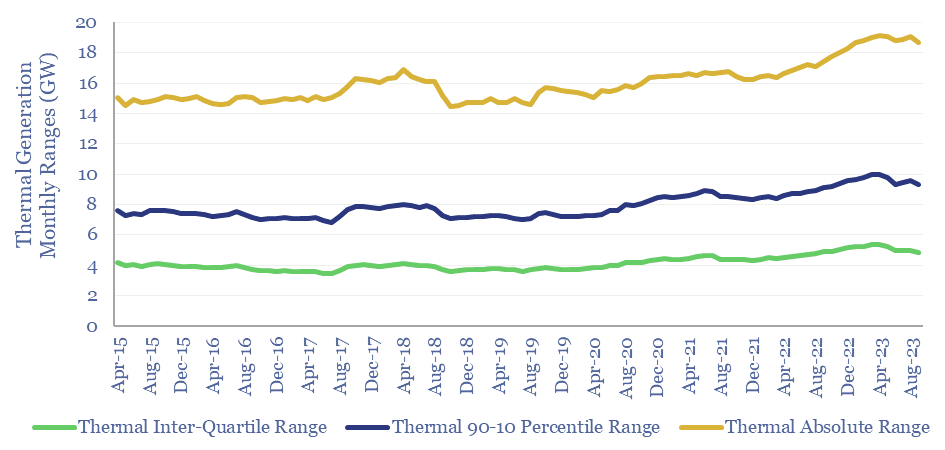
Is California’s thermal generation base backstopping its renewables? There is also evidence of thermal generation plants being run more flexibly, to ‘backstop’ solar and wind in California’s grid, with rising interquartile ranges, absolute ranges and deviations between upper-decile and lower-decile generation.
Thermal Generation Monthly Ranges
Full descriptive statistics are in the data-file, covering all of California’s main generation sources — solar, wind, nuclear, hydro, imports and thermal — and the proportionate share of each one. For each month, we plot each generation source’s minimum output, 10th percentile, lower quartile, median, mean, upper quartile, 90th percentile and maximum output.
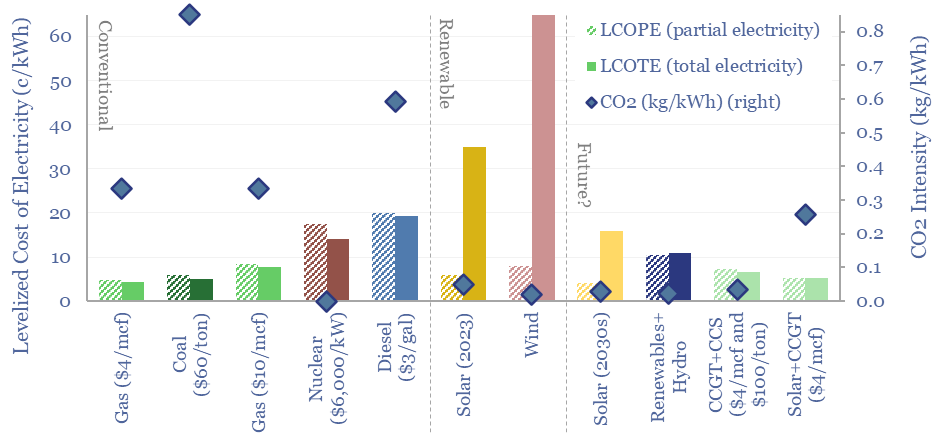
The levelized cost of partial electricity (LCOPE) is very different from the levelized cost of total electricity (LCOTE). This 21-page note explores the distinction. It suggests renewables will peak at 30-60% of power grids? And gas is well-placed as a back-up, set to surprise, by entrenching at 30-50% of renewables-heavy grids?
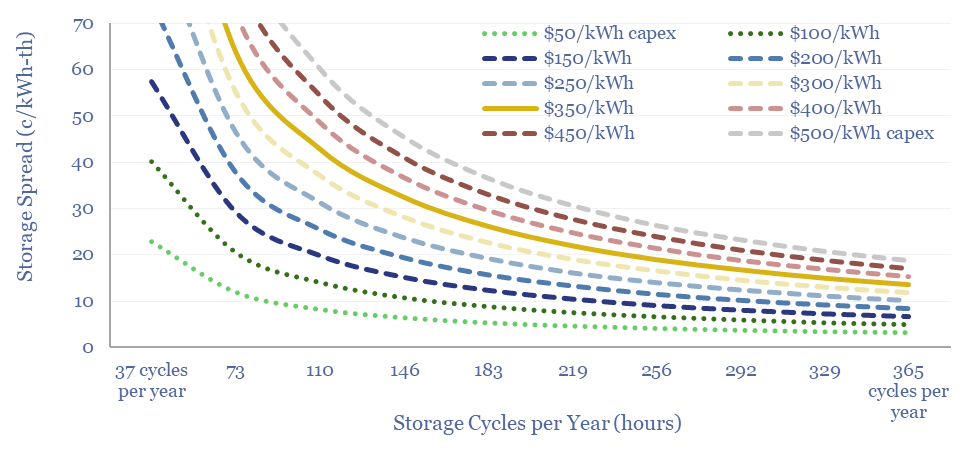
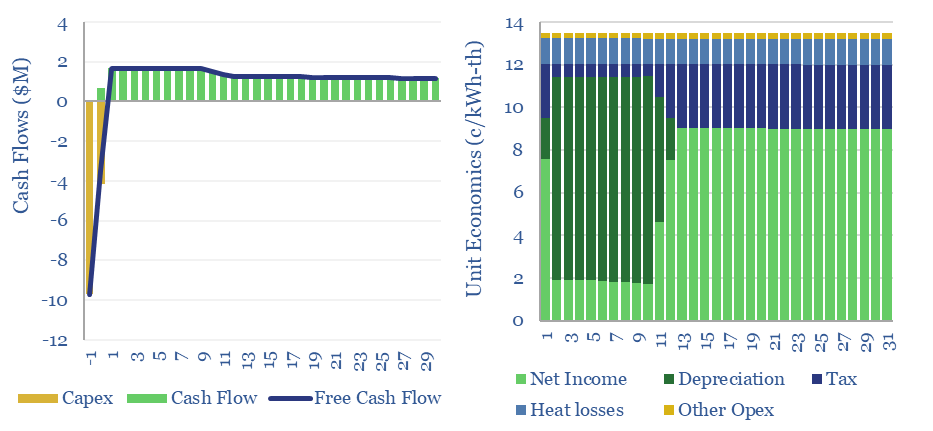
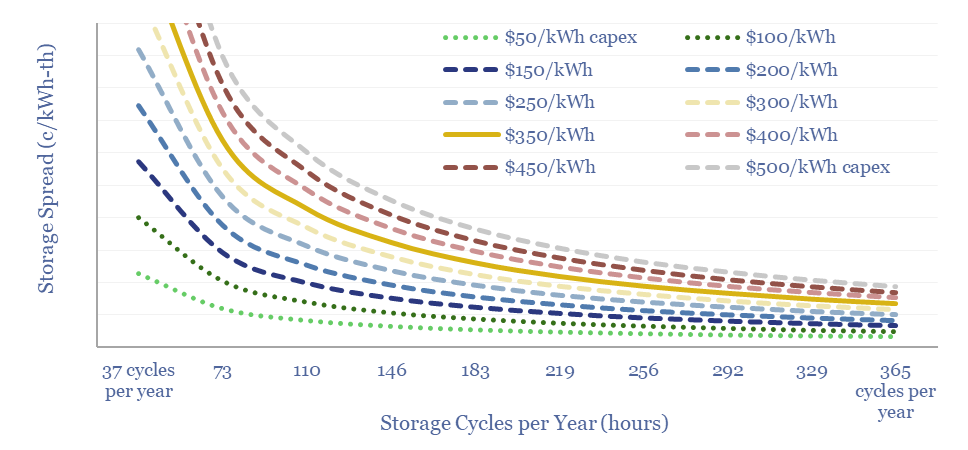
This data-file captures the costs of thermal energy storage, buying renewable electricity, heating up a storage media, then releasing the heat for industrial, commercial or residential use. Our base case requires 13.5 c/kWh-th for a 10% IRR, however 5-10 c/kWh-th heat could be achieved with lower capex costs.
Thermal energy storage solutions aim to help integrate solar and wind into power grids, by absorbing excess generation that would otherwise be curtailed, and then re-releasing the heat later when renewables are not generating.
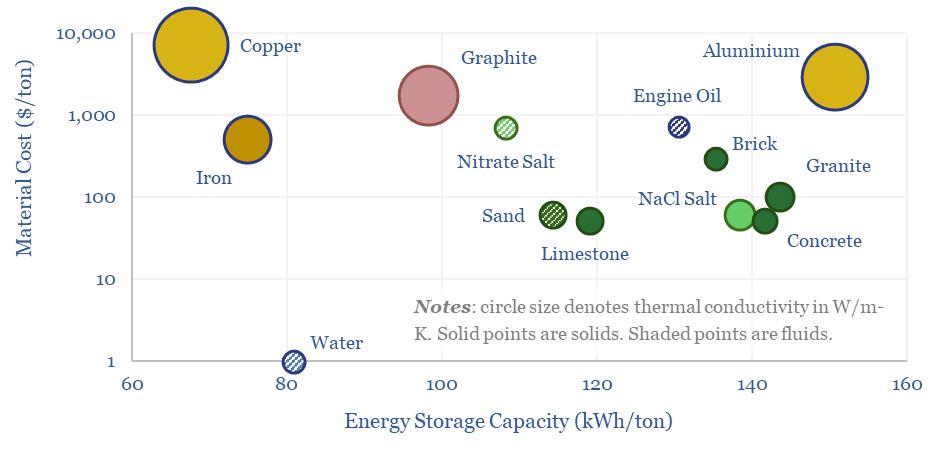
Different storage media are compared in one of the back-up tabs of the model. However, one-third of the companies in our thermal energy storage company screen are pursuing molten salt systems, hence our thermal energy storage model focuses on this option.
In our base case, the cost of thermal energy storage requires a storage spread of 13.5 c/kWh for a 10MW-scale molten salt system to achieve a 10% IRR, off of $350/kWh of capex costs. Costs are sensitive to capex, utilization rates, opex, electricity prices and round trip losses. The sensitivities can be stress tested in the data-file.
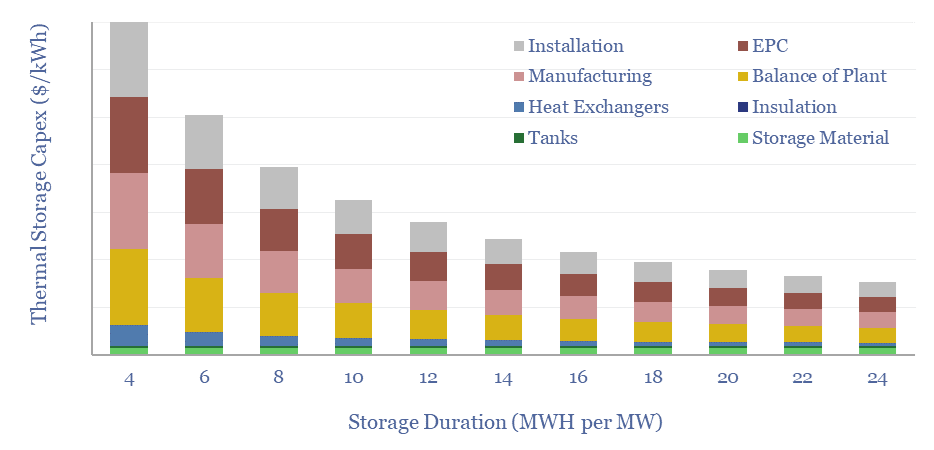
Capex costs of thermal energy storage may be reduced below our base case estimate, which has been built-up using the same input assumptions as our broader battery cost models. Larger systems require proportionately more storage material, larger tanks, and more insulation. But other lines in the capex build up do not change, and hence these costs deflate in MWH-terms.
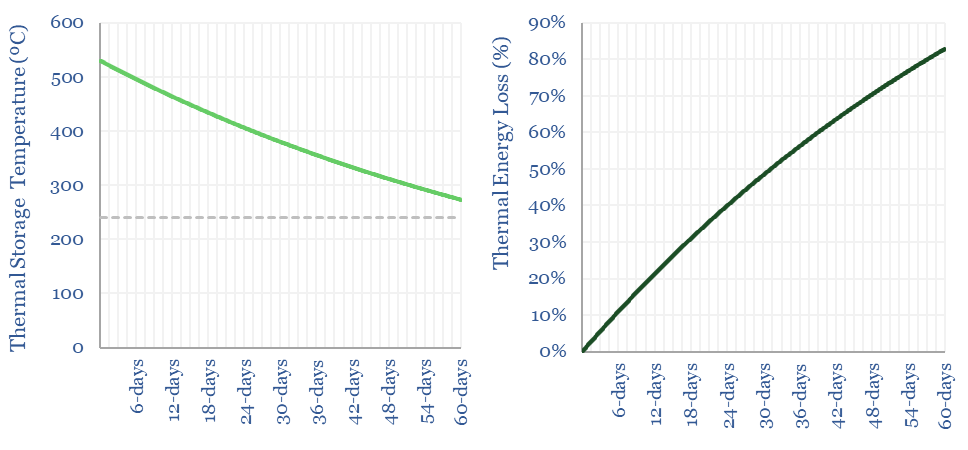
The round-trip efficiency of thermal energy systems can also be higher than we might have naively expected, possibly in the range of 85-95%. The physics is modeled from first principles in other back-up tabs of the data-file. As a generalization, a large and well-insulated thermal energy storage system loses 1-2% of its stored heat over the course of 24-hours.
The full data-file contains the workings behind our recent deep-dive into thermal energy storage. We have also included similar estimates for residential-scale storage, adding an electrically heated hot water tank to absorb excess renewables, which looks simple and can be highly economical. Please download the data-file to stress test all of our numbers.
Cookies?
This website uses necessary cookies. Our cookies are simply to improve your experience. We do not undertake any advertising or targeting via our cookies. By clicking 'accept' or continuing to use the website, you consent to our use of cookies.AcceptRead More
Privacy & Cookies Policy
Privacy Overview
This website uses cookies to improve your experience while you navigate through the website. Out of these, the cookies that are categorized as necessary are stored on your browser as they are essential for the working of basic functionalities of the website. We also use third-party cookies that help us analyze and understand how you use this website. These cookies will be stored in your browser only with your consent. You also have the option to opt-out of these cookies. But opting out of some of these cookies may affect your browsing experience.
Necessary cookies are absolutely essential for the website to function properly. This category only includes cookies that ensures basic functionalities and security features of the website. These cookies do not store any personal information.
Any cookies that may not be particularly necessary for the website to function and is used specifically to collect user personal data via analytics, ads, other embedded contents are termed as non-necessary cookies. It is mandatory to procure user consent prior to running these cookies on your website.