This data-file provides an overview of energy economics, across 175 different economic models constructed by Thunder Said Energy, in order to put numbers in context. This helps to compare marginal costs, capex costs, energy intensity, interest rate sensitivity, and other key parameters that matter in the energy transition. Our top five facts follow below.
This data-file model provides summary economic ratios from our different economic models across conventional fuels, conventional power, renewables, lower-carbon fuels, manufacturing processes, infrastructure, transportation and nature-based solutions.
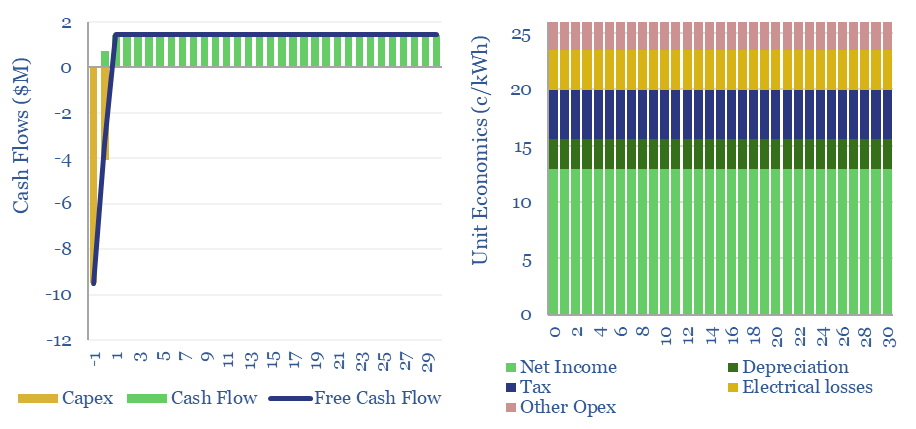
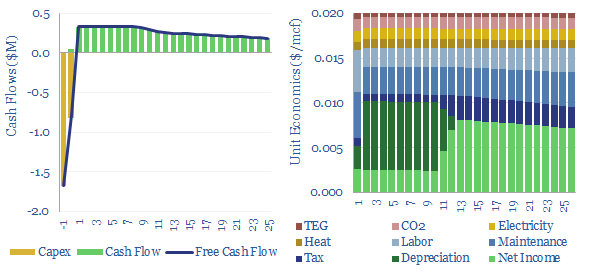
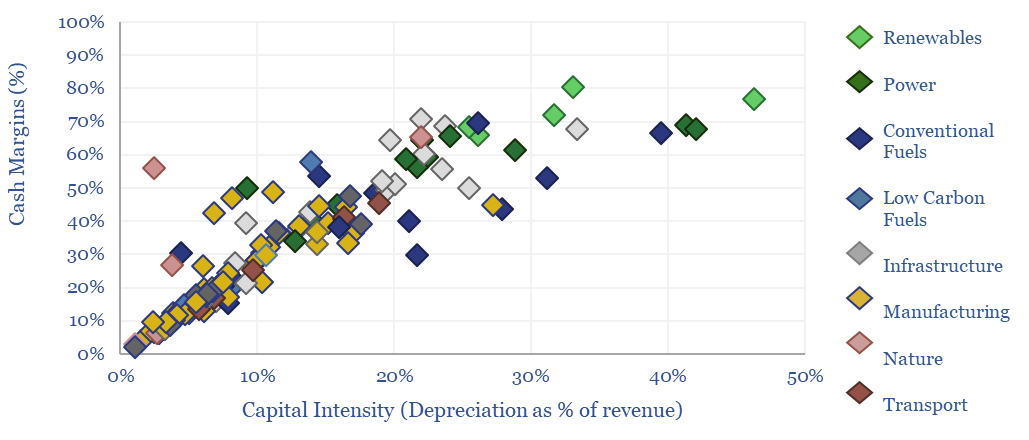
For example, EBIT margins range from 3-70%, cash margins range from 4-80% and net margins range from 2-50%, hence you can use the data-file to ballpark what constitutes a “good” margin, sub-sector by sub-sector; and to screen different industries, according to the capital intensity, opex costs and resultant profitability (chart below).
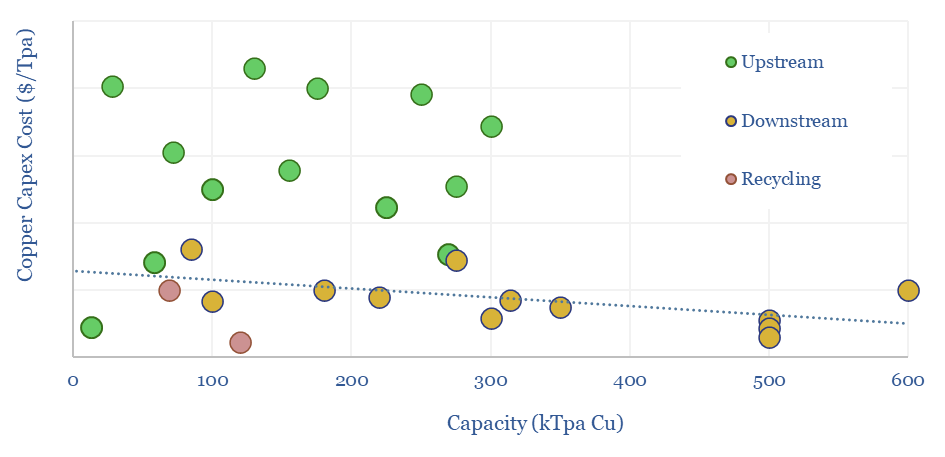
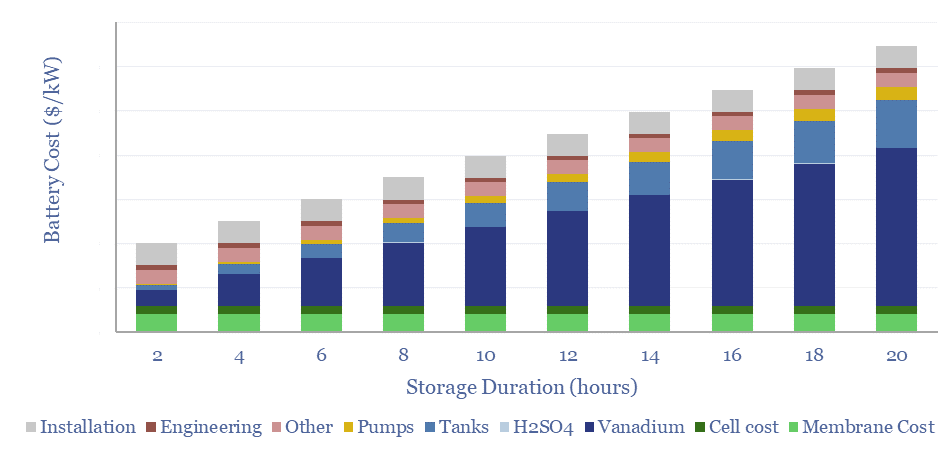
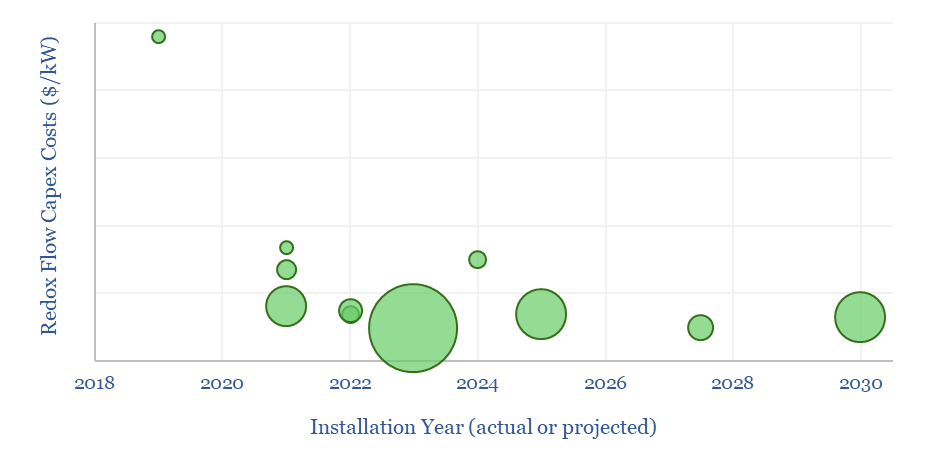
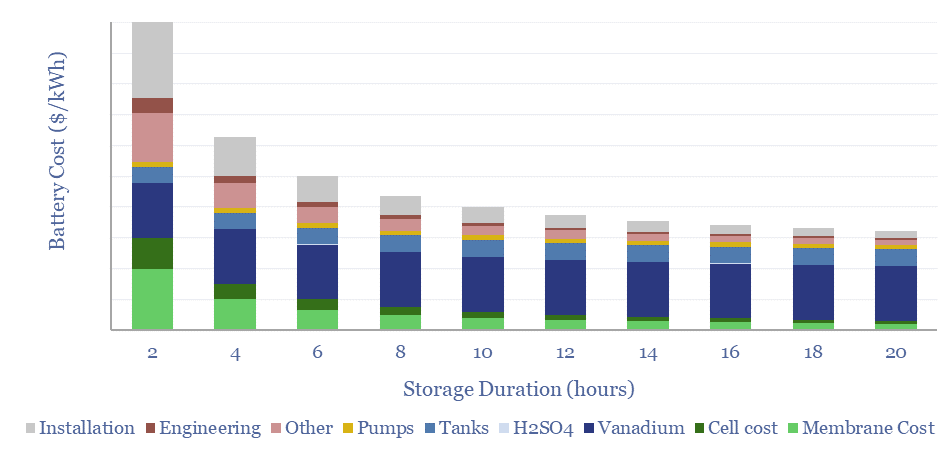
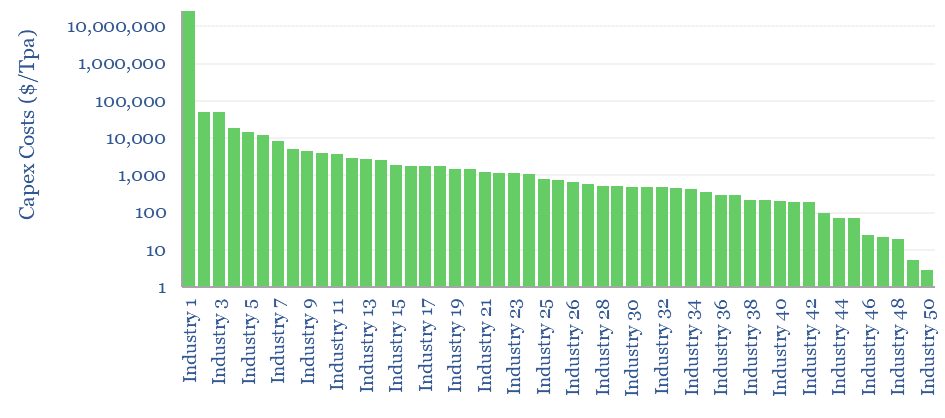
Capital intensity ranges from $300-9,000kWe, $5-7,500/Tpa and $4-125M/kboed. So if you are trying to ballpark a cost estimate you can compare it with the estimated costs of other processes. The median average industry has a capex cost of $750/Tpa (chart below).
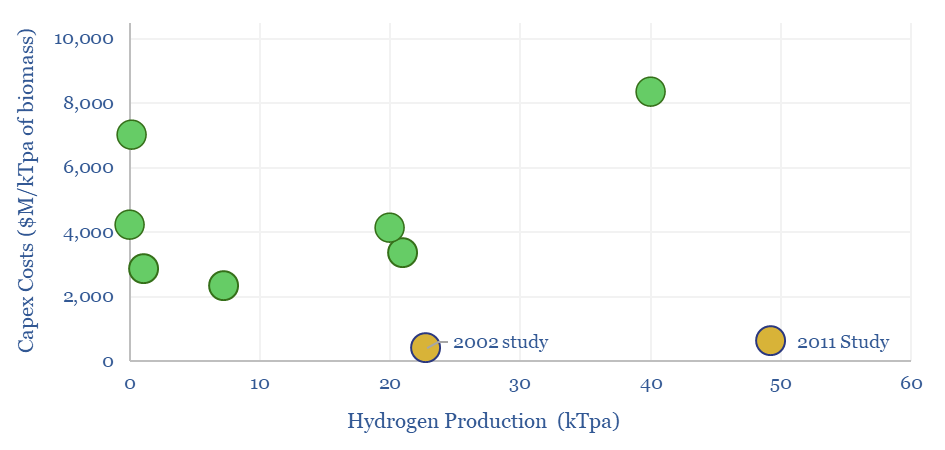
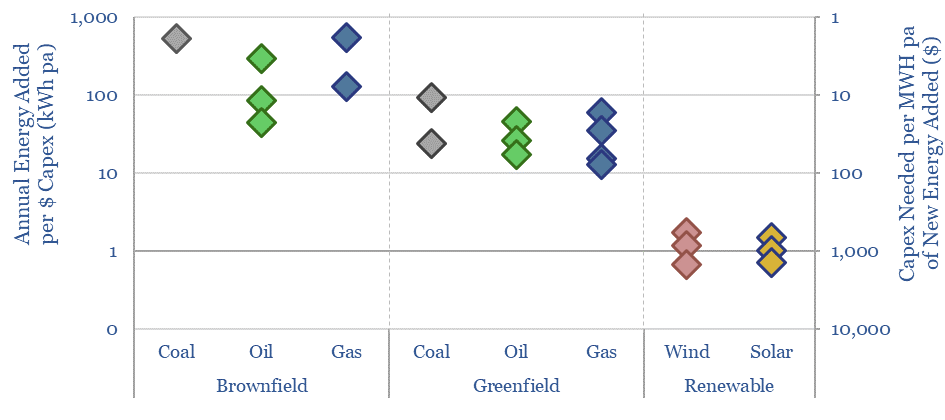
Capital intensity of different energy sources also varies by an order of magnitude (chart below). Each $1 dollar that is disinvested from new hydrocarbon capex ideally needs to be replaced by $25 invested in wind and solar, in order to add the same amount of primary energy to the global energy system (chart below, note here).
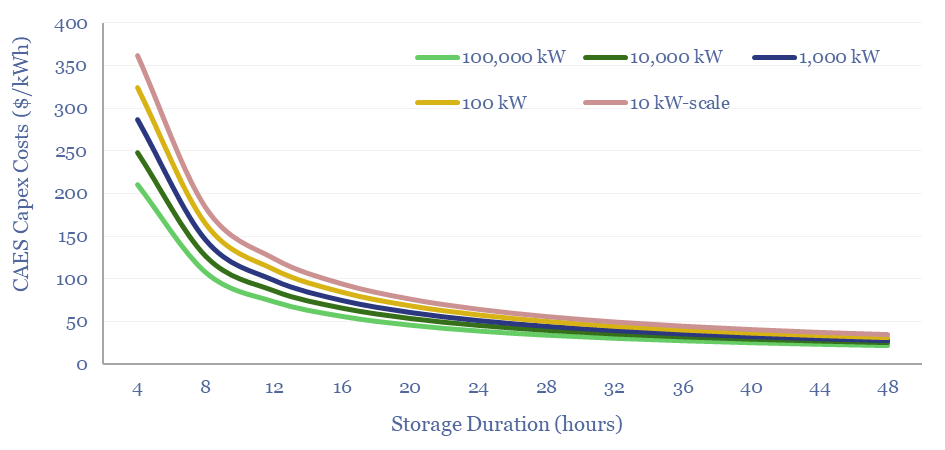
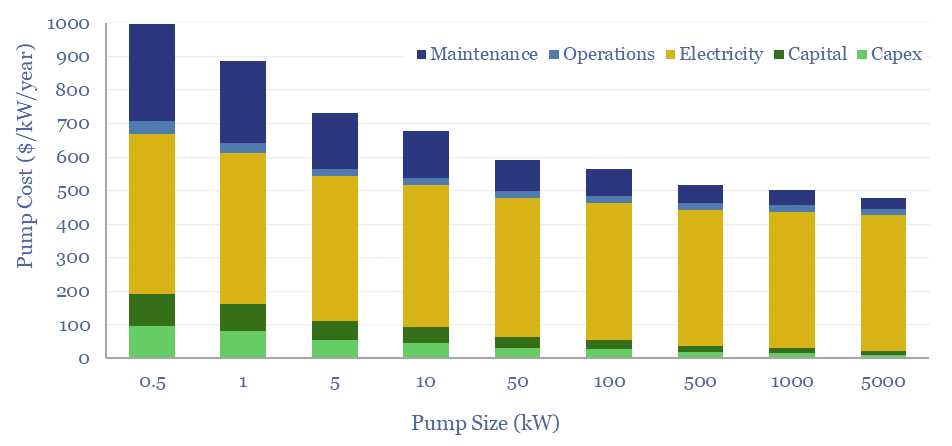
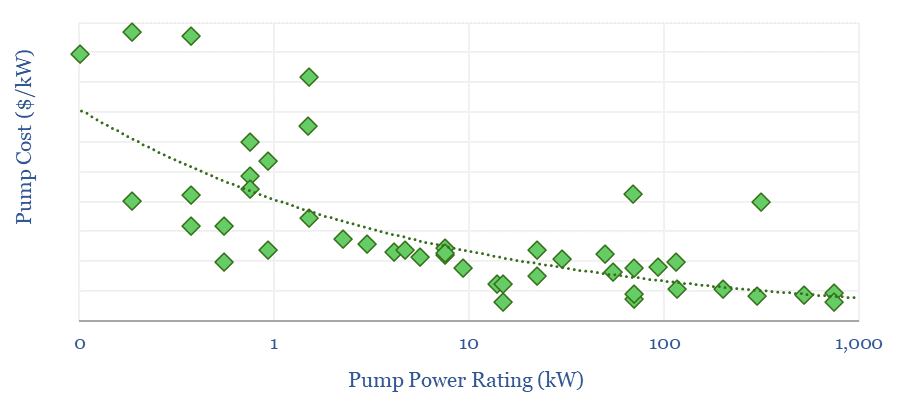
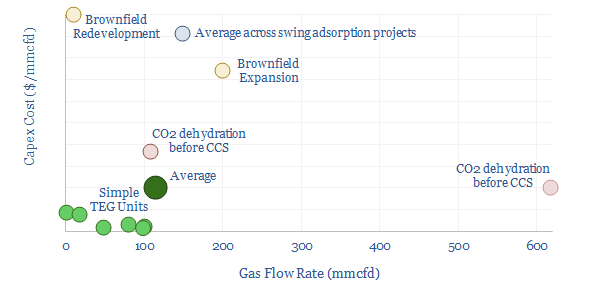
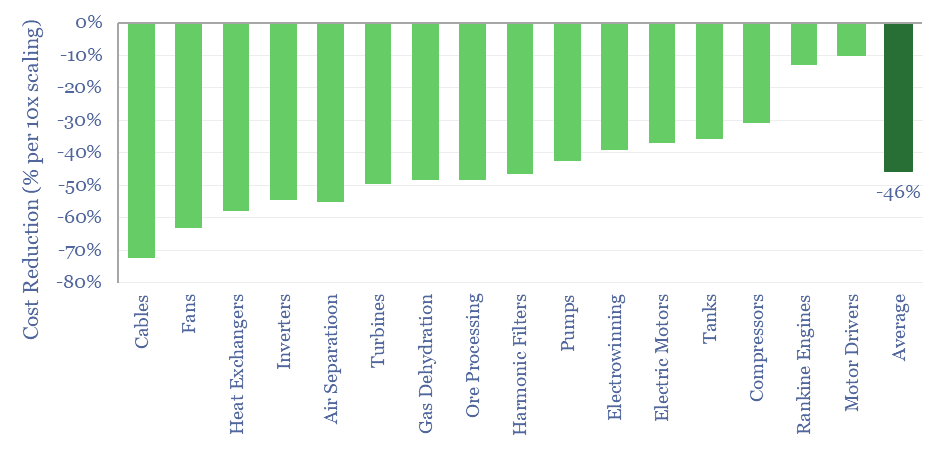
Economies of scale are visible in the data-file, across our models of Air Separation, Cables, Comminution, Compressors, Electric Motors, Electrowinning, Fans, Flotation, Gas Dehydration, Harmonic Filters, Heat Exchangers, Inverters, Motor Drivers, Pumps, Rankine Engines, Tanks and Turbines. Generally, making these units 10x larger reduces their unit costs by around 45%.
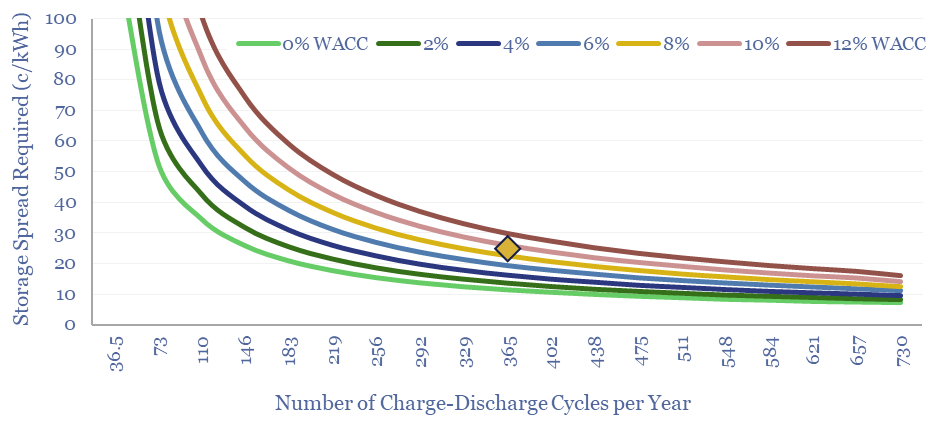
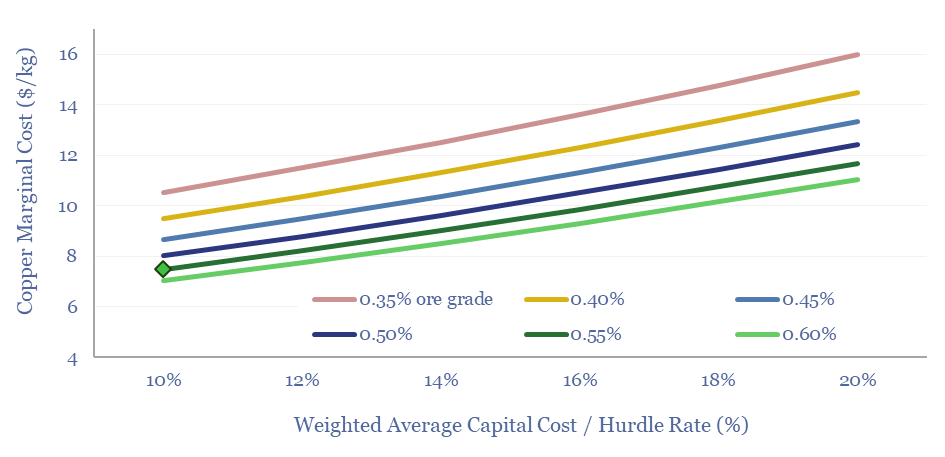
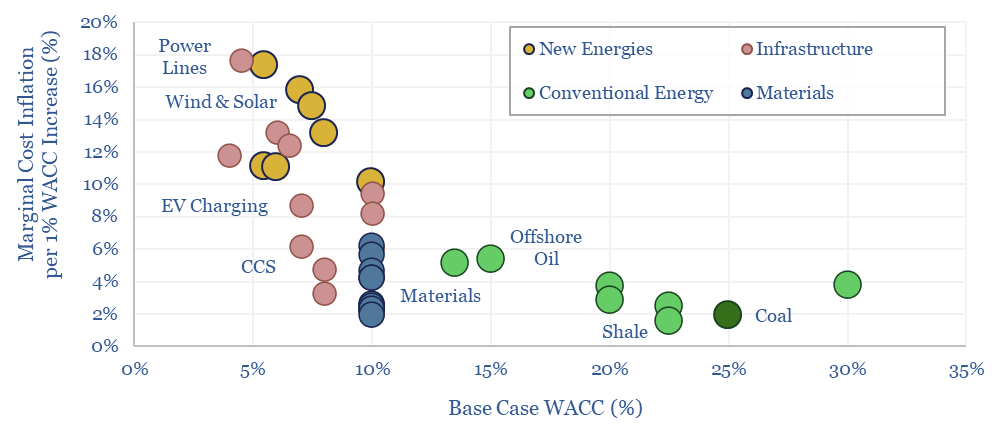
Interest rate sensitivity is visible in our overview of energy economics. Each 1% increase in capital costs re-inflates new energies 10-20%, infrastructure 2-20%, materials 2-6%, and conventional energy 2-5% (chart below, note here).
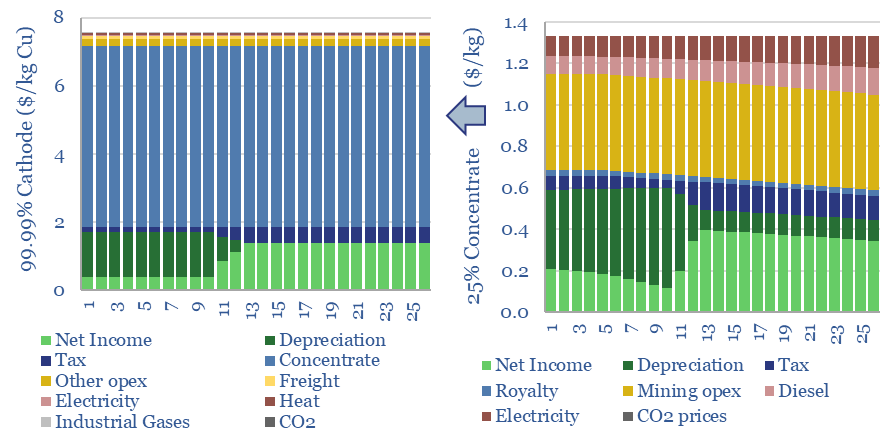
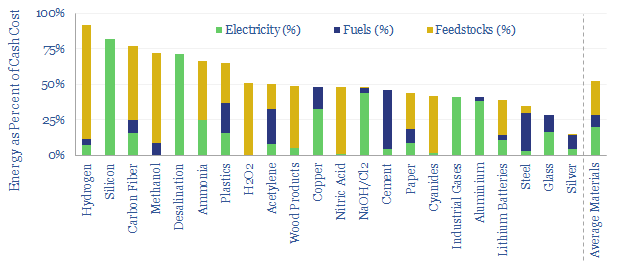
The energy intensity of materials is visible across our models of Acetylene, Aluminium, Ammonia, Carbon Fiber, Cement, Copper, Cyanides, Desalination, Glass, H2O2, Hydrogen, Industrial Gases, Lithium Batteries, Methanol, NaOH/Cl2, Nitric Acid, Paper, Plastics, Silicon, Silver, Steel, Wood Products. As a rule of thumb, energy is 50% of the cash cost of typical materials.
Renewables stand out. Despite high capital intensity (35% of revenues, 2x the average), once constructed, they also have the highest cash margins (75%, also 2x the average). The rise of wind, solar and electrification make capex costs and capital costs increasingly important.
The full data are available in the data-file below. However, please be aware that this is simply a compilation of headline figures across our library of 175 economic models. Access to all of the underlying models is covered by a Thunder Said Energy subscription.