Offshore wind: capacity by country and forecasts?
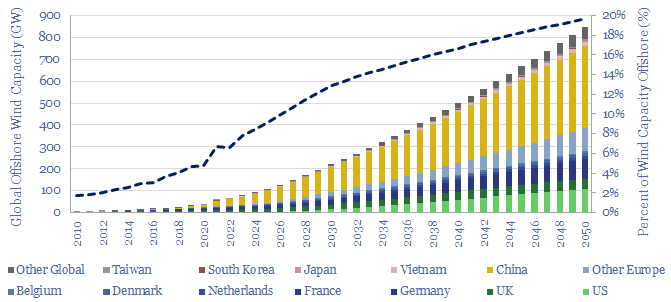
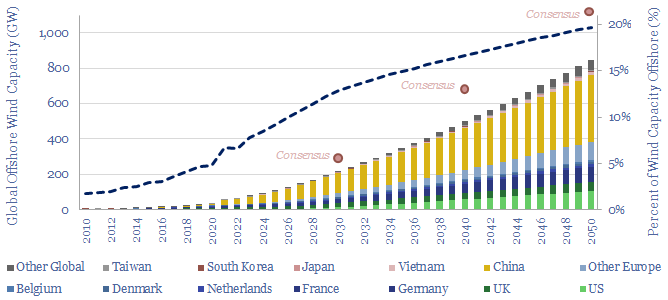
…50% of total capacity is offshore) and Germany (8GW, 12% of total capacity is offshore). Global offshore wind capacity forecasts by 2030 that have crossed our desk range from 200-400GW,…
the research consultancy for energy technologies
…50% of total capacity is offshore) and Germany (8GW, 12% of total capacity is offshore). Global offshore wind capacity forecasts by 2030 that have crossed our desk range from 200-400GW,…
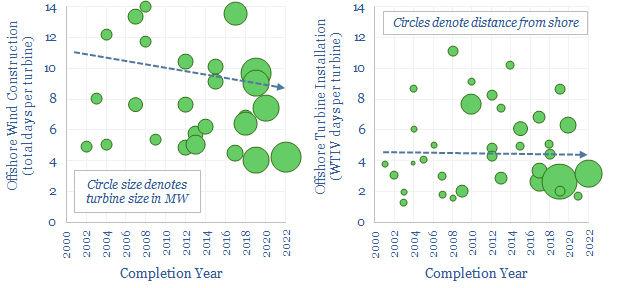
Wind turbine installation vessels are estimated to cost $100-500/kW in the breakdown of a typical offshore wind project’s capex. Total offshore construction time is around 10 days per turbine. Offshore…
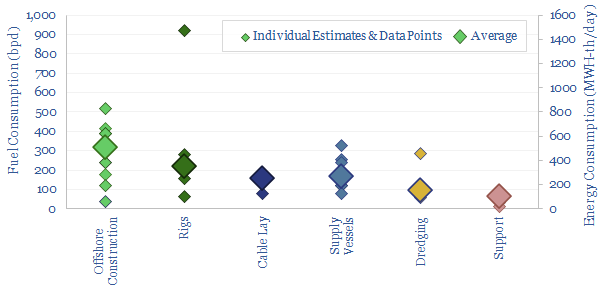
This database tabulates the typical fuel consumption of offshore vessels, in bpd and MWH/day. We think a typical offshore construction vessel will consume 300bpd, a typical rig consumes 200bpd, supply…
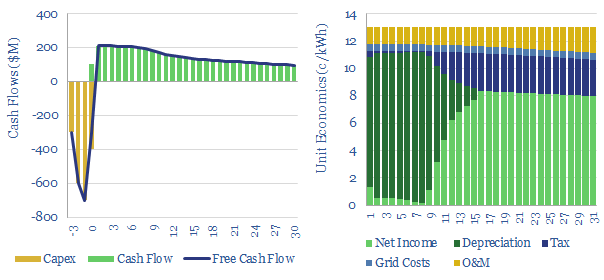
…on capex adds 1c/kWh and each 1% on WACC adds 1.3 c/kWh to offshore wind levelized costs. $599.00 – Purchase Checkout Added to cart The levelized costs of offshore wind are built…
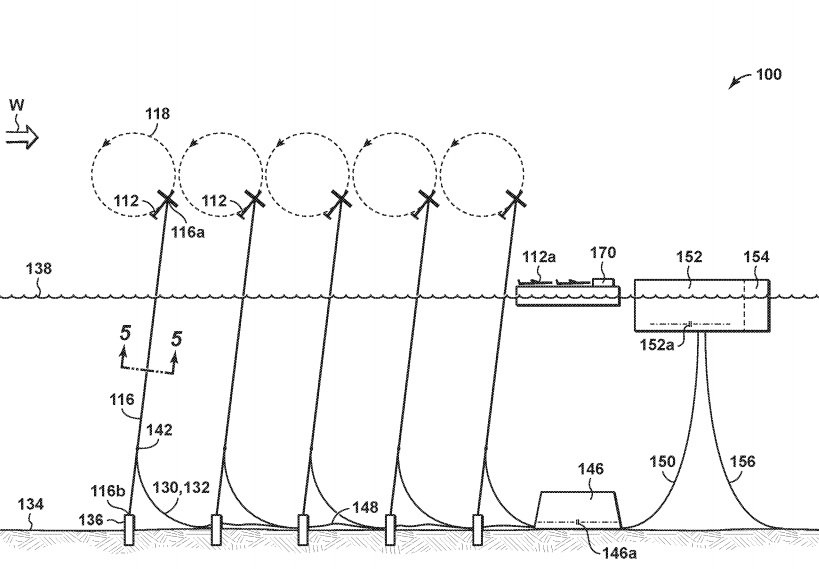
…the tether system, its connection to a floating structure, the anchor piles, a quick-disconnect system, and offshore maintenance procedures. Exxon’s floating offshore wind concept?! (150) is a local electrical distribution…
…projects, and thus excite another cycle of offshore exploration and development. Beneficiaries include technology leaders among offshore producers, subsea services, plus more operationally levered offshore oil services. The idea is…
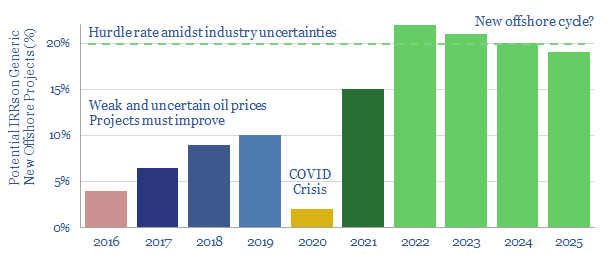
…interest rates? What are the economic sensitivities? We have expanded our commodity price databases and offshore wind models to answer these questions on pages 6-9. What forecasts for global offshore…
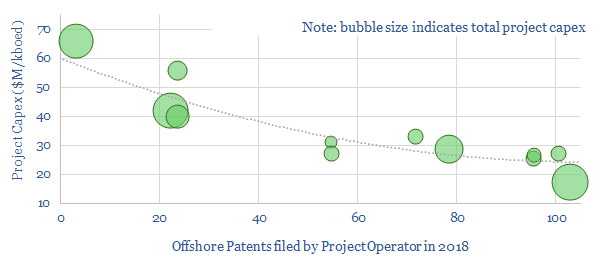
Technology leadership determines offshore capex. Specifically, this data-file measures a -88% correlation coefficient between different Major’s offshore patent filings in 2018 and their projects’ capex costs. $199.00 – Purchase Checkout Added to…
…Majors’ offshore wind investments. Commoditised, industry-standard technologies yield single-digit returns at best. Model it from a portfolio perspective, and the optimal portfolio allocation to undifferentiated renewables technology is just 5-13%…
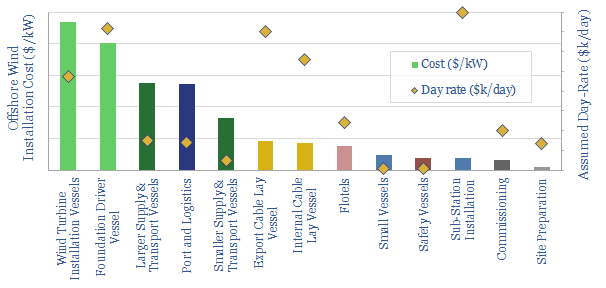
An offshore wind project is likely to cost $2,500/kW, of which c$1,500/kW is turbines and $1,000/kW is offshore wind installation costs. This data-file aims to estimate the breakdown by vessel…