Digital technologies in the energy transition are aimed at saving energy, optimizing industrial processes, and integrating new energies, such as wind and solar. This theme goes hand-in-hand with electrification and the rise of ‘smart technologies’.
Our research in this category spans optimization work, smart energy, digital twins, next-gen sensing technology, ‘remote’ control of previously in situ processes (aka de-manning), drones, robotics, autonomous control, fiber-optics, machine learning and blockchain technologies.
One impression is that digital technologies impact every other theme in the energy transition, cutting across most other categories.
It is also interesting where we can find case studies of specific digitization initiatives of specific operators, and how these deployments have increased output, lowered costs or lowered energy consumption.
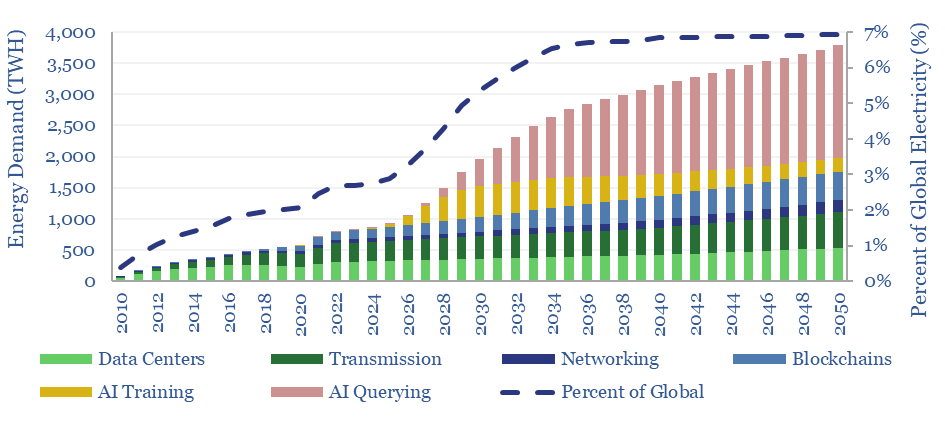
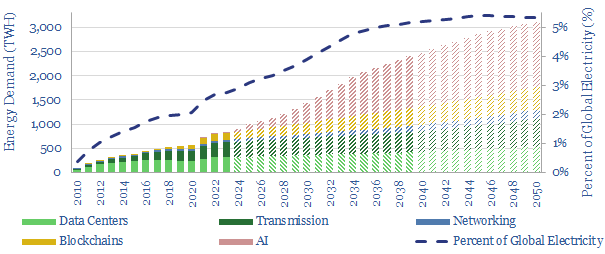
This data-file forecasts the energy consumption of the internet, rising from 800 TWH in 2022 to 2,000 TWH in 2030 and 3,750 TWH by 2050. The main driver is the energy consumption of AI, plus blockchains, rising traffic, and offset by rising efficiency. Input assumptions to the model can be flexed. Underlying data are from technical papers.
Our best estimate is that the internet accounted for 800 TWH of global electricity in 2022, which is 2.5% of all global electricity. Despite this area being a kind of analytical minefield, we have attempted to construct a simple model for the future energy demands of the internet, which decision-makers can flex, based on data and assumptions (chart below).
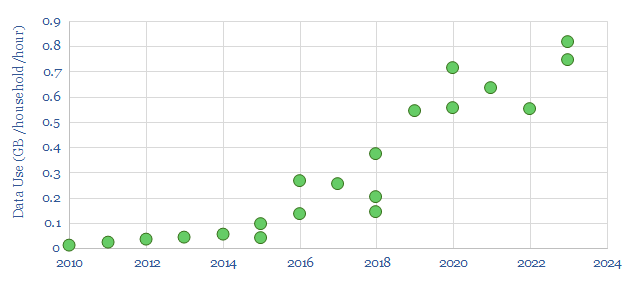
Internet traffic has been rising at a CAGR of 30%, as shown by the data use of developed world households, rising to almost 3 TB per user per year by 2023. The scatter also shows a common theme in this data-file, which is that different estimates from different sources can vary widely.
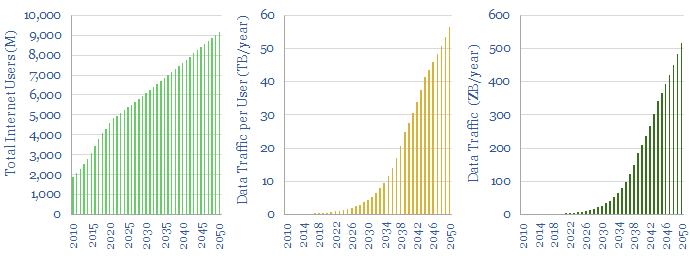
Future internet traffic is likely to continue rising. By 2022 there were 5bn global internet users underpinning 4.7 Zettabytes (ZB) of internet traffic. Users will grow. Traffic per user will likely grow. We have pencilled in some estimates, but uncertainty is high.
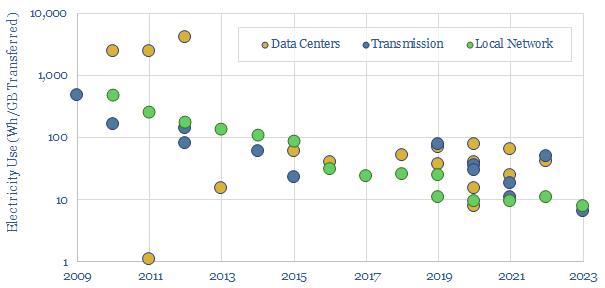
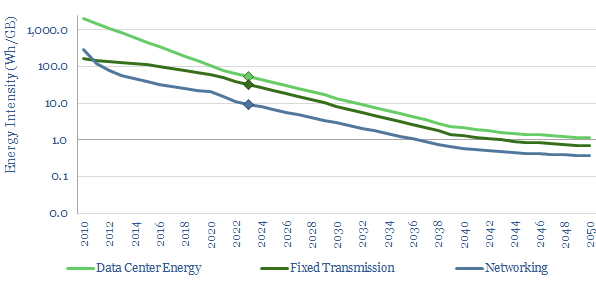
The energy intensity of internet traffic spans across data-centers, transmission networks and local networking equipment. Again, different estimates from different technical papers can vary by an order of magnitude. But a first general rule is that the numbers have declined sharply, sometimes halving every 2-3 years.
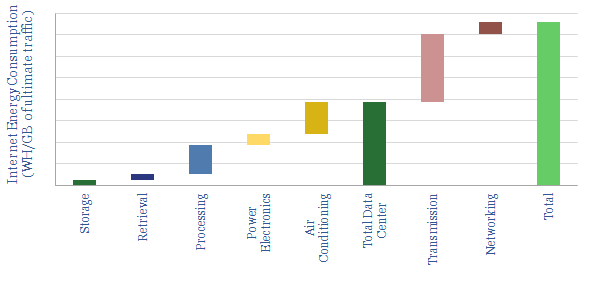
The current energy intensity of the internet is thus estimated at 140 Wh/GB in our base case, broken down in the waterfall chart below, using our findings from technical papers and the spec sheets of underlying products (e.g., offered by companies such as Dell).
Energy intensity of internet processes will almost certainly decline in the future, as traffic volumes rise. Again, we have pencilled in some estimates to our models, which can be flexed.
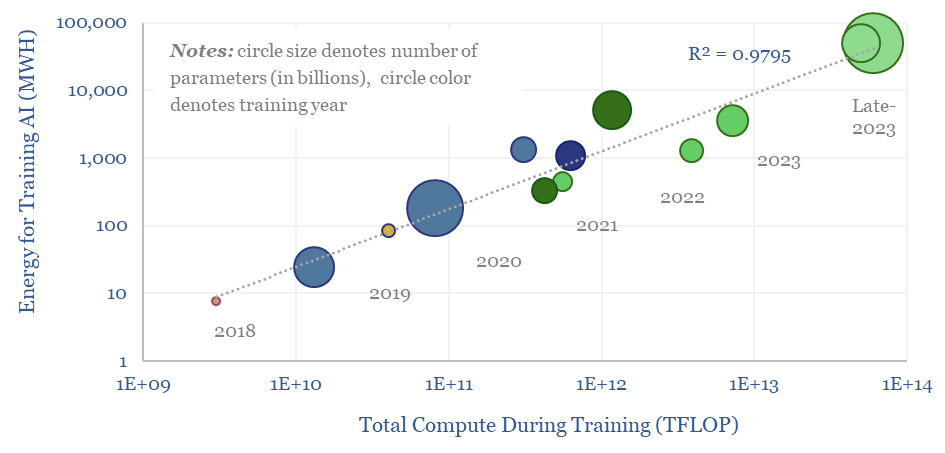
However the energy needed for AI is now rising exponentially. Training Chat GPT-3 in 2020 used 1.3 GWH to absorb 175bn parameters. But training chat GPT-4 in 2023 used 50 GWH to absorb 1.8trn parameters. We find a 98% correlation between AI training energy and the total compute during training.
AI querying energy is also correlated with the complexity of the AI model, and thus will likely continue rising in the future. Average energy use is estimated at 3.6 Wh per query today, which is 4x more than an email (1 Wh) and 10x more than a google search (0.3 Wh).
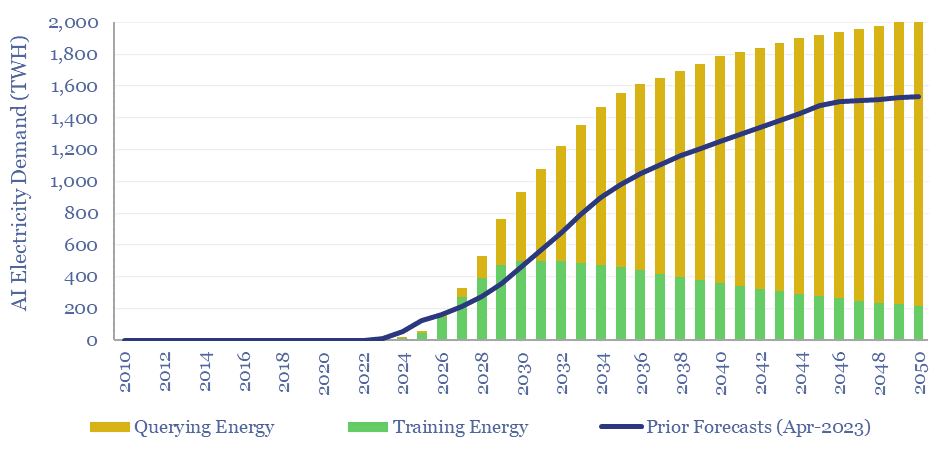
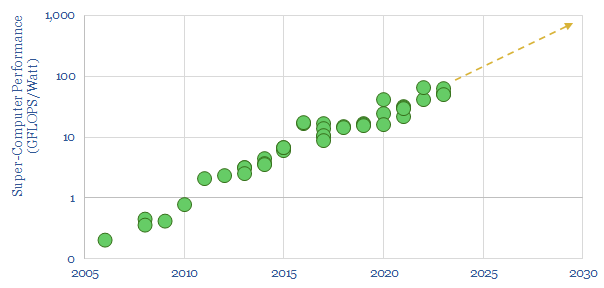
Muting the impacts of larger data-processing volumes, we expect a 40x increase in future computer performance in GFLOPS per Watt (chart below). This yields 900 TWH of AI demand around 2030, revised up from 500 TWH in April-2023 (chart above).
Please download the model to stress-test your own estimates for the energy intensity of the internet. It is not impossible for total electricity demand to ‘go sideways’ (i.e., it does not increase). It is also possible for the electricity demand of the internet to exceed our estimates by a factor of 2-3x if the pace of productivity improvements slows down.
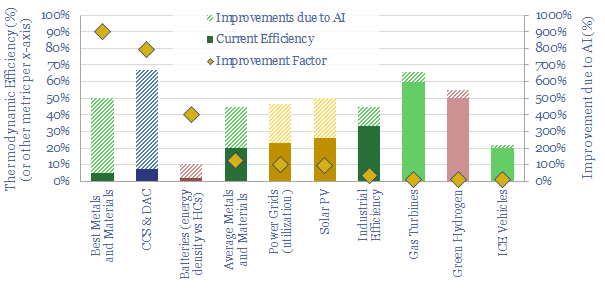
AI will be a game-changer for global energy efficiency. It will likely save 10x more energy than it consumes directly, closing ‘thermodynamic gaps’ where 80-90% of all primary energy is wasted today. Leading corporations will harness AI to lower their costs and accelerate decarbonization. This 19-page note explores the opportunities.
Powering the internet consumed 800 TWH of electricity in 2022, as 5bn users generated 4.7 Zettabytes of traffic. Our guess is that the internet’s energy demands double by 2030, including due to AI (e.g., ChatGPT), adding 1% upside to global energy demand and 2.5% to global electricity demand. This 14-page note aims to break down the numbers and their implications.
What is the energy intensity of fiber optic cables? Our best estimate is that moving each GB of internet traffic through the fixed network requires 40Wh/GB of energy, across 20 hops, spanning 800km and requires an average of 0.05 Wh/GB/km. Generally, long-distance transmission is 1-2 orders of magnitude more energy efficient than short-distance.
An optical fiber consists of a glass core, through which light signals can travel ultra-rapidly via total internal reflection, surrounded by at least one sheathing layer.
A fiber optic cable consists of at least one optical fiber, often many, surrounded by protective exterior layers of sheathing and possibly armoring. By 2020, over 5bn kilometers of fiber-optic cables have been deployed globally. Estimates vary, but the fiber optic cable market is likely worth $10bn per year.
A transceiver (aka a transducer) is an electric device that converts electrical signals into light signals (e.g., a laser-based transmitter) or vice versa (e.g., a photo-diode based receiver). The optical transceiver market is worth around $10bn per year.
The fiber optic network is a constellation of transceivers and fiber optic cables, which are capable of transmitting data between data-centres and internet users. A commonly used acronym is PON which stands for the Passive Optical Network, and simply transmits data.
Bitrate is the capacity of a digital network to transmit information. It is measured in Gbps. Gbps stands for Gigabits per second. 1 Gbps means that 1 billion bits of information can be passed along the fiber optic cable each second (there are 8 bits in a byte).
The frequency of a fiber optic system is measured in MHz. 1 MHz means that the cable can carry 1 million distinct ‘packets’ of information per second (i.e., 1 Mbps). Typical frequencies are 10-100MHz, but can reach into the GHz range.
Many distinct signals can be carried through a fiber optic cable at the same time by “multiplexing” them. This might include carrying them at different frequencies or wavelengths. For example, ‘dense wavelength division multiplexing’ (DWDM) can carry 80-100 different frequencies through the same optical fiber (different colors). The signals can later be de-multiplexed.
Prysmian notes a typical fiber optic cable will enable 1-10 Gbps download speeds, which is 30-50x faster than a comparable copper cable (25-300 Mbps), and an order of magnitude above satellites or DSL (0.5 – 75 Mbps). The world record for data transmission through a fiber optic cable at the time of writing is 1.84 petabits per second (achieved in 2022 by researchers from the University of Denmark, on a single, 7.9km fiber optic cable, split into 37 lines with 223 frequencies per line). This is something equivalent to transmitting 1bn Zoom calls simultaneously.
The strength of a signal in a fiber optic cable is measured in dBm, where 0 dBm is the equivalent of 1mW (1,000th of a Watt). Note that decibels are logarithmic around base 10. Hence 10dBm is equivalent to 10mW, 20dBm is equivalent to 100mW, 30dbm is equivalent to 1W; while -10dBm is 0.1mW, -20dBm is -0.01mW and -30dBm is -0.001mW.
Attenuation is the difference between the launch power of the signal from the transmitter and the power of the signal at the receiver. The rate of attenuation will depend on the precise dimensions and materials of the cable, but a good rule of thumb is in the range of 0.2dB per kilometer. Each connector likely also introduces a 0.75dB loss.
To combat the impacts of attenuation across a longer cable one must either: project a higher power level from the initial transmitter; deploy a more sensitive (and thus more expensive) receiver; or install a series of amplifiers/repeaters along the length of the cable, to boost it (e.g., every 20km). Although this adds to the energy intensity of fiber optic cables.
Another limitation on the length of a cable comes from dispersion. This is not related to the signal attenuating (i.e., getting weaker). It is due to the signal ‘spreading out’ and becoming noisy. To combat attenuation, filtering needs to be applied within the circuitry of the amplifier/repeater. As a general rule, thin “single mode” fibers, with c10μm cores will have longer ranges than thicker “multi-mode” fibers with c50-100μm cores, as the thinner core confines the light more and limits dispersion. So in a sense, a fiber optic cable is the opposite of a pipeline, where greater widths enable greater flow.
Using these definitions, we can compile data into the energy consumption of fixed fiber lines and their bit rates. Using these numbers, we can estimate the power consumption of data transmission infrastructure, which is ‘always on’, transmitting signals on one side of a fiber optic cable and listening for signals on the other side.
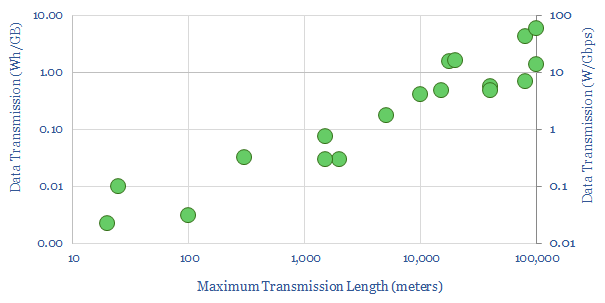
Power consumption of fiber optic cables can range from 0.01-100 W/Gbps depending on the length of the cable (chart below). As a mid-point, a 2-5km cable might have a power consumption of 1W/Gbps and consume around 0.1 Wh/GB of data transmission, which equates to 0.05 Wh/GB/km. Numbers can be flexed in the data-file.
Larger and more highly utilized cables will have 1-2 orders-of-magnitude lower energy consumption (chart below). Thus the energy intensity of fiber optic cables is not a fixed number, but highly context-sensitive.
Energy consumption will continue falling, per the historical trend (chart below, data here). The energy in the signal that is transmitted through a fiber optic cable (quoted in dBm), in physics terms, represents 0.05% of the total electricity use of the data transmission network. The energy consumption is not in the laser pulse. It is in encoding and decoding it, and the balance of electronic systems. Hence there is huge room to improve, including through improved cables, improved transceivers, more sensitive photo-diodes, greater frequencies, greater multiplexing.
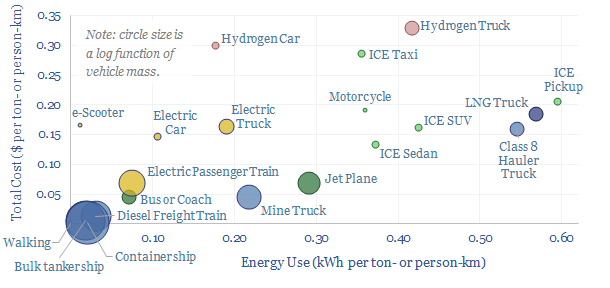
Overall the energy consumption of a fiber optic cable is very low. It might take 0.05 Wh to move 1GB by 1km. For contrast, the numbers to move 1 ton or 1 person by 1km can be around 15,000x higher (data here).
Cost and Energy Use Comparison of Passenger and Freight Transportation Vehicles in $ and kWh per km or mile
Corning is the leading manufacturer of fiber optic cables and had produced over 1bn kilometers of optical fiber by 2017 (and comes up in our glass fiber research). Prysmian produces 30M km of optical fiber each year across five plants worldwide (and comes up repeatedly in our research). Many sources cite Finisar, a division of Coherent and Molex as having the largest market share in transceivers. Broadcom is a $260bn (market cap) giant, producing connectivity equipment, and has a Top 3 market share in transceivers. Sumitomo is also active, making both cables and transceiver modules. Air Products notes that it supplies industrial gases, such as argon, helium and hydrogen used in production. High-quality silica glass and specialty plastics are also used in the cabling.
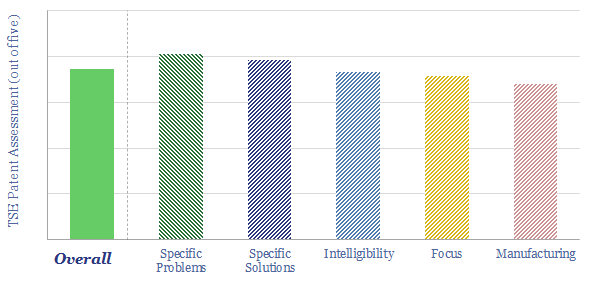
This data-file is a technology review for Sentient Energy, assessing innovations in smart grids. Its technology can achieve energy savings via a combination of “Conservation Voltage Reduction” and “Volt-VAR optimization at the grid edge”. This also helps to integrate more solar and EV charging into power grids. We will explain the technology below and in the data-file.
Sentient Energy is as an “intelligent sensing platform for grid utilities”, helping power utilities to identify and remediate grid issues. It has “the largest mesh network line sensor deployments in North America”. It is a private company. It was founded in 2009, headquartered in Frisco, TX and employs around 150 people. Its products are used by over 25 of North America’s largest utilities, and have helped reduced outage time by 20%, patrol costs by 60% and clocked up 1bn+ intelligent sensor hours in the field.
Volt-VAR optimization at the grid edge is the focus in about one-third of Sentient’s patents, and the focus in our technology review. So what does this mean?
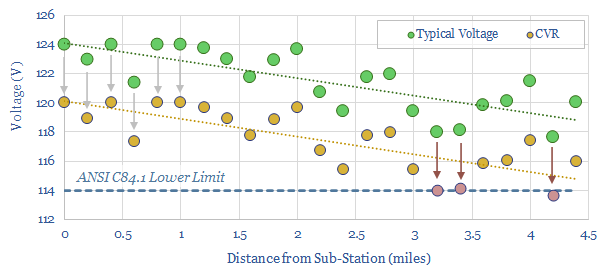
Why does Volt-VAR optimization matter? Imagine a group of houses, all connected to a single grid loop. Nominally, all of them “draw power at 120 Volts”. But in practice, voltage falls off slightly, as you get further from the sub-station (look at the green dots in the chart below). This is because the inevitable creation of electro-magnetic fields “consumes reactive power” (VARs). Park this thought for now.
Sometimes the grid is strained, power prices are very high, and there is a risk of load-shedding. In times like this, it is common for a utility to save energy via “Conservation Voltage Reduction”. If you remember that Power = Voltage x Current, then clearly you can save power by lowering the voltage at the sub-station by 1-5%. It might take a little bit longer for the kettle to boil. But basically nothing is going to break.
What limits Conservation Voltage Reduction is that there is a minimum acceptable voltage. No customer should see their voltage fall below this level. And thus in our image below, we can only lower the voltage at the sub-station by 4 Volts before the ‘pink dots’ below, which tend to be customers furthest from the sub-station, hit the lower limit. But most of the time, a utility is simply guessing here. It has data about the sub-station, which it owns and operates. But it may have hardly any data at all about what is happening downstream of the sub-station.
Enter “Volt-VAR optimization at the grid edge”. The idea is to place dozens of smart optimization devices around the grid. They can detect the voltage in real time, and they can “inject reactive power” to boost voltage at the critical places where voltage is becoming unacceptably low. There have been several studies and over 10,000 deployments of these devices to date. They can typically increase the power savings during Conservation Voltage Reduction by 2-3x. I.e., during times when power grids are under-supplied, total energy savings of 3-5% can safely be achieved, by safely lowering the sub-station voltage, almost imperceptibly for customers.
This also helps smooth the volatility of solar. One study has shown a 72% reduction in voltage volatility from installing a swarm of grid-edge optimization devices. In turn, this kind of improvement in a grid’s ability to tolerate voltage fluctuations can unlock something like 45% more solar hosting capacity. If smart inverters and dynamic voltage controllers are employed together, than the solar hosting capability can be improved by 60%.
In conclusion, our technology review for Sentient Energy finds 3-5% energy savings and great solar penetration can be achieved using smart energy systems. Our assessment on Sentient Energy’s technology, the moat in its patents, and further data-points gleaned from its white papers can be found in the data-file below.
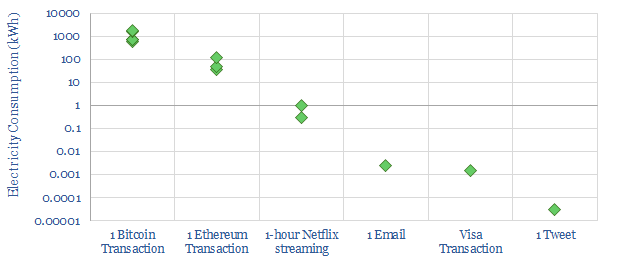
A single Bitcoin transaction currently uses c1,000kWh of electricity, which is 1 million times more than a traditional payment. Hence this 8-page note aims to explain how blockchain works, why it has been so energy intensive in the past, and how the energy multiplier could be reduced to maybe 100 – 1,000 x in a best case future scenario. Thus there could be a role for blockchain in some use cases in the energy transition.
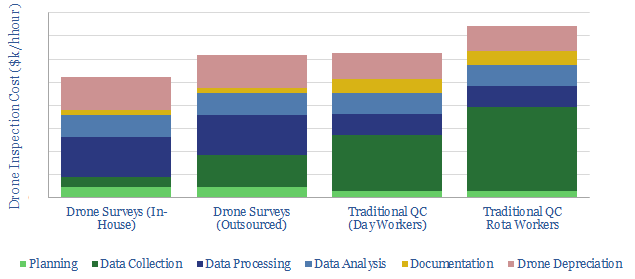
This data-file estimates drone inspection costs, for the construction and resources industries, using bottom-up numbers from technical papers.
Drones can be used to inspection mining, construction, LNG or forestry activities, in order to survey activity and identify issues. Many of these drones are electricity and are inherently easier to decarbonize than combustion-powered transportation.
When using drones for inspections, costs per hour can be 30% lower than for traditional quality control inspections. A single drone, including software licenses likely costs c$30k, which is disaggregated line-by-line in the data-file.
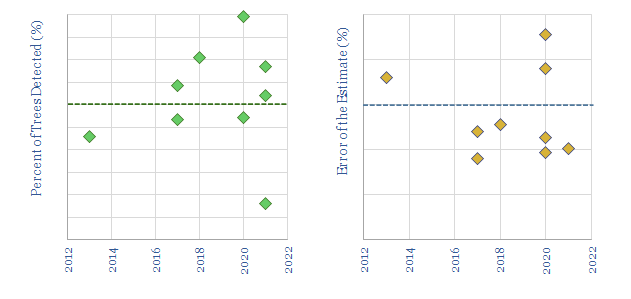
The data-file also quantifies the capabilities of drones to monitor carbon accumulation in forests, capturing the details of ten technical paper from the past decade, which used LiDAR to measure DBH (below).
The average drone-LiDAR study in 2011-2022 is capable of identifying 80% of the trees and captures their diameter with a +/- 15% margin of error. As cool as this is,it is not quite good enough (yet) to quantify carbon stocks. Although the survey may be 30% lower than traditional approaches.
And this is still quite generous. Some of the “better” studies are flying through stands that have already been mapped, stands near clearings, in mono-culture pine forests, or in the dead of winter (i.e., these are not real, biodiverse forests with leaves obscuring the field of view).
Our notesin drone inspection costs and notes from related technical papers are also included in the data-file. A screen of drone companies is linked here and our other research into drones in the energy transition is linked here.
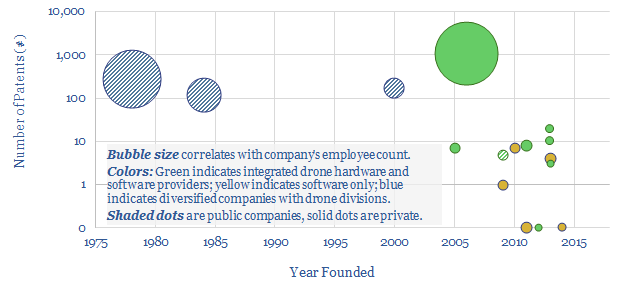
The aim of this data-file is a simple screen of companies manufacturing drones and commercializing drone software. In includes 12 private companies and 4 public companies. For each company, we have tabulated their history, geography, number of patent filings and a short description.
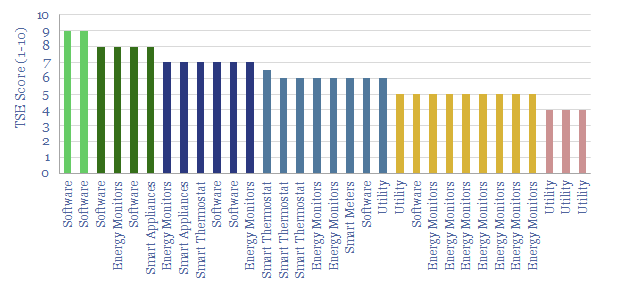
Smart energy systemsare capable of transmitting and receiving real-time data and instructions. They open up new ways of optimizing energy efficiency, peak demand, appliances and costs. Over 100M smart meters and thermostats had been installed in the United States (including at c90M residences) and 250M have been installed in Europe by 2020.
The purpose of this data-fileis to profile c40 companies commercializing opportunities in smart energy monitoring, smart metering and smart thermostats. The majority are privately owned, at the venture or growth stage. We also tabulate their patent filings.
We find most of the offeringswill lower end energy demand (by an average of 7%), assist with smoothing grid-volatility, provide appliance-by-appliance demand disaggregations and encourage consumers to upgrade inefficient or potentially even defective appliances. Numbers are tabulated in the data-file to quantify each of these effects.
Further research. Our recent commentary that summarises the key points on Smart energy systems is linked here. Our outlook on the most conductive metals used in the energy transition is linked here.
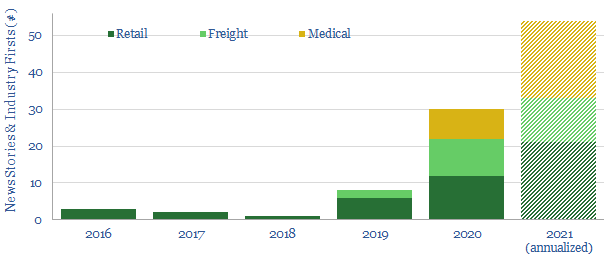
In 2019, we argued drones would be the single most disruptive technology to gain share in the 2020s, with potential to save over 500MTpa of CO2 emissions, while re-shaping urban consumption, retail and manufacturing (note here).
This data-file aims to tabulate key news flow and data-points around the ascent of drone technologies, across dozens of news stories, running back to 2016. We find an acceleration of activity due to COVID. Full details are overleaf.
Cookies?
This website uses necessary cookies. Our cookies are simply to improve your experience. We do not undertake any advertising or targeting via our cookies. By clicking 'accept' or continuing to use the website, you consent to our use of cookies.AcceptRead More
Privacy & Cookies Policy
Privacy Overview
This website uses cookies to improve your experience while you navigate through the website. Out of these, the cookies that are categorized as necessary are stored on your browser as they are essential for the working of basic functionalities of the website. We also use third-party cookies that help us analyze and understand how you use this website. These cookies will be stored in your browser only with your consent. You also have the option to opt-out of these cookies. But opting out of some of these cookies may affect your browsing experience.
Necessary cookies are absolutely essential for the website to function properly. This category only includes cookies that ensures basic functionalities and security features of the website. These cookies do not store any personal information.
Any cookies that may not be particularly necessary for the website to function and is used specifically to collect user personal data via analytics, ads, other embedded contents are termed as non-necessary cookies. It is mandatory to procure user consent prior to running these cookies on your website.