Hydrogen: overview and conclusions?

Hydrogen best opportunities?

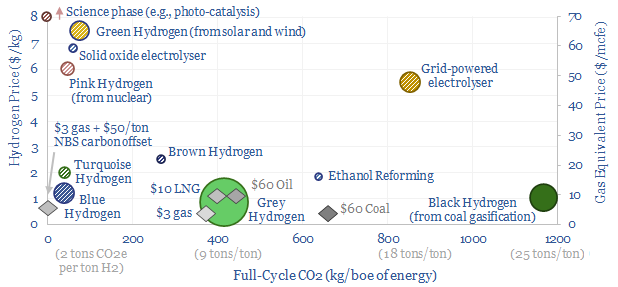
The best opportunities for hydrogen in the energy transition will be to decarbonize gas at source via blue and turquoise hydrogen, displacing ‘black hydrogen’ that currently comes from coal, and to produce small-scale feedstock on site via electrolysis for select industries. Some see green hydrogen becoming widespread in the future energy system. We think there may be options elsewhere, to drive more decarbonization, with lower costs, lower losses and higher practicality.


(1) Green hydrogen economy? Our main question mark is over “economy”. Costs are modeled at $7/kg, equivalent to $70/mcf natural gas, after generating renewable electricity, electrolysing water into hydrogen and storing the hydrogen. Levelized costs of electricity then reach 60-80c/kWh, for generating clean electricity in a fuel cell power plant, yielding a CO2 abatement cost of $600-1,200/ton (note here). We think costs matter in the energy transition and the entire world can be decarbonized via other means, for an average cost of $40/ton in the TSE roadmap to net zero.

(2) Fuels derived from green hydrogen are by definition going to be more expensive than the hydrogen itself. We have evaluated electro-fuels, green methanol, sustainable aviation fuels, hydrogen trucks, again finding CO2 abatement costs above $1,000/ton. Again, we think transportation can be decarbonized cost-effectively via other means.

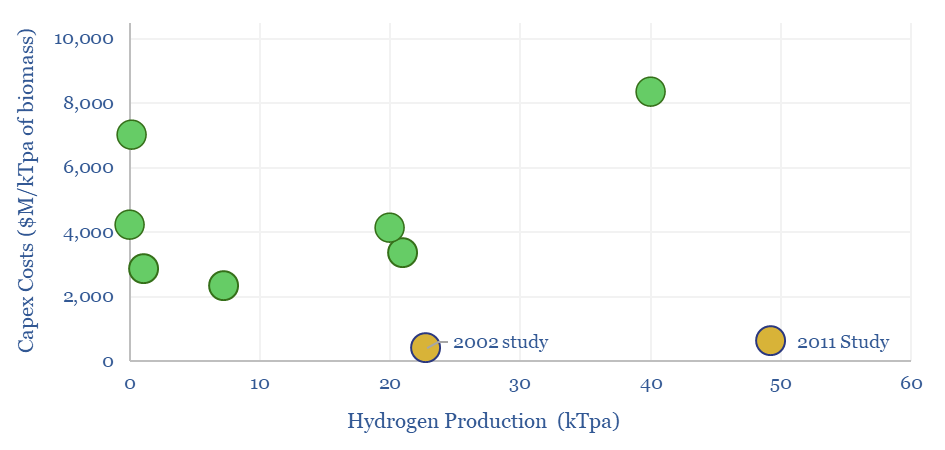
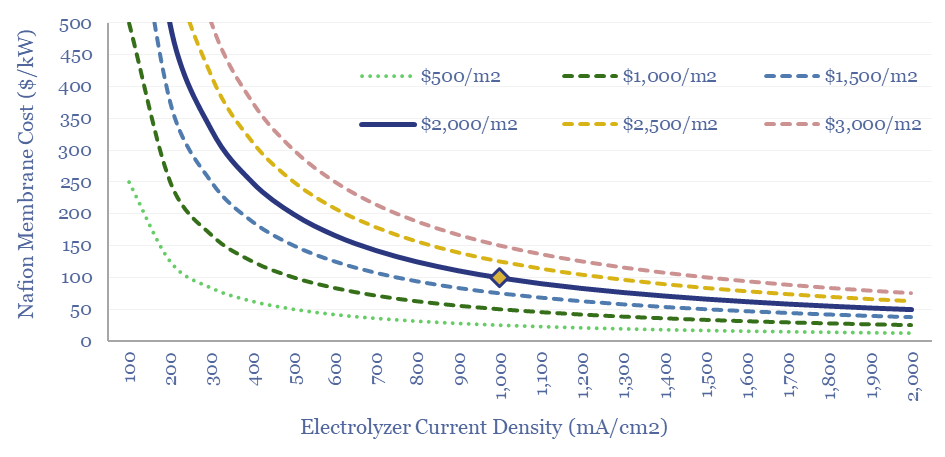
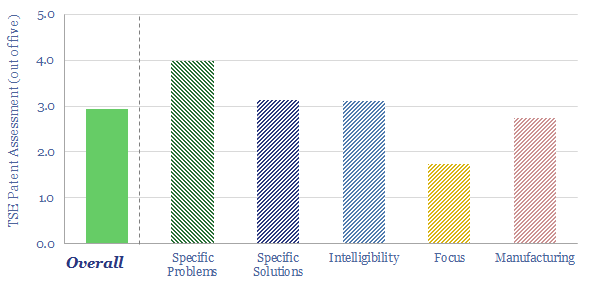
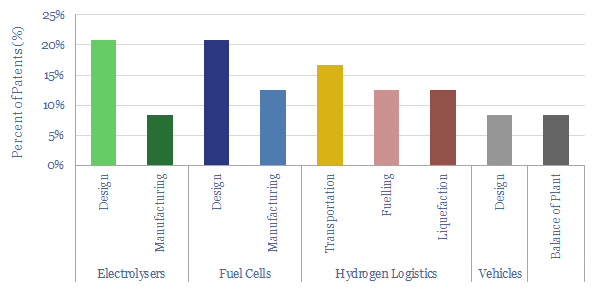
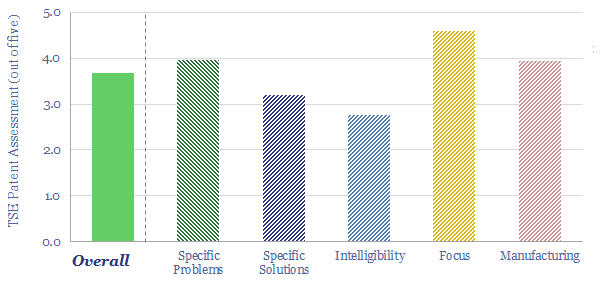
(3) How much can capex costs come down? There is an aspiration for electrolyser costs (presently around $1,000/kW on a full, installed basis) to deflate by over 75%. However, we have reviewed electrolyser costs line by line and wonder whether 15-25% deflation is more realistic (note here). Alkaline electrolysers vs PEMs are contrasted here. We have recently screened NEL’s patents to explore future cost deflation in electrolysers.

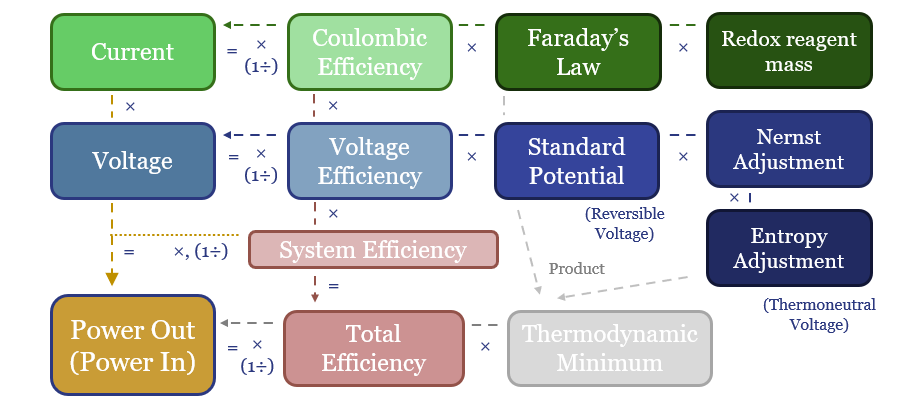
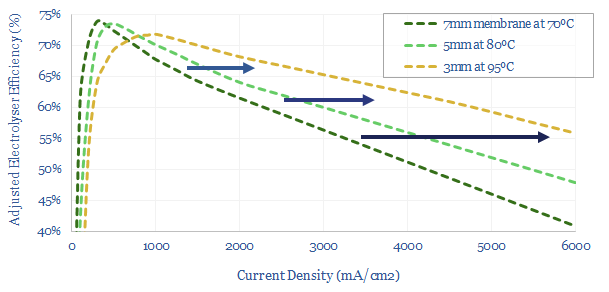
(4) Efficiency: the second law of thermodynamics. The absolute magic of renewables and electrification is their thermodynamics. These technologies can be 85-95% efficient end-to-end, precisely controlled, and ultra-powerful. A world-changing improvement on heat engines and an energy mega-trend for the 21st century. However, the thermodynamics of hydrogen depart from the trend, converting high-quality electricity back into a fuel. The maximum theoretical efficiency of water electrolysis is 83% (entropy increases). Real world electrolysers will be c65% efficient. End-to-end hydrogen value chains will be c30-50% efficient. We want to decarbonize the global energy system. It therefore seems strange to take 100MWH of usable, high-grade, low-carbon electricity, and convert it into 40MWH of hydrogen energy, when you could have displaced 100MWH of high-carbon electricity directly (e.g., from coal). And all the more so, amidst painful energy shortages.

(5) Backing up renewables? It is often argued that renewables will eventually become so abundant, especially during windy/sunny moments, that the inputs to hydrogen electrolysers will become free. We think this is a fantasy. Instead, industrial facilities and consumers will demand shift. Conversely, we are not even sure an electrolyser can run off of a volatile renewables input feed without incurring 5-10% pa degradation, or worse (if you read one TSE note on green hydrogen, we recommend this one).

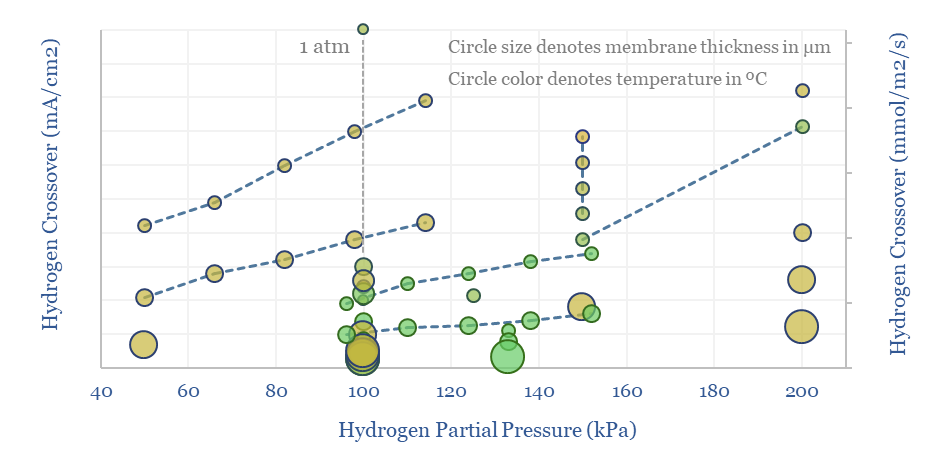
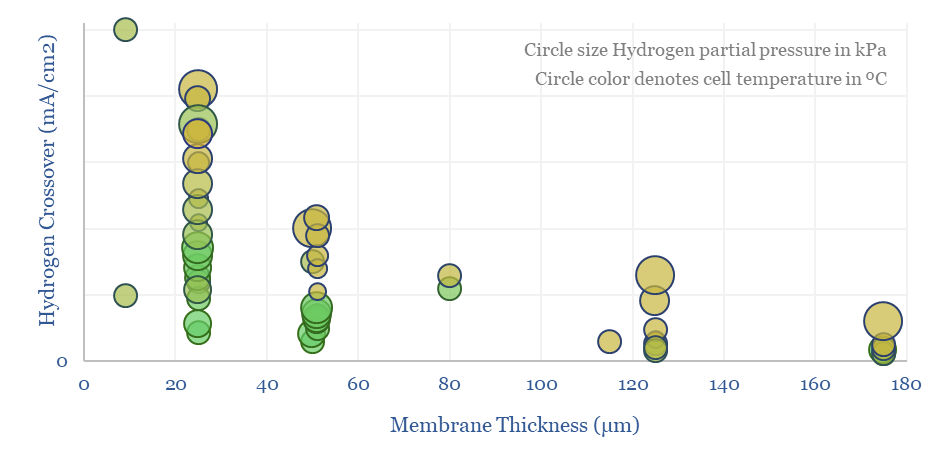
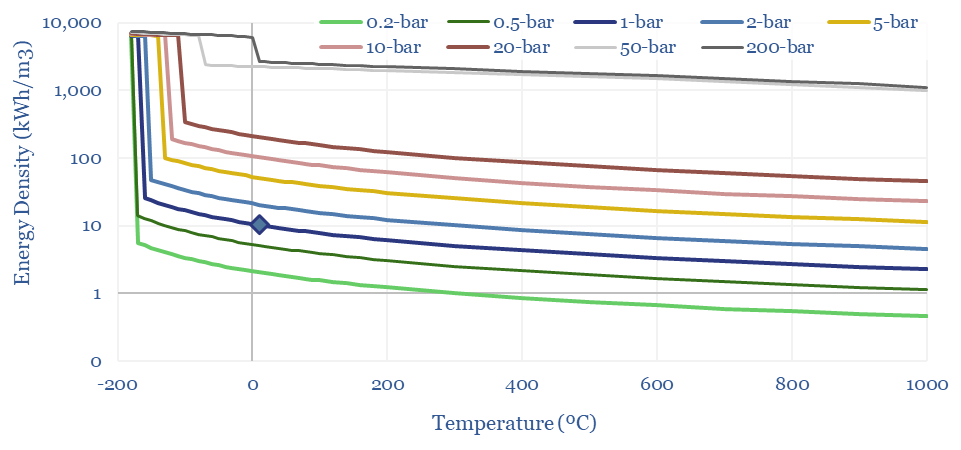
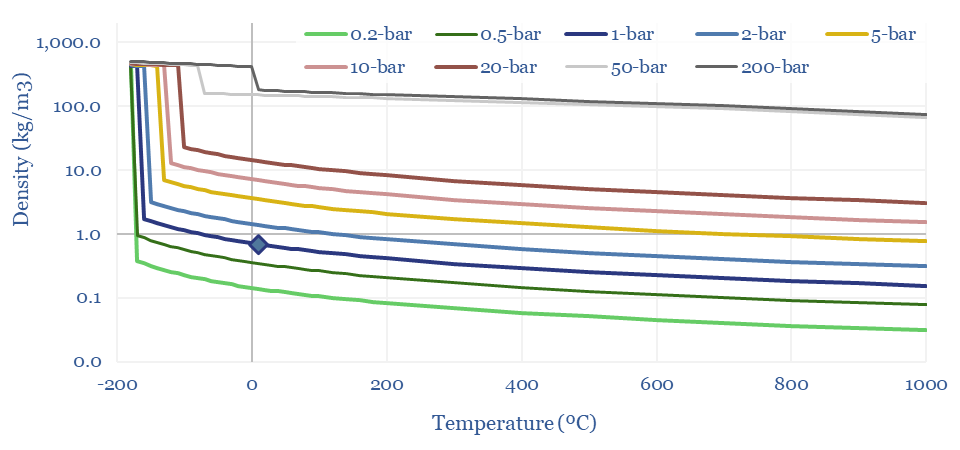
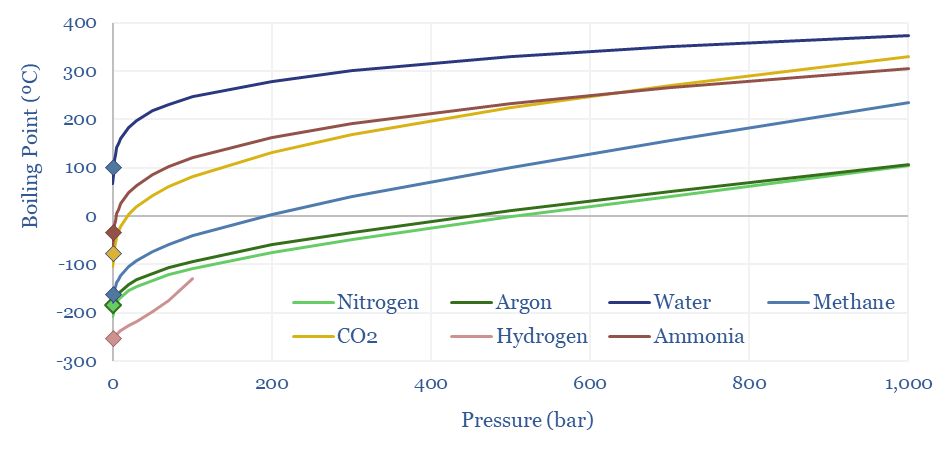
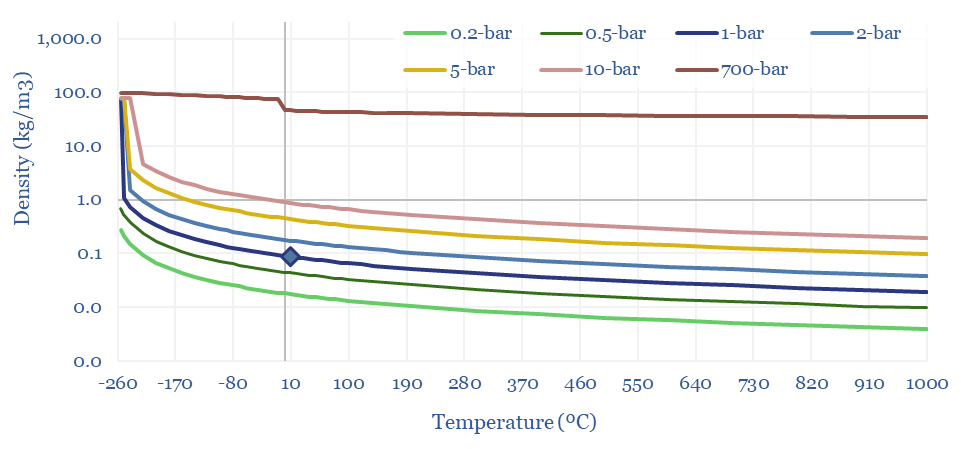
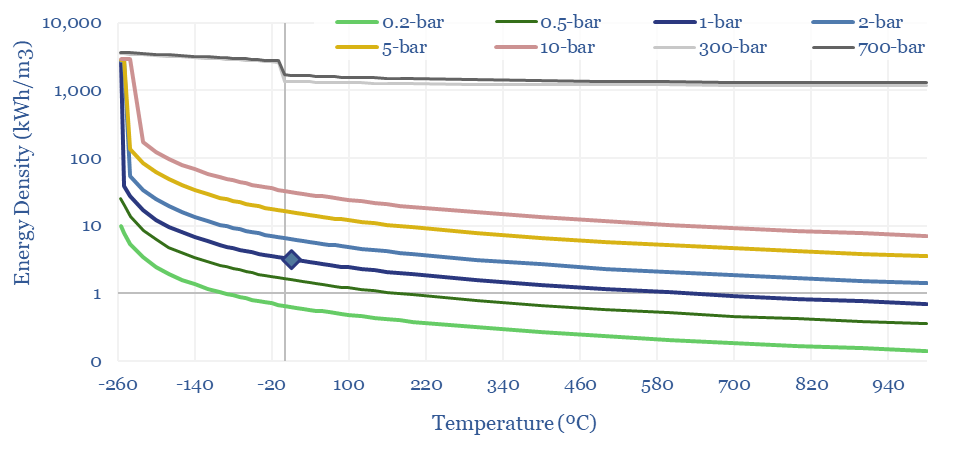
(6) Operations, transport, logistics all feel strangely challenging. Our studies of patents suggest that electrolysers and fuel cells can be the Goldilocks of energy equipment. Past installations have declined at over 5% per year. Due to its small molecular size, 35-75% of hydrogen produced in today’s reformers can be lost. Some vehicles seek to store hydrogen fuel at 10,000 psi, which is 1.5x the pressure of hydraulic fracturing. Even in the space industry, rocket makers have been de-prioritizing hydrogen in favor of LNG (!) because of logistical issues. The costs of hydrogen transport will be 2-10x higher than comparable gas value chains, while up to 50% of the embedded energy may be lost in transportation: our overview into hydrogen transport is here, covering cryogenic trucks, hydrogen pipelines, pipeline blending, ammonia and toluene. Is a hydrogen truck really comparable with a diesel truck? (note here, models here). Finally, the gas industry is bending over backwards to stem methane leaks, due to methane’s GWP of 25x CO2, but hydrogen itself may have a GWP as high as 13x CO2.

(7) Will policy help? We are not sure. We are tempted to draw analogies to the Synthetic Fuels Corporation, bequeathed $88bn of US government money in 1980 amidst the oil shocks, which in today’s money is similar to the $325bn Inflation Reduction Act. It completely missed its targets of unleashing 2Mbpd of synfuels by 1992, due to challenging economics, thermodynamics, technical issues, logistical issues. What evidence can we find that green hydrogen will prove different to this historical case study?

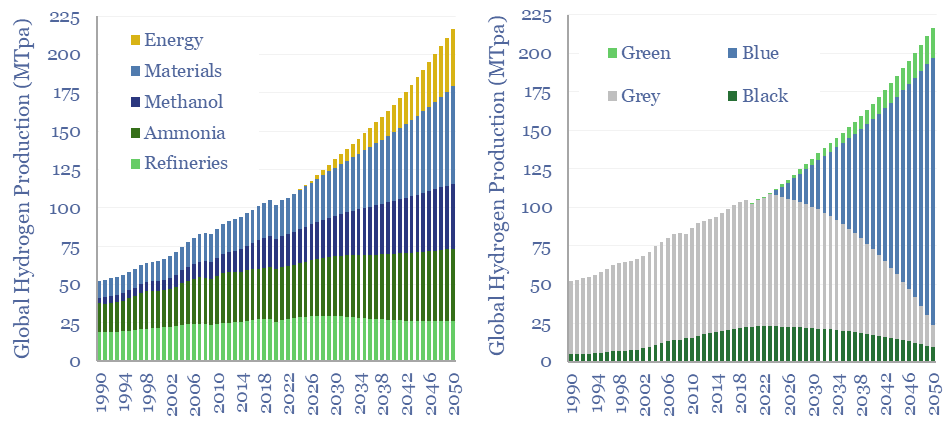
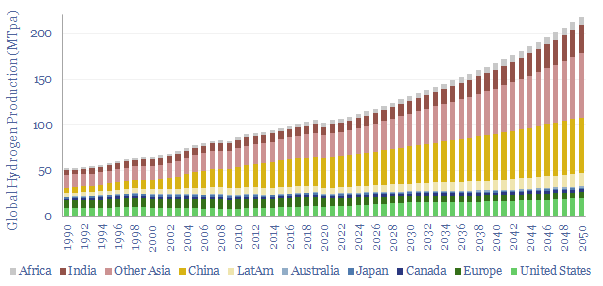
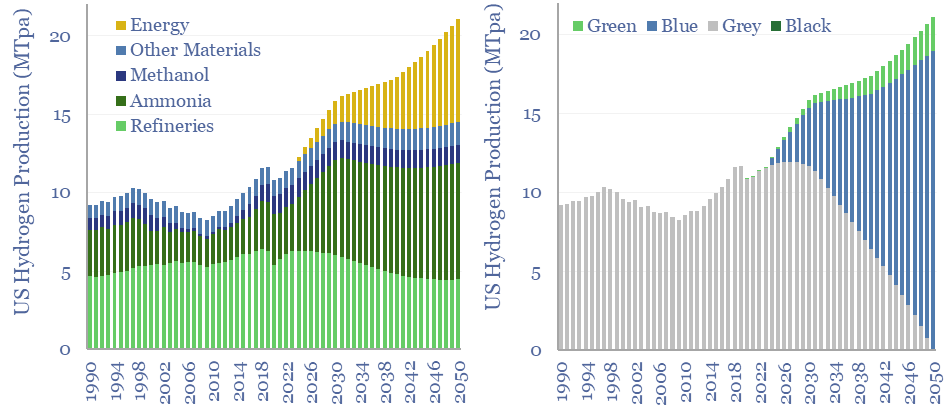
(8) Niche applications can however be very interesting, where clean hydrogen is used as an industrial feedstock. An overview of today’s 110MTpa hydrogen market is here and underlying data are here. At large scale, we are currently most excited by using clean hydrogen in ammonia value chains and steel value chains, as the technology is fully mature and looking highly economical. It is also booming in the US. Elsewhere, an excellent large-scale application is to displace black hydrogen (made from coal), which is 20% of today’s hydrogen market and has a staggering CO2 intensity of 25 tons/ton. At smaller scale, there is also a weird and wonderful industrial landscape, using hydrogen to make products such as margarine or automotive glass. Putting an electrolyser on site beats shipping in hydrogen via cryogenic trucks. But these are also quite niche applications.

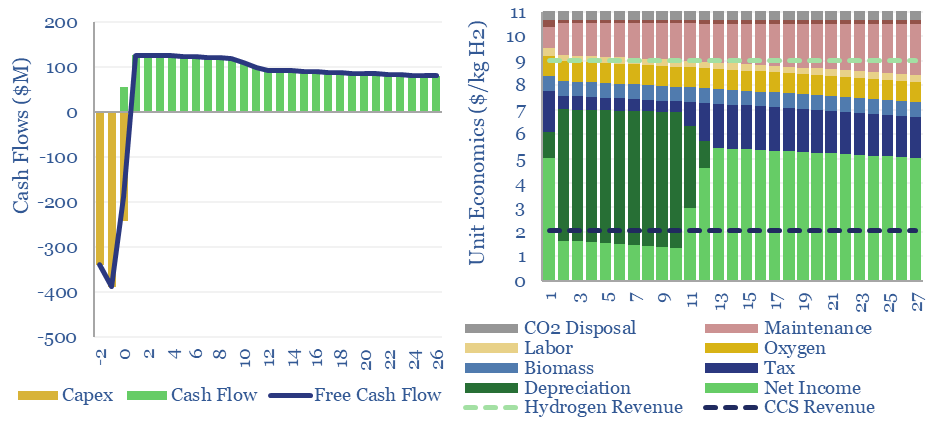
(9) Blue hydrogen is the most economical, low-carbon hydrogen concept we have found. Effectively this is decarbonizing natural gas at source, by reforming the methane molecule into H2 and CO2, the latter of which is sent directly for CCS. Our best overview of the topic is linked here. There are still c15% energy penalties. Costs are $1-1.5/kg in our models, to eliminate c90% of natural gas CO2.

(10) Turquoise hydrogen is also among the more interesting concepts, pyrolysing the methane molecule at 600-1,200◦C into H2 and carbon black. Our base case cost is $2/kg, with a $500/kg price for carbon black. But if you can realize $1,000/kg for the carbon black, you could give the hydrogen away for free. We have screened patents from Monolith and expect others to come to market with technologies and projects.


Around 40 reports and data-files into hydrogen have led us to these conclusions above; listed in chronological order on our hydrogen category page. The best way to access our PDF reports and data-files is through a subscription to TSE research.


Bright green hydrogen from biomass gasification?

Woody biomass can be converted into clean hydrogen via gasification. If the resultant CO2 is sequestered, each ton of hydrogen may be associated with -20 tons of CO2 disposal. The economies of hydrogen from biomass gasification require $11/kg-e revenues for a 10% IRR on capex of $3,000/Tpa of biomass, or lower, with CO2 disposal incentives.


Bright green hydrogen can be produced from woody biomass that would otherwise have decomposed, partially combusting it at 800ºC with pure oxygen, and generating hydrogen and CO2 for disposal.

Mass balances. If the partial oxidation of biomass is followed by a water-gas shift reactor, plus purification via pressure swing adsorption, then per ton of input biomass, it can yield 0.07 tons of 97-99% pure hydrogen and 21 tons of 95-99% CO2 for disposal.

In other words, biomass gasification can yield clean hydrogen as a feedstock or fuel, but it also sequesters the carbon in biomass, addressing challenges over the permanence of some nature-based CO2 removals.

The economics of biomass gasification are modelled in this data-file, albeit screening as somewhat expensive, requiring $11/kg hydrogen-equivalent revenues to earn a 10% IRR at a gasification plant with capex of c$3,000/Tpa of biomass.

50% of the total costs are associated with covering the high capex costs, while another 5-15% ($1/kg each) can be ascribed to plant maintenance, sourcing biomass and sourcing oxygen.

$11/kg hydrogen-equivalent revenues, in turn, may be derived via any mix of hydrogen revenues and CO2 disposal revenues, such as $11/kg hydrogen and $0/ton CO2 disposal, $9/kg hydrogen and $100/ton CO2 disposal, or $1/kg hydrogen and $500/ton CO2 disposal.

Costs of hydrogen from biomass gasification could best be reduced by reducing the capex costs of gasification facilities. Note the wide range of proposed capital investment costs in the chart below.

Energy economies are c50% energy-efficient, requiring 70 kWh of input energy per kg of hydrogen output, of which 94% is from the exothermic partial oxidation of woody biomass. Another c3% is from separating out oxygen, and another 3% is for compressing CO2.

Hence overall, gross CO2 emissions should be below 1 ton of CO2 per ton of hydrogen, while net CO2 emissions should be -20 tons of CO2 per ton of hydrogen production.

Biomass gasification adds to our list of hydrogen technologies, from black hydrogen, grey hydrogen, SMR blue hydrogen, ATR blue hydrogen, turquoise hydrogen, MIRALON process, chemical looping combustion, and green hydrogen.

Nafion membranes: costs and hydrogen crossover?

Perfluorinated sulfonate (PFSA) membranes, such as Nafion, are the crucial enabler for PEM electrolysers, fuel cells and other industrial processes (e.g., chlor-alkali plants). The market is worth $750M pa. The key challenges are costs, longevity and hydrogen crossover (in mA/cm2), which are tabulated in this data-file.


Nafion was first synthesised by Walther Grot, of E.I. DuPont de Nemours in the 1960s, as a robust cation exchange membrane for the chlor-alkali process, which had previously used materials such as asbestos to separate the anode and cathode sides of the cell.

Today, Nafion’s original patents have expired, and other producers besides Chemours produce PFSA polymers, under various different brand names. But in this article, we will refer to Nafion as a catch-all for similar PFSA membranes.

Nafion turns out to be a remarkable polymer, the enabling membrane for proton exchange membrane electrolysers and fuel cells. It consists of a fluorinated polymer (PTFE) backbone, off of which branch ether groups, connecting to further fluorinated polymers, ultimately terminating in sulfonate groups (SO3H).

Illustration of the chemical structure of Nafion membranes.

The sulfonate groups are strongly polar, exhibiting surface ultrastructural properties that “appear utterly unlike anything else”. They absorb water and form helical channels of 2-3 nm diameter, through which protons can ‘hop’. So can other small cations. But anions and gases are impeded. This is even the reason that the SpaceX’s Dragon space probe used Nafion membrane to dehumidify air against a vacuum.

Costs of Nafion membranes are estimated at $2,000/m2, based on data-points from online sources and technical papers. Thus the membranes will comprise $100/kW of cost in an electrolyser at 1,000 mA/cm2. This feeds into our electrolyser cost model, and the numbers can be stress-tested in this data-file.

The key challenge with Nafion and other PFSA membranes in a hydrogen electrolyser is hydrogen crossover. For example, this means that H2 forming at the cathode of an electrolyser can diffuse back across the membrane in very small quantities, towards the anode side, and re-oxidize into H2O. This hurts Coulombic efficiency by 0.1-1%.

But the more pressing challenge of hydrogen crossover is that hydrogen oxidation at the electrolyser anode will form not only water, but also peroxide radicals, which then have an annoying habit of degrading catalysts in the anode, the membrane itself, and other cell components.

Hydrogen crossover increases linearly with temperature, with H2 partial pressure (itself a function of current density!), for thinner membranes (which have lower resistance and are aimed at maximizing efficiency), and finally with age. Older or degraded membranes have 2-10x higher hydrogen crossover.

Membrane degradation may thus count against putting electrolysers and fuel cells into mobile applications, such as hydrogen cars, hydrogen trucks and planes. For more details, see our overview of electrochemistry and our overview of electrolyser degradation. Details on hydrogen crossover and possible solutions are in the data-file.

Electrochemistry: redox potential?

A flow chart depicting the calculation of a batteries current, voltage, and efficiency providing an overview of electrochemistry.

Batteries, electrolysers and cleaner metals/materials value chains all hinge on electrochemistry. Hence this 19-page note explains the energy economics from first principles. The physics are constructive for lithium and next-gen electrowinning, but perhaps challenge green hydrogen aspirations?

Density of gases: by pressure and temperature?

Density of gases

The density of gases matters in turbines, compressors, for energy transport and energy storage. Hence this data-file models the density of gases from first principles, using the Ideal Gas Equations and the Clausius-Clapeyron Equation. High energy density is shown for methane, less so for hydrogen and ammonia. CO2, nitrogen, argon and water are also captured.


The Ideal Gas Law states that PV = nRT, where P is pressure in Pascals, V is volume in m3, n is the number of mols, R is the Universal Gas Constant (in J/mol-K) and T is absolute temperature in Kelvin.

The Density of a Gas can be calculated as a function of pressure and temperature, simply by re-arranging the Ideal Gas Law, where Density ρ = P x Molecular Weight / RT. Our favored units are in kg/m3.

Density of methane in kg/m3 and kWh/m3

The Density of Methane (natural gas) can thus be derived from first principles in the chart below, using a molar mass of 16 g/mol, and then flexing the temperature and pressure. This shows how methane at 1 bar of pressure and 20ºC has a density of 0.67 kg/m3. LNG at -163ºC is 625x denser at 422 kg/m3. And CNG at 200-bar has a density of 180kg/m3.

Density of gases
Density of methane, LNG and CNG according to pressure and temperature

The Energy Density of Methane can thus be calculated by multiplying the density (in kg/m3) by the enthalpy of combustion in kJ/kg, and then juggling the energy units. A nice round number: the primary energy density of methane is 10 kWh/m3 at 1-bar and 20ºC, increasing with compression and liquefaction. CNG at 200-300 bar has around 30-60% of the energy density of gasoline, in kWh/m3 terms.

The energy density of methane is 10kWh/m3 as a nice rounded rule-of-thumb.

Clausius-Clapeyron: gas liquefaction?

Methane liquefies into LNG at -162ºC under 1-bar of pressure. The boiling points of other gases range from water at 100ºC, ammonia at -33ºC, CO2 at -78ºC, argon at -186ºC, nitrogen at -196ºC to hydrogen at -259ºC. This is all at 1-bar of pressure.

However, liquefaction temperatures rise with pressure, as can be derived from the Clausius-Clapeyron equation, and shown in the chart below. At 10-20 bar of pressure, you can liquefy methane into ‘pressurized LNG’ at just -105 – 123ºC, which can sometimes improve the efficiency of LNG transport. This can also help cryogenic air separation.

Density of gases
Boiling Points of Different Gases According to the Clausius Clapeyron Relationship

Density of CO2: strange properties?

The Density of CO2 is 1.87 kg/m3 at 20ºC and 1-bar of pressure, which is 45% denser than air (chart below). But CO2 is a strange gas. It cannot exist as a liquid below 5.2 bar of pressure, sublimating directly to a solid. CO2 can also be liquefied purely by compression, with a boiling point of 20-80ºC at 30-100 bar of pressure.

Density of Gas
Density of CO2 according to pressure and temperature in kg per m3

Hence often the disposal pipeline in a CCS or blue hydrogen value chain may often be pumping a liquid, rather than flowing a gas. And finally, these properties of CO2 open the door to surprisingly low cost CO2 transport by truck or in ships. This is all just physics.

Super-critical fluids: fourth state of matter?

There is also a fourth density state for all of the gases in the data-file. Above their critical temperature and critical pressure, fluids ‘become super-critical’. Sometimes this is described as ‘having properties like both a gas and liquid’. Mathematically, it means density starts rising more rapidly than would be predicted by the Ideal Gas Equations.

Super-critical gases behave unpredictably. Their thermodynamic parameters cannot be derived from simple formulae, but rather need to be read from data-tables and/or tested experimentally. This is why the engineering of supercritical systems tends to involve supercomputers.

Examples of super-critical gases? Steam becomes supercritical above 218-bar and 374ºC. CO2 becomes supercritical about 73-bar and 32ºC. Thus CO2 power cycles inevitably endure supercriticality.

Energy density of hydrogen lags other fuels?

The Density of Hydrogen is 0.08 kg/m3 at 20ºC and 1-bar of pressure, which is very low, mainly because of H2’s low molar mass of just 2g/mol. Methane, for example, is 8x denser. CO2 is 20x denser. In energy terms, gasoline is 3,000x denser per m3.

Hence hydrogen transportation and storage requires demanding compression or liquefaction. Tanks of a hydrogen vehicle might have a very high pressure of 700-bar, to reach a 40kg/m3 (the same density can be achieved by compressing methane to just 50-bar!). Liquefied hydrogen has a density around 70kg/m3 (LNG is 6x denser).

The density of hydrogen is just 0.08 kg/m3 at 20ºC of temperature and 1-bar of pressure

The energy density of hydrogen, in kWh/m3 also follows from these equations. At 1-bar and 20ºC, methane contains 3x more energy per m3 than hydrogen. Under cryogenic conditions, it contains 2x more energy. Under super-critical and ultra-compressed conditions, it contains 4x more.

The energy density of hydrogen is 50-75% lower than natural gas, even after compression/liquefaction

Data into the energy density of gases?

Similar energy density challenges constrain the use of ammonia as a fuel, as tabulated in the data-file, contrasted with other fuels, and discussed in our research note here.

This data-file allows density charts — in kg/m3 and in kWh/m3 — to be calculated for any gas, using the Ideal Gas Laws and the Clausius-Clapeyron equations. The data-file currently includes methane, CO2, nitrogen, ammonia, argon, water and hydrogen.

Hydrogen evolution: outlook for industrial gases?

hydrogen outlook

110MTpa of hydrogen is produced each year, emitting 1.3GTpa of CO2. We think the market doubles to 220MTpa by 2050. This is c60% ‘below consensus’. Decarbonization also disrupts 80% of today’s asset base. Our outlook varies by region. This 17-page note explores the evolution of hydrogen markets and implications for industrial gas incumbents?

Global hydrogen supply-demand: by region, by use & over time?

Global hydrogen supply

Global production of hydrogen is around 110MTpa in 2023, of which c30% is for ammonia, 25% is for refining, c20% for methanol and c25% for other metals and materials. This data-file estimates global hydrogen supply and demand, by use, by region, and over time, with projections through 2050.


Global production of hydrogen is 110MTpa in 2023, of which c30% is for ammonia, 25% is for refining, c20% for methanol and c25% for other metals and materials (e.g., hydrogen peroxide) (chart below).

Many commentators also see a growing role for hydrogen meeting global energy demand. Although we have been more cautious over the costs, practicalities and other competition for high-quality clean energy. Especially in a world that is substantially short of primary energy to make hydrogen through 2030.

Global hydrogen production most likely emits 1.3GTpa of CO2 today, with an average CO2 intensity of 12 tons/ton, comprising 85MTpa of grey hydrogen emitting 9 tons/ton of CO2 and 25MTpa of black hydrogen emitting 25 tons/ton of CO2.

The purpose of this global hydrogen supply model is to project out global hydrogen supply demand through 2050, as a function of our outlooks for refineries, basic chemicals, other metals and materials, energy and global decarbonization.

From this, we can calculate how much disruption lies ahead for the industrial gases industry? For blue hydrogen (or turquoise hydrogen), what volume of input natural gas is required in bcfd, and how much CO2 must be disposed of by the midstream industry?

For green hydrogen, how much electricity will be used to produce green hydrogen, and other e-fuels, by region, and over time?

To build up our forecasts, the data-file captures hydrogen production by region in the US, Europe, Canada, Japan, Australia, LatAm, China, India, Other Asia and Africa. All estimated from 1990 to 2050.

Global hydrogen supply
US-hydrogen-supply-and-demand-by-end-use-and-by-source-with-decarbonization-roadmap-to-2050

The outlook is uncertain which means it can be useful to compare different scenarios, via a model. Assumptions in this data-file can be stress-tested by adjusting the cells marked in yellow. Including the share of black, grey, blue and green hydrogen in the future energy mix, by region.

Plug power: green hydrogen breakthroughs?

Plug Power technology review

Our Plug Power technology review is drawn from the company’s recent patent filings, which offer some of the most detailed disclosures we have ever seen into the manufacturing of PEM electrolysers and fuel cells, underlying catalyst materials, membranes and their manufacturing. One patent seems like a breakthrough. Other patents candidly presented challenges for scaling up green hydrogen and raised questions for us.


Plug Power is a green hydrogen company, founded in 1997, headquartered in New York, with 3,350 employees and c$5bn market cap in mid-2023.

Plug Power is aiming to scale up as a world-leading supplier for $20bn pa of equipment and services across the end-to-end green hydrogen ecosystem by 2030: from electrolysers, to logistics, to energy generation in fuel cells, and niche applications such as forklift trucks (where it has an incumbent position, underpinning c30% of 2023’s revenue targets).

For an overview of how a Proton Exchange Membrane electrolyser works, we have written a short article here. We have not been able to de-risk much green hydrogen in our roadmap to net zero, due to challenges of cost, efficiency, degradation and practicality, as catalogued here.

But on the other hand, Plug Power’s share price has declined by 85% from its 2021 peak, and the purpose of our patent reviews is to stress test our pre-existing conclusions, to see what we could be missing.

Overall the patent library was very broad ranging (chart below), and raised some question marks for us around where the ‘focus’ and ‘moat’ really are in the business. More discussion in the data-file.

Plug Power technology review
Recent patents filed by Plug Power reange across electrolyser, fuel cells, hydrogen logistics, vehicles and balance of plant

Half a dozen recent patents may offer some support to Plug’s mass manufacturing ambitions. Some of these patents contain the most detail we have ever seen on how electrolyser membranes are manufactured, how anode catalysts are synthesized, materials used in different components of a fuel cell stack, and where the pinch points currently are in manufacturing.

The most exciting Plug patent that crossed our screen during this review discusses a ‘dry’ manufacturing process for PEM electrolyser membranes, unlocking lower uses of precious metals (especially platinum) and thinner membranes at higher temperatures, which in turn could improve output and efficiency, and thus deflate electrolyser costs (details in the data-file).

Plug Power technology review
Thinner-and-higher-temperature-membranes-allow-for-higher-current-density-at-electrolysers

Generally the patents did not contain the same focus on avoiding degradation, as for example, the recent patent library from Bloom Energy.

Further details and conclusions that stood out to us from our Plug Power Technology Review are available in the data-file.

MIRALON: turquoise hydrogen breakthrough?

MIRALON technology

MIRALON is an advanced material, being commercialized by Huntsman, purifying carbon nanotubes from the pyrolysis of methane and also yielding turquoise hydrogen. The material has multiple uses in energy transition. This data-file reviews the MIRALON technology, patents, and a strong moat. Our base case model sees 15% IRRs if Huntsman reaches a medium-term target of bringing MIRALON costs down to $10/kg.


“When we succeed at the kiloton scale, MIRALON will be a name that everyone knows”. This comment was made on a recent Huntsman podcast, describing a novel technology for pyrolysing methane, producing a carbon nanotube-based material (MIRALON) and a byproduct stream of turquoise hydrogen.

This data-file is our MIRALON technology review, based on assessing c45 patent families going back to 2004 and continuing through 2023. In our view, there are clear process innovations behind MIRALON, including methods for controlling the methane pyrolysis reaction, purifying the carbon nanotube product and regenerating the catalyst.

MIRALON fibers are 1mm long, 3-15nm wide, 25x stronger than steel, with similar performance characteristics to carbon fiber (similar strength, higher flexibility, but conductive and dissipating static charges) and other advanced materials.

Commercialization. A 1Tpa micro-plant has been running in Merrimack, New Hampshire in 2021. A 30Tpa pilot plant is being constructed in Texas in 2023. And a multi-kTpa scale reactor will follow. MIRALON was already used in the Juno space mission, while future applications are seen in battery binders, composites, electric vehicles, steel and cement.

Clean hydrogen? Huntsman and ARPA-E have said that CO2 intensity of the resultant hydrogen from the MIRALON process will be 90% below SMR hydrogen (i.e., below 1 ton/ton), which should open up access to $1/kg of 45V incentives under the IRA. Future formulations derived from gas that would otherwise have been flared, landfill gas or biogas could be deemed carbon negative.

Economics. We have updated our turquoise hydrogen models with a tab estimating the costs of the MIRALON process (chart below). Our base case sees 15% IRRs if Huntsman reaches its targets of deflating costs to $10/kg including $1/kg hydrogen and $1/kg IRA incentives. You can stress test inputs, outputs and pricing in our turquoise hydrogen model.

MIRALON technology
Economic costs of producing MIRALON

Huntsman is a chemicals company, headquartered in Texas, which IPO’ed in 2005, operates 70 production facilities in 30 countries, generated $8.4bn of revenues in 2022 and $1.2bn pa of adjusted EBITDA. The company has featured in our research into polyurethanes, carbon fiber, resins and niche mining chemistries.

Our conclusions on the MIRALON technology, the moat around the patents, the key process innovations and the remaining challenges are in this data-file linked below.

Bloom Energy: solid oxide fuel cell technology?

Bloom Energy fuel cell technology

This data-file reviews Bloom Energy’s solid oxide fuel cell technology. What surprised us most was a particularly candid overview of the degradation pathways of solid oxide fuel cells, a focus on improving the longevity of fuel cells, albeit this sometimes seems to be via heavy uses of Rare Earth metals, and increasing complexity. The specificity of the patents does suggest a moat around Bloom Energy fuel cell technology.


Bloom Energy is a leading manufacturer of solid oxide fuel cells, founded in 2001, headquartered in San Jose, California with 1,700 employees, $1.2bn pa of revenues and $3.1bn market cap at the time of this patent assessment in August-2023. Fuel cells matter as we see an increasing need for clean, small-scale generation in the energy transition (note here).

How does a solid oxide fuel cell work? A solid oxide fuel cell draws in air at the cathode, where oxygen ‘gains electrons’ and reduces to yield oxide ions. These oxide ions pass through the electrolyte of the cell towards the anode. At the anode, a fuel oxidizes, surrendering electrons to complete the electrical circuit, then reacts with oxide ions.

What materials are used in solid oxide fuel cells? Electrolytes for solid oxide fuel cells tend to involve stabilized zirconias, such as yttria-stabilized zirconia (YSZ) although Bloom also uses scandia-stabilized zirconia (SSZ or ScSZ). The anode is commonly made of nickel-YSZ cermet. The cathode is often Lanthanum Strontium Manganite (LSM) (or similar). And the metallic interconnects between adjacent cells in a fuel cell stack tend to comprise high-grade chromium alloys.

Why are solid oxide fuel cells so hot? One of Bloom Energy’s patents notes the importance of cubic SSZ as an electrolyte. However, below 580C, this material undergoes a cubic-to-rhombohedral phase transition. Fuel cells run at 650-850C because these high temperatures are needed to open up crystalline electrolyte configurations that enable oxygen permeability.

What are the costs of fuel cells? Capex costs of fuel cells are a challenge, modeled here and here, and Bloom has disclosed production costs in the range of $2,500-4,000/kW from 2017 to 2023 (margins come on top). Materials are a key reason for high costs. Especially scandium. Bloom Energy is sometimes quoted as being the largest scandium consumer in the world (examples here and here). Scandia costs have ranged from $1,000-5,000/kg. Other Rare Earths mentioned in Bloom’s patents include Lanthanum, Yttrium, Cerium, Ytterbium, Samarium and Gadolinium.

What degradation rates for fuel cells? The other key challenge for fuel cells is longevity. We have tracked 160 historical fuel cell deployments in the US (data here), which have tended to see their output decline by 5% per year on average, and most have been retired after an average of c10-12 years.

Does Bloom Energy’s technology help to avoid degradation? The purpose of this data-file is to review patents filed by Bloom Energy, for explanations of why solid oxide fuel cells degrade, and what technology has been developed to address this. The patents we reviewed give very good, clear and candid details into degradation drivers. A table in the data-file explains each one, and how Bloom’s patents address it.

Bloom Energy fuel cell technology
Reasons for solid oxide fuel cell degradation considered in Bloom Energy patentes

The analysis does, however, raise an important question about the trajectory of future fuel cell costs, which is also discussed in the data-file.

Does Bloom Energy have an edge in solid oxide fuel cell technology? The data-file also assessed Bloom’s patents using our usual framework. Generally, the patents are specific, high-quality, and make it unlikely that any other SOFC producer will be able to encroach about Bloom’s IP. Some useful details are disclosed over materials and manufacturing methods. Although we also have an observation about focus shifting.

Copyright: Thunder Said Energy, 2019-2024.