Global plastic demand: breakdown by product, region and use?

Global plastic demand

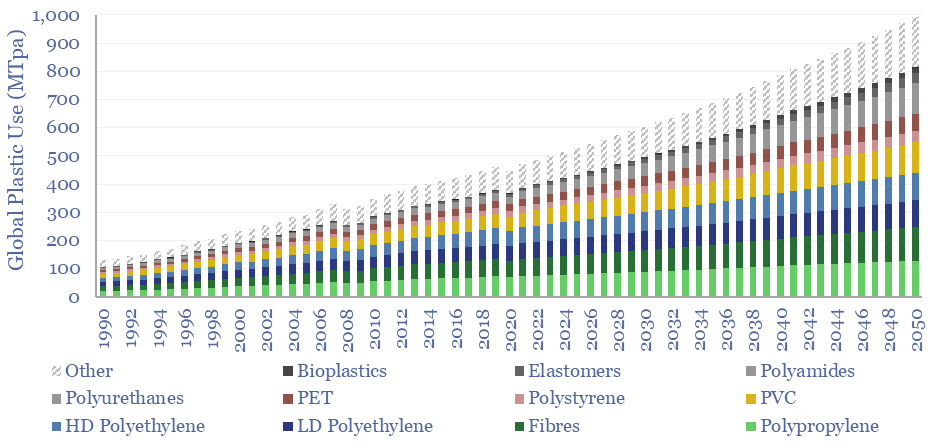
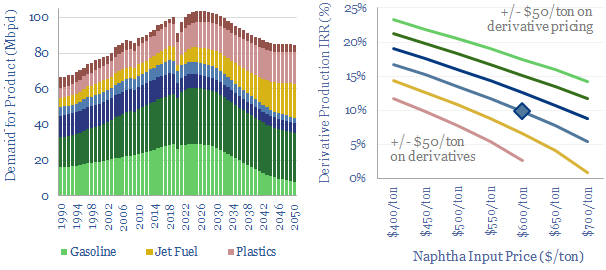
Global plastic is estimated at 470MTpa in 2022, rising to at least 800MTpa by 2050. This data-file is a breakdown of global plastic demand, by product, by region and by end use, with historical data back to 1990 and our forecasts out to 2050. Our top conclusions for plastic in the energy transition are summarized below.


Global plastic demand is estimated at 470MTpa in 2022. For perspective, the 100Mbpd global oil market equates to around 5bn tons per year of crude oil, showing that plastics comprise almost 10% of total global oil demand.

Global plastic demand by region. The top billion people in the developed world comprise 12% of the world’s population, but 40% of the world’s plastic demand. We see developed world plastics demand running sideways through 2050, while emerging world demand doubles from 300MTpa to 600MTpa (charts below).

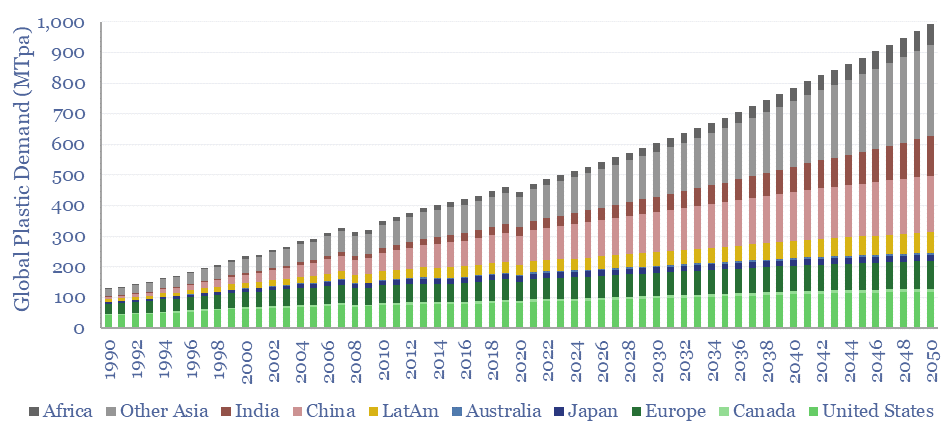
Global plastic demand CAGR? Our numbers are not aggressive and include a continued deceleration in the total global demand CAGR, from 7.5% pa growth in the twenty years ending in 1980, to 6% pa in the twenty years ended 2000, to 3.3% pa in the twenty years ended 2022 and around 2% pa in the decade ended 2050.

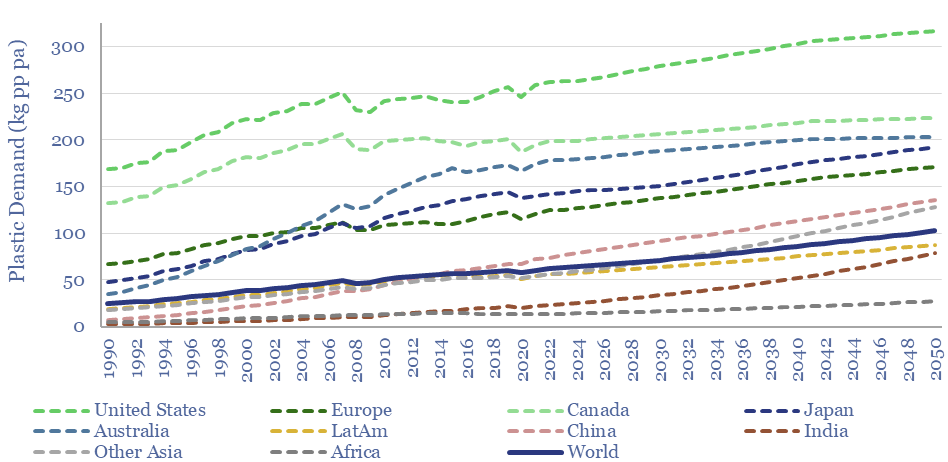
Global plastic consumption per capita. Our numbers include an enormous policy push against waste in the developed world, where consumption today is around 170 kg of plastics per person per year, and projected to decline gently to 160 kg pp pa by 2050. Conversely, plastic demand in the emerging world is 75% lower and averages 40 kg pp pa today, seen rising to 70 kg pp pa by 2050.

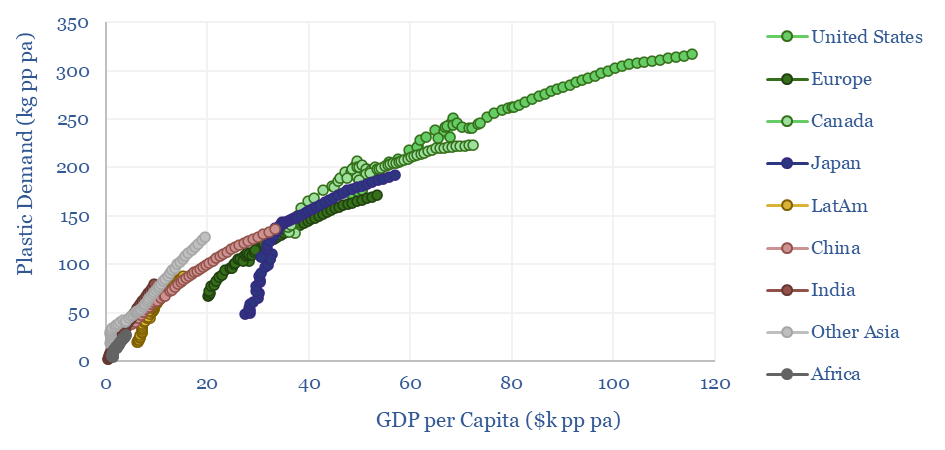
Upside to plastics demand? What worries us about these numbers is that they require historical trends to shift rapidly. Historically, each $k pp pa of GDP is associated with 4kg pp pa of plastic demand. But our numbers assume declining demand in the developed world and slowing demand in the emerging world (chart below).

Please download the model to stress-test your own variations, but there are conceivable scenarios where global plastic demand surpasses 1GTpa by 2050. Underlying inputs are drawn from technical papers, OECD databases and Plastics Europe. The forecasts are our own.

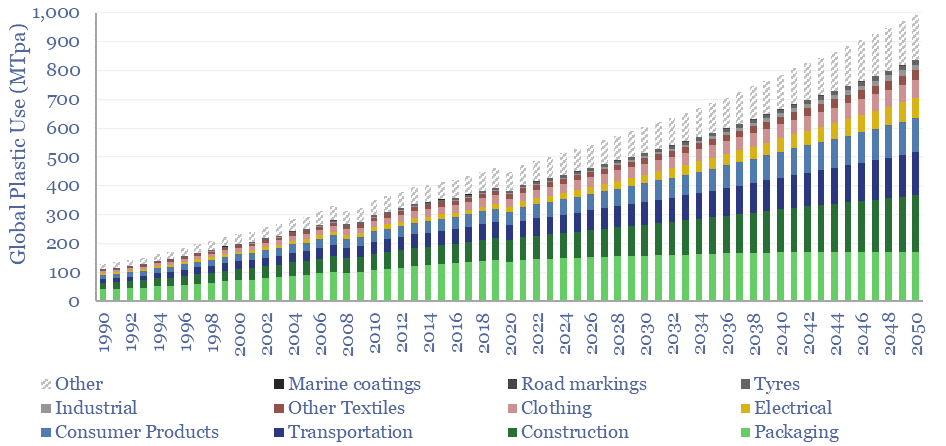
Plastic demand by end use is broken down in the chart below. 35% of today’s plastics are used as packaging materials, 17% as construction materials and c10% for textiles.

The strongest growth outlook is in electrical products (currently 7-9%) and light-weighting transportation. There are few alternatives to plastics in these applications. Conversely, for packaging materials, we see more muted growth, and more substitution towards bioplastics and cellulose-based products from companies such as Stora Enso.

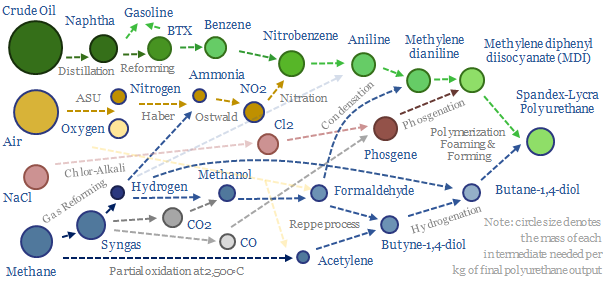
Upside for plastics in the energy transition is especially important, with plastics used in important components of the energy transition, from EVA encapsulants used in solar panels, to the resins used in wind turbine blades, to strong and light-weight components in more efficient vehicles, to polyurethane insulating materials surrounding substantively all electric components, batteries and vehicles. Of particular note are fluorinated polymers, where the C-F bond is highly inert, and helps resist degradation in electric vehicle batteries.

Plastic demand by material is broken down in the chart below. Today’s market is c20% polypropylene, c15% LDPE, and other large categories with >5% shares include HDPE, PVC, PET, Polyurethanes and Polystyrenes. We think the strongest growth will be in more recyclable plastics, materials linked to the energy transition, and next-gen materials that underpin new technologies such as additive manufacturing.

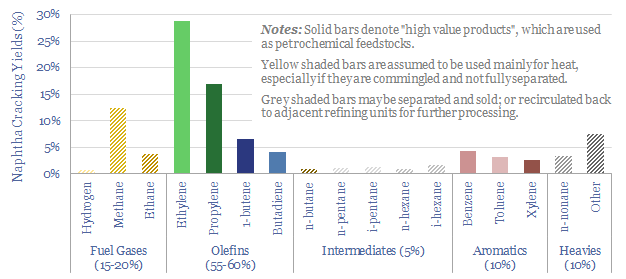
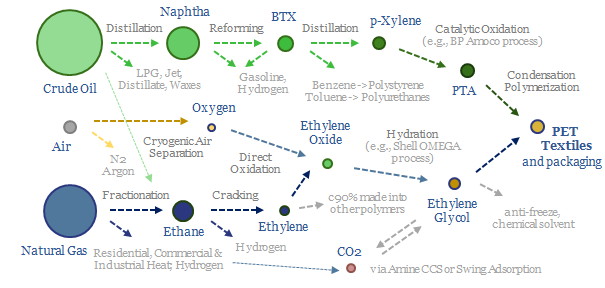
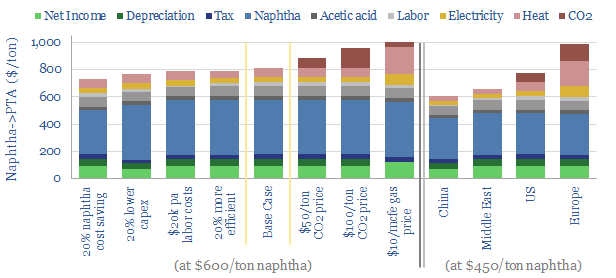
Feedstock deflation is likely to be a defining theme in the energy transition, as many polymers draw inputs from the catalytic reforming of naphtha. Today, 70% of BTX reformate is blended into gasoline, but we see this being displaced by the rise of electric vehicles, with particular upside for the polyurethane value chain.

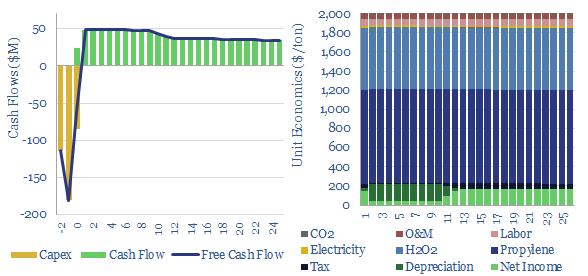
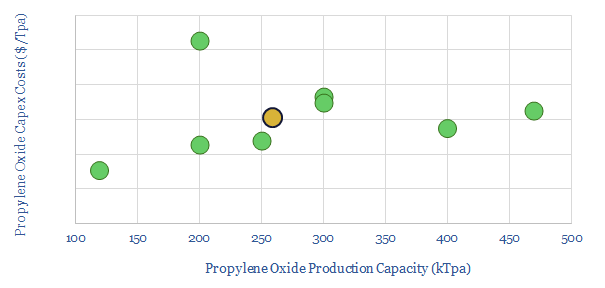
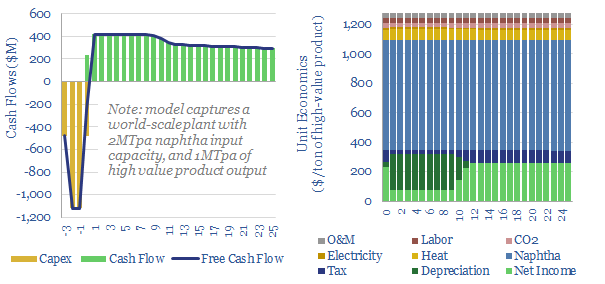
Decarbonizing plastic production is also a topic in our research. As a starting point, our ethane cracker model is linked here, and our economic model for converting olefins into polymers is here. CO2 intensity of different plastics from different facilities is tabulated here.

Plastic recycling. We also see potential for plastic-recycling technologies to displace 8-15Mbpd of potential oil demand growth (i.e., naphtha, LPGs and ethane) by 2060, compared to a business-as-usual scenario of demand growth. All of our plastic recycling research is linked here. After a challenging pathway to de-risking this technology, we see front-runners emerging, such Agilyx, Alterra and Plastic Energy.

Polymers and higher olefins: the economics?

Costs of producing polyethylene and polymers

This data-file captures the economics of polymerizing or oligomerizing unsaturated feedstocks (such as ethylene), in order to make plastics and higher olefins.


Our base case for producing high density polyethylene (HDPE) from ethylene requires pricing of $1,250/ton for a 10% IRR on a new greenfield plant.

CO2 intensity runs at 0.3 tons of CO2 per ton of product, and can be c80-90% lower than the prior step of ethane cracking.

However conditions can vary vastly, from 50-300C and 50-25,000 psi, for different polymers and processes. Different options can be stress-tested in the model, backed up by technical data, past projects and our notes.

Construction materials: a screen of costs and CO2 intensities?

Energy and CO2 costs of construction materials

This data-file compares different construction materials, calculating the costs, the embedded energy and the embedded CO2 of different construction materials per m2 of wall space.


The file captures both capex and opex: i.e., the production of the materials and the ongoing costs associated with heating and cooling, as different materials have different thermal conductivities.

Covered materials include conventional construction materials such as concrete, cement, steel, brick, wood and glass, plus novel wood-based materials such as cross-laminated timber. Insulated wood and CLT are shown to have the lowest CO2 intensities and can be extremely cost competitive.

The data-file also compares different insulation materials, including their costs, thermal conductivities (W/m.K) and the resultant energy economics of insulation projects.

Plastic Recycling Companies: pyrolysis and next-generation recycling?

This data-file assesses the outlook for 30 plastic recycling companies, including next-generation plastic recycling or pyrolysis. This group is operating  (or constructing) 100 plants around the world, which use chemical processes to turn waste plastics back into oil.


Post-use plastic can by pyrolysed back into feedstock or fuel, with 30% IRRs (economic model here), 60% lower CO2, 8Mbpd of LT oil savings (oil demand model here), less waste ending up in landfill (avoiding landfill taxes), or worst of all, ending up in the ocean. We first wrote about this theme in 2019

This data-file covers 30 plastic recycling companies, including the number of plants, locations, start-up years, input-types and capacities for each plant. We also include our own notes, our assessments of each company’s technology, and a summary of news flow.

The data-file has been updated in 2023, revising our rankings, and concluding that the industry is ‘on track’ for the game-changing scale-up originally foreseen in our 2019 research note (here), some of the progress along the way is noted here, although please note, the industry’s progress is not “a straight line”.

Six companies stand out in the screen, have built working plants allowing us to de-risk the technology and are now in the scale-up phase. Five are private and one is public. In the best cases, data from 2-3 years of successful operation are available, and receive positive comments as new license agreements are signed.

However a recent observation is that de-risking new technologies tends to proceed slowly; emerging industries seem to segment among a few leaders, while the majority of companies run the gauntlet of delays, technology frustrations and regulatory issues.

About 65% of the companies in our data-file have made less progress than originally hoped in 2019. Most often, this means development delays. Others have simply not worked (e.g., one commercial reactor could not pyrolyse contaminated cling films, was shut, and the waste plastics were instead sent for incineration at a cement plant).

We have profiled some of the plastic recycling companies in more depth, by reviewing their patents, such as Agilyx, Pure Cycle and Carbios. Other opportunities for hydrocarbon-based materials are summarized in our plastics research.

Make CO2 into valuable products?

Make CO2 into valuable products

This data-file is a screen of 27 companies, which are turning CO2 into valuable products, such as next-generation plastics, foams, concretes, specialty chemicals and agricultural products.


For each company, we have assessed the commercial potential, technical readiness, partners, size, geography and other key parameters. 13 companies have very strong commercial potential. 10 concepts are technically ready (up from 8 as assessed in mid-2019),  6 are near-commercial (up from 5 in mid-2019), while 13 are earlier-stage.

A detailed breakdown is also provided for the opportunity to use CO2 enhancing the yields of commercial greenhouses (chart below).

The featured companies include c21 start-ups. But leading listed companies include BP (as a venture partner), Chevron Phillips, Covestro, Repsol, Shell, TOTAL (as a venture partner) and Saudi Aramco.

TOTAL’s Plastic-Recycling Progress?

TOTAL plastic recycling progress

TOTAL is currently pioneering the greatest advances in plastic-recycling technologies among the Majors, based on our database of 3,000 patents.

This data-file covers the comprehensive mixing of chromium-catalysed polyethylene, to reduce defects and increase the strength of post-consumer resins. In turn, this extends their use to films, containers and pipes.

Four different measures of defect rates are correlated with four different extrusion methodologies.

The file also includes a summary of TOTAL’s plastic recycling patents. Overall it should be possible to uplift plastic recycling margins by $50-100/ton.

We remain most excited, however, by plastic pyrolysis, being pioneered by smaller companies, to turn plastic back into oil.

Oil Companies Drive the Energy Transition?

Disrupt Agriculture Energy Opportunities

There is only one way to decarbonise the energy system: leading companies must find economic opportunities in better technologies. No other route can source sufficient capital to re-shape such a vast industry that spends c$2trn per annum. We outline seven game-changing opportunities. Leading energy Majors are already pursuing them in their portfolios, patents and venturing. Others must follow suit.

Thermo-Plastic Composite: The Future of Risers?

cost of using Thermo Plastic Composite

We have estimated the costs of a subsea riser system, for a typical deep-water project; and the potential cost-reduction that can be achieved by using ThermoPlastic Composite Pipe instead (e.g., Airborne, Magma). Savings should be around c45%, or c$20M/riser. Our data-file also includes the order-history to-date for TCP: by project, operator, and geography (below).

Turn the Plastic Back into Oil

monetising waste plastic

Due to the limitations of mechanical recycling, 85% of the world’s plastic is incinerated, dumped into landfill, or worst of all, ends up in the oceans. An alternative, plastic pyrolysis, is on the cusp of commercialisation. We have assessed twenty technology solutions. This nascent opportunity can turn plastic back into oil, generate >30% IRRs on investment, and could displace 15Mbpd of future oil demand.

Plastic pyrolysis delivers strong economics?

converting waste-plastic into oil

>30% IRRs should be attainable converting waste-plastic back into oil, based on disclosures from technology-leaders in the sector. This economic model allows for stress-testing of product prices, input costs, gate fees, capex, opex, utilisation and fiscal regimes.

Copyright: Thunder Said Energy, 2019-2023.