…Republic of)ThailandTimor-LesteTogoTokelauTongaTrinidad and TobagoTunisiaTurkeyTurkmenistanTurks and Caicos IslandsTuvaluUgandaUkraineUnited Arab EmiratesUnited KingdomUnited StatesUnited States Minor Outlying IslandsUruguayUzbekistanVanuatuVatican City StateVenezuela (Bolivarian Republic of)Viet NamVirgin Islands (British)Virgin Islands (U.S.)Wallis and FutunaWestern SaharaYemenZambiaZimbabwe Anything else?…
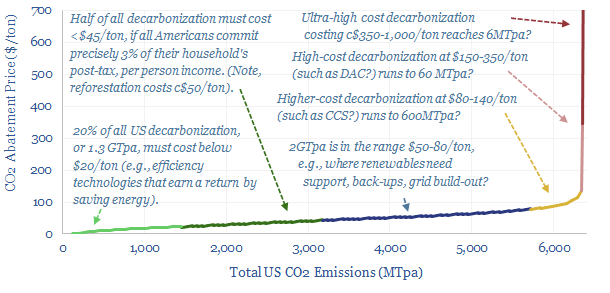
…data-file is to quantify how CO2 abatement costs might end up being distributed, if they follow the income distribution in a typical, large, wealthy country such as the United States….
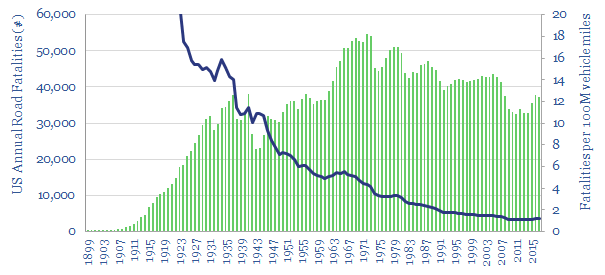
…the time of writing, the United States has been hardest hit by the COVID crisis out of any country in the world. It has incurred c35,000 fatalities. However, in the…
…Greece, Hong Kong, India, Indonesia, Italy, Japan, Korea, Mexico, Netherlands, New Zealand, Nigeria, Norway, Poland, Portugal, Romania, Russia, South Africa, Spain, Sweden, the United Kingdom, the United States and Vietnam….
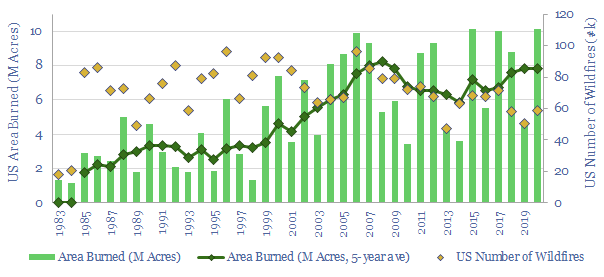
…burning every year, and the total toll of wildfires may be as large as 25% of global anthropogenic CO2. In the United States, 2020 saw 10.1M of acres burning in…
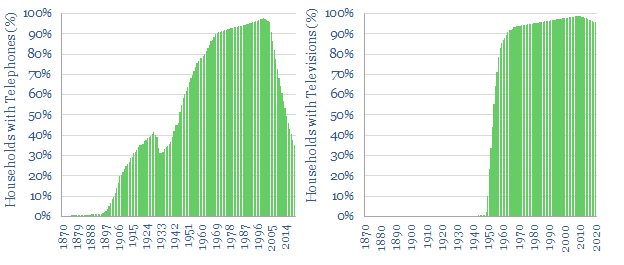
This technology transition database plots the adoption rates for twenty technologies that transformed living standards around the United States, year-by-year, from 1870 to 2020. Adoption rates are more rapid for…
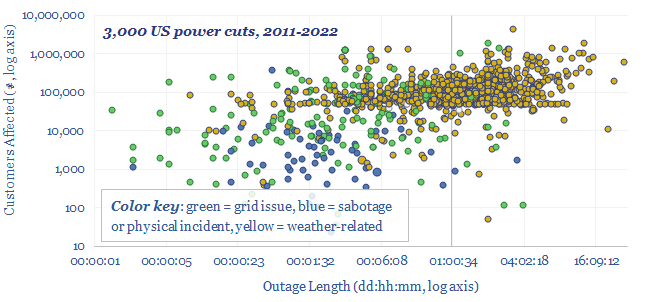
This data-file aggregates significant US power grid disruptions, based on data from the DOE. On average, there are 250 power cuts per year in the United States, lasting for a…
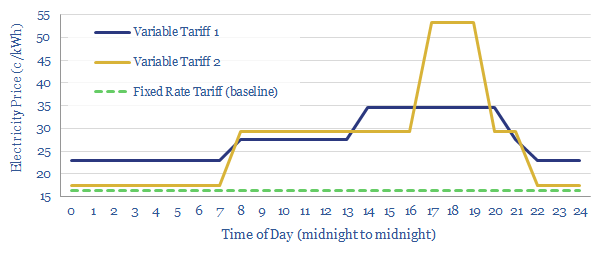
This data-file tabulates the impacts of variable electricity tariffs, after switching 4.622 households over from fixed electricity tariffs, across a large-scale sample in the United States. This theme is increasingly…
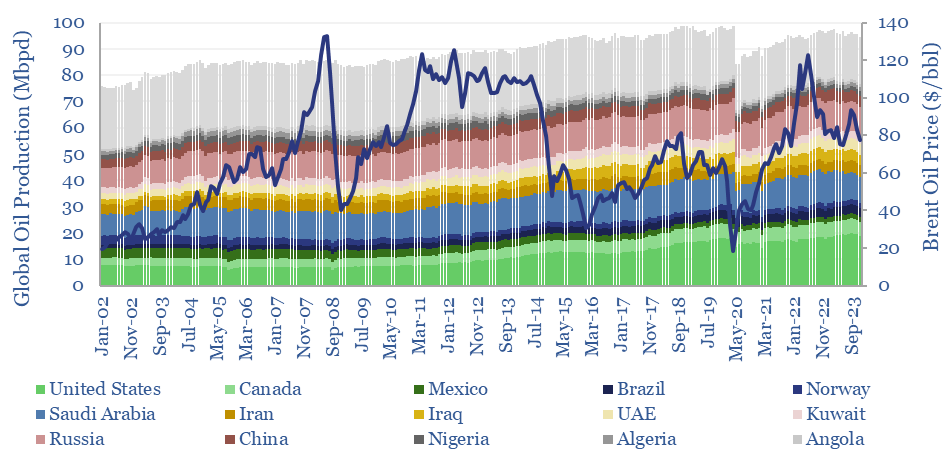
…5Mbpd of production comprise 50% of the global oil market (the United States, Saudi Arabia, Russia and Canada). Global oil production has grown by almost +1Mbpd per annum over the…
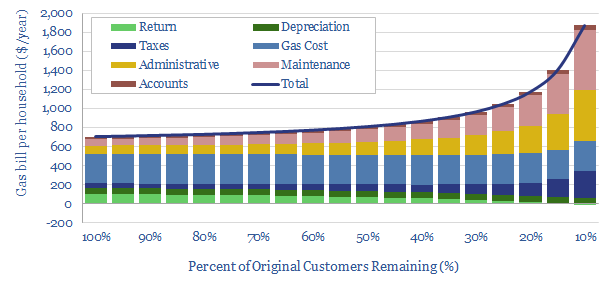
…if the number of customers falls. For example, a recent technical paper has evaluated 250 shrinking utilities in the United States, over several years, concluding that customer losses tend to…