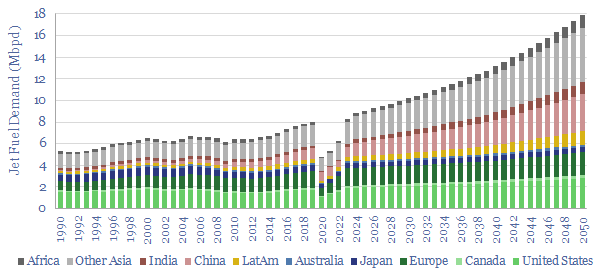
Jet fuel demand ran at 8Mbpd in 2019, the last year before COVID, and could rise to 18Mbpd by 2050, as global population rises 25%, jet fuel use per capita doubles and fuel economy per aviation mile rises by 20%. This data file breaks down jet fuel demand by region, including our forecasts through 2050, which can be stress-tested, and feed into our global oil demand models.
Decarbonizing aviation is challenging because of the requirement for very energy dense fuels. Jet fuel might reach 12,000 Wh/kg, while batteries today are 250 Wh/kg and will at best reach 1,250 Wh/kg (data here). We have evaluated sustainable aviation fuels, such as renewable jet, biogas-to-liquids, bio-ethanol-to-jet and e-fuels, but generally find them to be very expensive, hard-to-scale and less thermodynamically efficient than other uses of the same feedstocks. We still think the most practical and low cost option to decarbonize aviation will end up being through nature based solutions.
So how much jet fuel demand is likely to remain a part of global oil demand? This data-file aims to build up a model, looking region by region, as a function of population, GDP, miles per capita and fuel economy per passenger mile. You can stress test your own assumptions in the model. But our own observations follow below.
Conceptual side-note. Jet fuel demand data is a conceptual nightmare, due to very heavy skews and the global nature of travel. For example, if I am a European citizen, and I change planes in Johannesburg to go on a safari holiday, then that connecting plane will fuel up in Johannesburg, and my jet fuel demand will be counted as African jet fuel demand. If we then divide African jet fuel demand by the population of Africa, we will wrongly be ascribing my (European) travel behaviours to Africans. So please bear this in mind when considering the numbers below. Jet fuel demand is counted where planes refuel. Even if the passengers on that plane have come from other countries. Nevertheless, we think we can derive some useful forecasts for global jet fuel demand.
In 2019, 8Mbpd of jet fuel demand was made up of 7.7bn people in the world, travelling an average of 900 air miles per person (chart below), in a plane with an average fuel economy of 54 passenger miles per gallon.
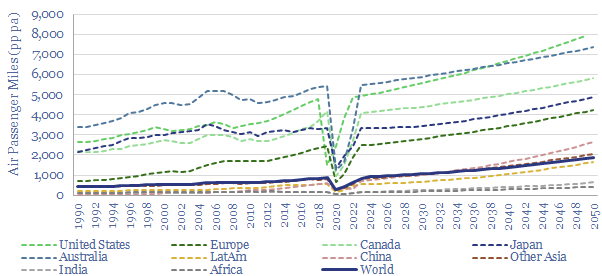
The data are heavily skewed. Even more so than when we quantify other global breakdowns such as passenger vehicles or plastics demand. “Frequent flyer” programs in the developed world cover individuals that fly over 35,000 miles per year, and thus many frequent flyers clock up over 1M miles over the space of their careers. Conversely, mean jet fuel demand per developed world citizen is 3,500 miles per year. Mean jet fuel demand per emerging world citizen averages 450 miles per year. Mean jet fuel demand per low-income country citizen (aka the ‘bottom 4bn’ people ranked by income) is 130 miles per year.
And even these averages are ‘bad averages’. 130 miles per year does not mean that 2-3 bn Africans and Indians are all taking 1 x 130-mile flight per year. The conceptual definitions above apply. And different estimates suggest that 80-95% of people on Planet Earth have never been on an airplane.
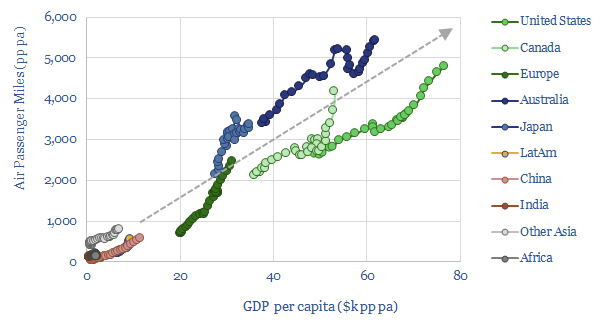
By 2050, 18Mbpd of jet fuel demand might consist of 9.5bn people (up 25% from 2019), travelling an average of 1,900 miles per year (up 2x from 2019, linked to rising incomes, chart below). But this is still a world where 8.5bn people in what is today the emerging world are travelling 1,400 miles per year, or 60% less than today’s developed world citizens, and 96% less than today’s frequent flyers.
On the other hand, efficiency and load factors will also continue rising, by c20%, to around 65 passenger miles per gallon. And this is factored into our numbers (chart below). The underlying efficiency of planes is increased by using light-weight materials (e.g., plastics, carbon fiber, additive manufacturing, advanced metals) and raising the T-max of Brayton Cycle turbines (including via super-alloys).
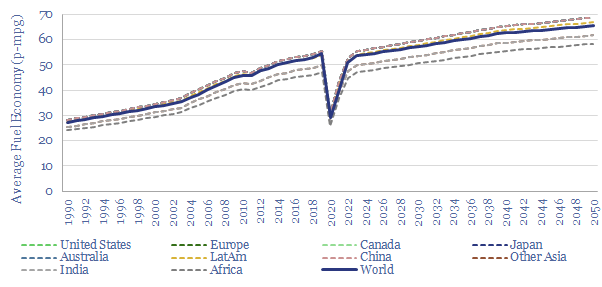
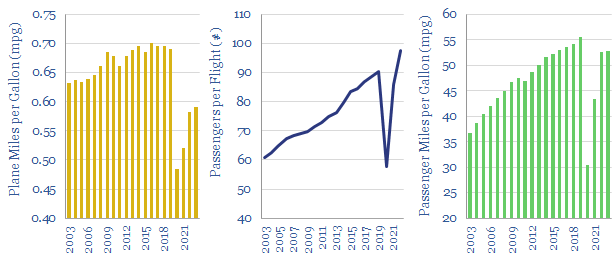
Helpful underlying data come from the US Bureau of Transport Statistics, to compute the fuel economy of US aviation, per plane-mile and per passenger-mile. In 2019, the last year before COVID, the data imply that 10M US flights carried an average of 110 passengers per flight an average distance of 1,700 miles per flight, at a fuel economy of 0.7 plane miles per gallon, which equates to 55 passenger miles per gallon. The numbers are skewed as the average international flight travels 7x further than the average domestic flight (7,000 miles versus 1,000 miles). The data charted below look distorted in 2020-22, because long-distance international flights were greatly curtailed, more so than domestic flights.
Please download the data-file to stress-test different inputs that matter for future jet fuel consumption, such as population growth, GDP per capita, travel miles per capita and fuel economy of passenger jets. Alternatively, these numbers feed into our global oil demand model, which can also be stress-tested.