Satellites: the spy who loved methane?
…contact us. Renewables slow-down: Could it be soooner? Another theme for 2020 is whether renewables growth will slow down, as heartland markets reach grid saturation. This was the precedent when…
the research consultancy for energy technologies
…contact us. Renewables slow-down: Could it be soooner? Another theme for 2020 is whether renewables growth will slow down, as heartland markets reach grid saturation. This was the precedent when…
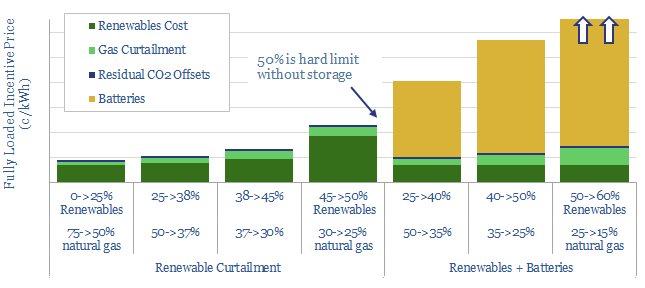
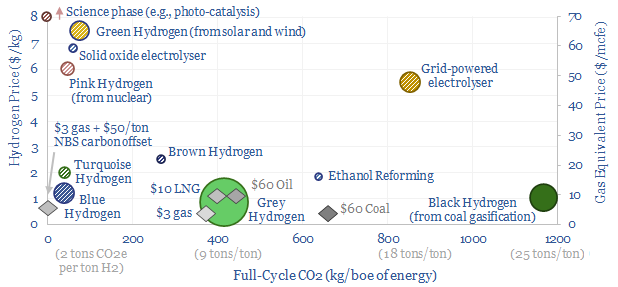
…further 2-5x to accommodate just 3-15% more renewables. The lowest-cost, zero-carbon power grid, we find, comprises c25% renewables, c25% nuclear and c50% decarbonized gas, with an incentive price of 9c/kWh….
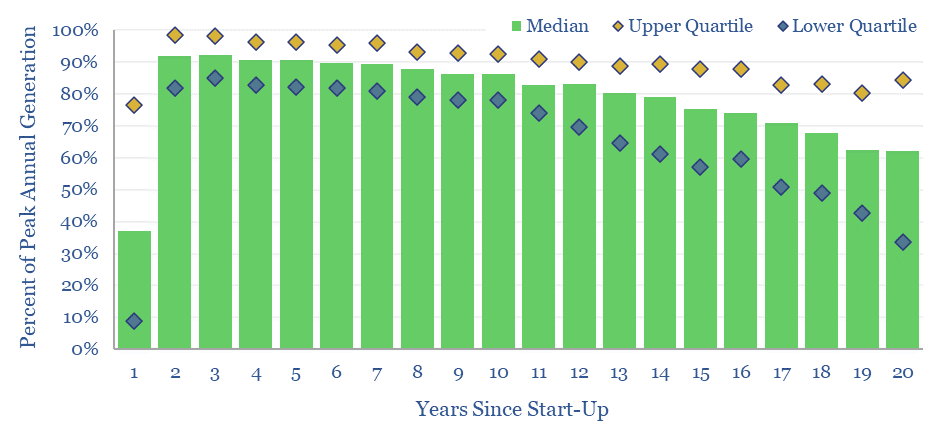
…to 20. However, the data are highly variable, as shown by the examples plotted below. Volatility does matter for the costs of integrating renewables, the ultimate share of renewables and…
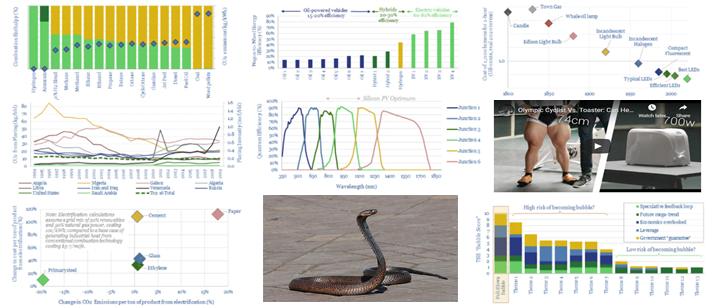
…transition. Renewables are so good that they practically break the second law of thermodynamics. Hydrogen is so poor that it halves the pace of energy transition. Industrial efficiency technologies are…
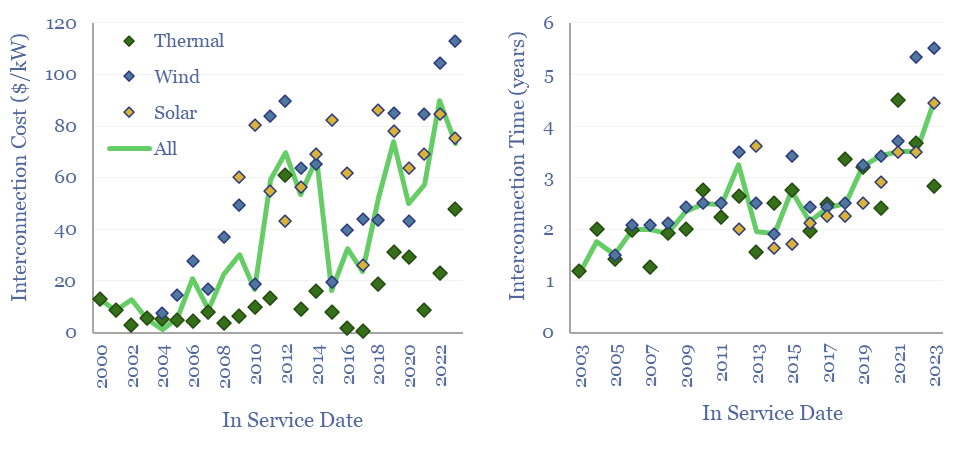
…costs, or $3-10/kW-km, over a typical distance of 10-70 km. But the requirement to fund network upgrade costs can push grid connections to cost more than developing renewables projects themselves?!…
…have displaced 100MWH of high-carbon electricity directly (e.g., from coal). And all the more so, amidst painful energy shortages. (5) Backing up renewables? It is often argued that renewables will…
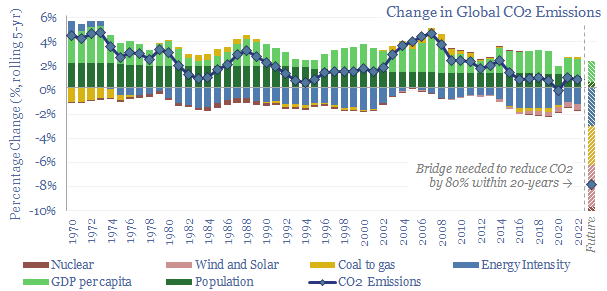
…population growth, +1.4% pa rising incomes, -1.4% pa efficiency gains, -0.5% renewables, 0% nuclear, +0.2% ramping back coal due to underinvestment in gas. Depressingly, progress towards net zero slowed in…
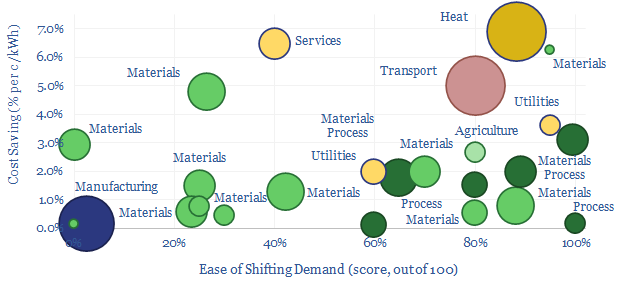
Some industries can absorb low-cost electricity when renewables are over-generating and avoid high-cost electricity when they are under-generating. The net result can lower electricity costs by 2-3c/kWh and uplift ROCEs…
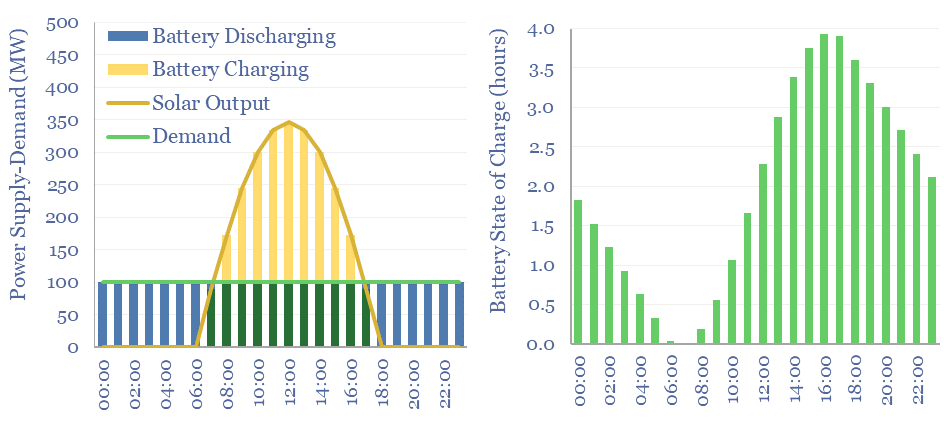
…timeframe. Then model how big a battery is required to move the renewables to align with the timing of the power demand curve. This data-file works through the maths, for…
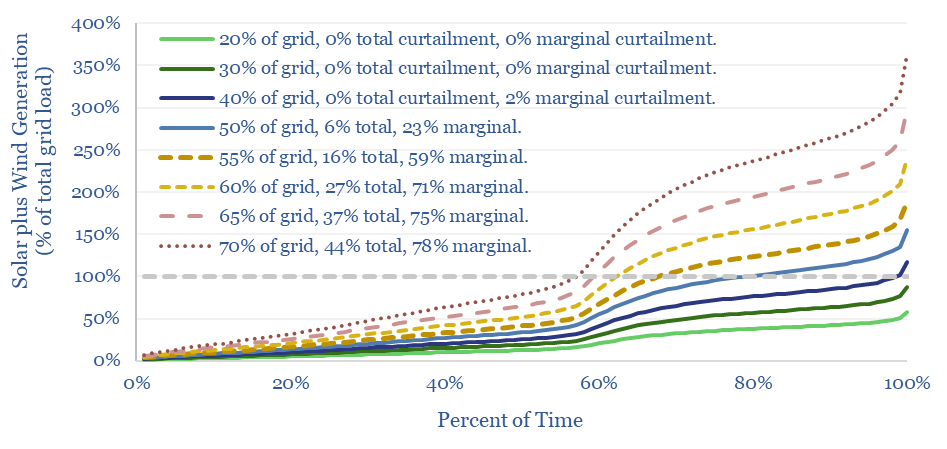
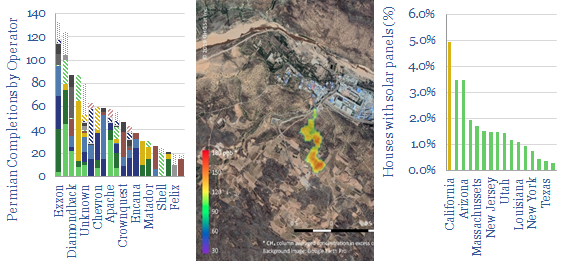
…solar heavy grids. This 12-page note draws conclusions from the statistical distribution of renewables’ generation across 100,000 x 5-minute grid intervals. $499.00 – Purchase Checkout Added to cart Wind and solar are…