CO2 compression: stranger things?

CO2 compression

CO2 is a strange gas. This matters as energy transition will require over 120 GW of compressors for 6GTpa of CCUS. This 13-page note explains CO2 compression and CO2’s strange properties. This helps to fine-tune appropriate risking factors for vanilla CCS, blue hydrogen, CO2-EOR, CO2 shipping and super-critical CO2 power cycles. There is a wide moat around leading turbomachinery companies.


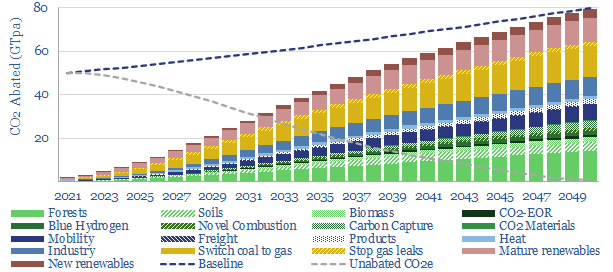
The objective of the energy transition is to meet the energy needs of human civilization, somewhere in the range of 120,000 TWH pa in 2050, while simultaneously eliminating net CO2 emissions, which could otherwise reach 80GTpa.

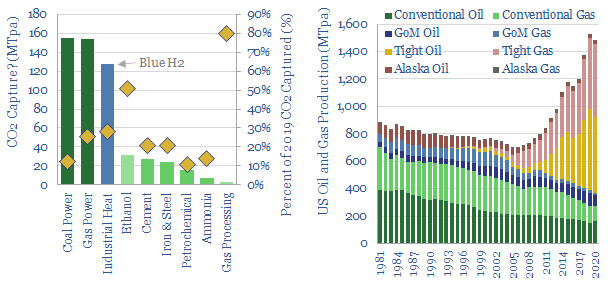
After four years of research, our roadmap to net zero includes 6GTpa of CCUS, a broad category that includes vanilla CCS, blue (and turquoise) hydrogen, novel power cycles like oxy-combustion, CO2-EOR and CO2-to-materials.

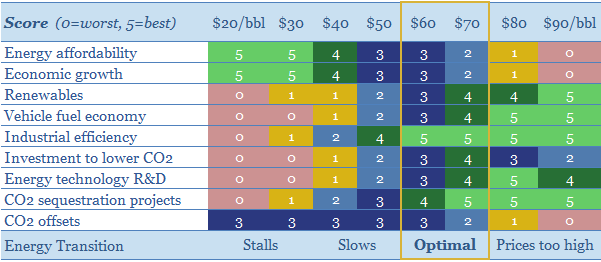
CO2 compression is required for almost all of these examples. Atmospheric pressure is 1-bar. The typical pressures involved in different CCUS applications above are explained on page 2.

The energy needed for CO2 compression is a function of input variables, such as mass, temperature, compressibility, heat capacity ratio and efficiency. This is captured in our compression models and explained on page 3.

But CO2 is strange. A CO2 molecule is not a billiard ball. This linear molecule has regions of negative and positive charge, and different acentricity versus other atmospheric gases (page 4).

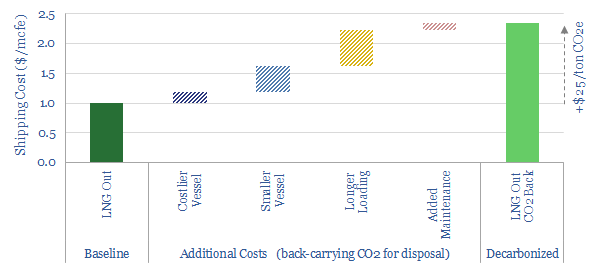
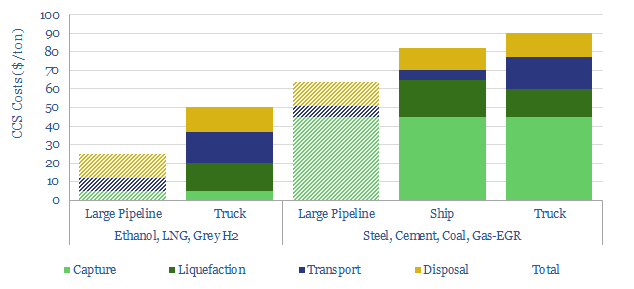
Liquid CO2 needs to be pressurized beyond 5.2-bar. This actually makes CO2 liquefaction for CO2 shipping or CO2 trucking up to 80% easier than for other gases (page 5).

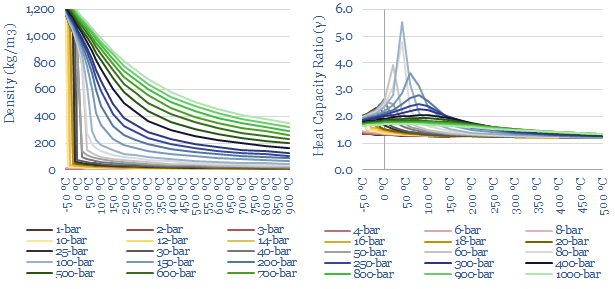
Densities are 2-10x higher than other gases, especially around/above pressures of 75-bar. This means turbomachinery, vessels and pipes for high-pressure CO2 can be smaller but likely also need to be more rugged versus other gases (page 6).

Wild fluctuations in Cp, Gamma and Compressibility occur. This makes the calculations for compressors and heat exchangers truly complex, which is worth understanding, in order to help with risking factors for novel CO2 technologies (pages 7-9).

The energy requirements for CO2 compression follow from the discussion on pages 3-9. I.e., what compression power (in MW) is required to take 1MTpa of CO2 and increase it to 5 – 200 bar of pressure? (page 10).

These complexities matter because they suggest a strong moat for leading companies in turbomachinery, and some other CO2 specialists. Three public companies stand out from technical papers and past projects, while others at the cutting edge are also discussed (pages 12-13).

Decarbonized gas: ship LNG out, take CO2 back?

Transport CO2 in LNG carriers

Can you transport CO2 in LNG carriers? This 14-page report explores an option to decarbonize global LNG: (i) capture the CO2 from combusting natural gas (ii) liquefy it, including heat exchange with the LNG regas stream, then (iii) send the liquid CO2 back for disposal in the return journey of the LNG tanker. There are some logistical challenges, but no technical show-stoppers. Abatement cost is c$100/ton.


Natural gas is the lowest-carbon fossil fuel, with 50% lower CO2 intensity than coal. The world is currently reeling from gas shortages. Yet it has been strangely challenging to accelerate LNG projects. To sign long-term contracts, many buyers want to ensure there are long-term options to achieve 80-100% CO2 reductions on the gas, without leaning too heavily on nature-based CO2 removals, despite their low costs and improving quality (pages 2-3).

So could you construct a decarbonized LNG value chain, capturing the CO2 from natural gas combustion, then transporting it away in the same cryogenic carriers that are bringing in the LNG? The volume maths work (page 4). But there are issues with pressure and buoyancy (page 5), which would require adaptations on newbuild tankers (page 6).

There are also some logistical issues, which will elevate costs. Plantar fasciitis. Gas substitutions. These annoyances are explained on page 7.

What is interesting is that there are existing technologies that can address all of these issues. No new technology needs to be invented. 30 CO2-capable carriers are already on the water, operating routinely. The issue is scaling up, both volumes and transportation distances (page 8).

What additional costs can be expected on a dual-cargo LNG carrier, which can also back-carry CO2? Our best guess is a $1.3/mcf additional shipping premium, which equates to below $25/ton of CO2-equivalents (pages 9-10). The total CO2 disposal cost comes in around $100/ton (page 11). It is interesting to draw comparisons between the relative costs and complexities of transporting hydrogen (page 12).

Who could transport CO2 in LNG carriers? We make some guesses about which companies could be best-placed to develop these kinds of decarbonized LNG value chains on page 13. Interesting inroads and patent filings, from Energy Majors and Asian shipyards, are noted on page 14.

Decarbonizing global energy: the route to net zero?

Decarbonizing global energy

This 18-page report revises our roadmap for the world to reach ‘net zero’ by 2050. The average cost is still $40/ton of CO2, with an upper bound of $120/ton, but this masks material mix-shifts. New opportunities are largest in efficiency gains, under-supplied commodities, power-electronics, conventional CCUS and nature-based CO2 removals.

Important note: our latest roadmap to net zero is from 2022, published here. But this note remains on our website, for transparency into our views at the end of 2021.


This note looks back across 750 of our research publications from 2019-21 and updates our most practical, lowest cost roadmap for the world to reach ‘net zero’. Our framework for decarbonizing 80GTpa of potential emissions in 2050 is outlined on pages 2-3.

Our updated roadmap is presented on pages 4-6. Most striking is the mix-shift. New technologies have been added at the bottom of the cost curve. Other crucial components have re-inflated. And we have also been able to tighten the ‘risking factors’ on earlier-stage technologies, thus an amazing 87% of our roadmap is not technically ready.

The resulting energy mix and costs for the global economy are spelled out on pages 7-8, including changes to our long-term forecasts for oil, gas, renewables and nuclear.

What has changed from our 2020 roadmap? A full attribution is given on pages 9-10. Disappointingly, global emissions will be 2GTpa higher than we had hoped mid-decade, as gas shortages perpetuate the use of coal.

A more detailed review of our roadmap is presented on pages 11-18. We focus on summarizing the key changes in our outlook in 2021, in a simple 1-2 page format: looking across renewables, nuclear, gas shortages, inflationary feedback loops, more efficiency gains, carbon capture and storage and nature-based carbon removals.

Small-scale CCS: transport liquid CO2?

Liquid CO2 transport costs

CO2 has unusual physical properties, which make small-scale liquefaction and transport much more viable than we had expected. The energy burden is 70% less than other industrial gases. Total CCS costs are $50-90/ton for leading examples. This 15-page note outlines the opportunity.


Liquefying CO2 may allow smaller industrial facilities to capture and transport their CO2 to disposal sites, where permitting a pipeline is not feasible or economical. This expands the opportunity for CCS. Early proposals to do this are explored on pages 2-4.

The physics are helpful and are explained on pages 6-8. CO2’s unusual triple point means that the energy costs of CO2 liquefaction are around two-thirds lower than the heavy-duty cryogenics that are already used to liquefy almost 1GTpa of industrial gases globally.

The economics of CO2 liquefaction and transportation are laid out on pages 9-12. We have modeled a separate liquefaction plant, a convoy of CO2-carrying trucks, and larger liquid CO2-carrying ships. Including capex, energy and CO2 costs.

The main operational hurdles are described on page 13. We have reflected additional safety measures and staff training costs in our models as a consequence.

Who benefits? The opportunity is summarized on pages 14-15. The most ambitious project to-date will see Aemetis capture around 2MTpa of CO2 for disposal in California’s Central Valley, where the LCFS could yield $250/ton revenues.

Carbon capture: how big is the opportunity?

US CCS potential MTpa

This 13-page note aims to quantify the upside case for CCS in the United States, using economics, top-down and bottom-up calculations. Our conclusion is that a clear, $100/ton incentive could help CCS scale by c25x, accelerating over 500MTpa of projects in the next decade, which could prevent almost 10% of the US’s current CO2 emissions. Our numbers include blue hydrogen and next-gen CCS.


Current CCS incentives are not sufficient for hard-to-abate sectors in the US, within the <$50/ton confines of the 45Q tax credit (page 2).

Although CCS technology is mature, c$100/ton incentives are needed to kick-start the industry. The economics are built-up on pages 3-7.

Top-down market-sizing is based on the oil and gas industry, which has extracted 900MTpa of hydrocarbons from sub-surface reservoirs, on average in the past 40-years. We discuss possible future CCS volumes relative to this baseline on page 8.

Bottom-up market sizing looks industry-by-industry, to break down possible capture volumes. We discuss each industry in turn – coal power, gas power, ethanol, steel, cement, et al., – on pages 9-12.

Blue hydrogen remains particularly exciting, for the decarbonization of smaller industrial facilities that may need to share infrastructure (page 13).

Carbon capture on ships: raising a sail?

how to decarbonize shipping

CCS is adapting to ‘go to sea’. 80% of some ships’ CO2 emissions could be captured for a cost of c$100/ton and an energy penalty of just 5%, albeit this is the best case within a broad range. This 15-page note explores the opportunity, challenges, progress and who might benefit.


Different options to decarbonize the shipping industry are compared and contrasted on pages 2-4, including the abatement costs of different blue and green fuels.

But what about CCS? The technology is mature. However, CCS on a ship would have different parameters from onshore. We discuss three key considerations on pages 5-7.

Will it actually work? The question is whether you can put an amine plant on a floating structure, store the CO2 as a liquid, and expect the entire system to function. We believe the answer is yes, based on reviewing technical papers, as summarized on 8-10.

$100/ton economics are possible. We use our models to outline what you need to believe to reach these numbers, including sensitivities, and applicability to different shipping types and routes (pages 11-12).

Which companies benefit? We explore implications for leading capital goods companies, chemicals companies and small-scale LNG on page 13.

A new infrastructure industry would also be required, to handle CO2 in ports, move it to disposal sites, or integrate with CO2-EOR. We discuss this theme on pages 14-15.

Biochar: burnt offerings?

Biochar in energy transition

Biochar is a miraculous material, improving soils, enhancing agricultural yields and avoiding 1.4kg of net CO2 emissions per kg of waste biomass (that would otherwise have decomposed). IRRs surpass 20% without CO2 prices or policy support. Hence this 18-page note outlines the opportunity, leading companies and a disruption of biofuels?


Biochar is presented as a miracle material by its proponents, improving water and nutrient retention in soils by 20% and crop yields by at least 10%. We review technical papers in support of biochar on pages 2-3.

Biochar pricing varies broadly today, however we argue biochar can earn its keep at a price in the thousands of dollars per ton, based on its agricultural benefits (pages 4-5).

The production process is described in detail on pages 6-8, reviewing different reactor designs, their resultant product mixes, their benefits and their drawbacks.

Economics are laid out on pages 9-10, outlining how IRRs will most likely surpass 20%, on our numbers. Sensitivity analysis shows upside and downside risks.

Carbon credentials are debated on pages 11-12, using detailed carbon accounting principles. Converting each kg of dry biomass into biochar avoids 1.4kg of CO2 emissions.

We are de-risking over 2GTpa of CO2 sequestration, as the biochar market scales up by 2050. There is upside to 6GTpa, if fully de-risked, as discussed on pages 13-14.

Biofuels would be disrupted? We find much greater CO2 abatement is achieved converting biomass into biochar than converting biomass into biofuels. Hence pages 15-16 discuss an emerging competition for feedstocks.

Leading companies are profiled on pages 17-18, including names that stood out for our screening work.

Additional data-files. The economics of biochar production are modeled here. Companies producing biochar are screened here. The related theme of bio-coke is modeled here.

CO2-EOR: well disposed?

CO2-EOR economics to decarbonize oil

CO2-EOR is the most attractive option for large-scale CO2 disposal. Unlike CCS, which costs over $70/ton, additional oil revenues can cover the costs of sequestration. And the resultant oil is 50% lower carbon than usual, on a par with many biofuels; or in the best cases, carbon-neutral. The technology is fully mature and the ultimate potential exceeds 2GTpa. This 23-page report outlines the opportunity.


The rationale for CO2-EOR is to cover the costs of CO2 disposal by producing incremental oil. Whereas CCS is pure cost. These costs are broken down and discussed on pages 2-5.

An overview of the CO2-EOR industry to-date is presented on pages 6-7, drawing on data-points from technical papers.

Our economic model for CO2-EOR is outlined on pages 8-10, including a full breakdown of capex, opex, and sensitivities to oil prices and CO2 prices. Economics are generally attractive, but will vary case-by-case.

What carbon intensity for CO2-EOR oil? We answer this question on pages 11-12, including a debate on the carbon-accounting and a contrast with 20 other fuels.

The ultimate market size for CO2-EOR exceeds 2GTpa, of which half is in the United States. These numbers are outlined on pages 13-15.

Technical risks are low, as c170 past CO2-EOR projects have already taken place around the industry, but it is still important to track CO2 migration through mature reservoirs and guard against CO2 leakages, as discussed on pages 16-17.

How to source CO2? We find large scale and concentrated exhaust streams are important for economics, as quantified on pages 18-21.

Which companies are exposed to CO2-EOR? We profile two industry leaders on page 22.

What implications for reaching net zero? We have doubled our assessment of CO2-EOR’s potential in this report, helping to reduce the costs in our models of global decarbonization.

Deep blue: cracking the code of carbon capture?

blue hydrogen carbon capture

Carbon capture is cursed by colossal costs at small scale. But blue hydrogen may be its saviour. Crucial economies of scale are guaranteed by deploying both technologies together. The combination is a dream scenario for gas producers. This 22-page note outlines the opportunity and costs.


The mechanics of carbon capture and storage projects are explained on pages 2-4, assessing the costs of CO2 capture, CO2 transport and CO2 disposal in turn.

However CCS faces challenges, which are outlined on pages 4-5. In particular, CO2 has three ‘curses’ at small scale, which dramatically inflate the costs.

We quantify the three curses’ impacts. They are diffuse CO2 concentrations (pages 6-8), high fixed costs for pipelines and disposal facilities (pages 8-10) and difficulties gathering CO2 from dispersed turbines and boilers (pages 10-11).

The rationale for blue hydrogen is to overcome these challenges with CCS, as explained on page 12.

Different blue hydrogen reactor designs are discussed, and their economics are modelled on pages 13-15. Autothermal reforming should take precedence over steam methane reforming as part of the energy transition.

Midstream challenges remain. But we find they are less challenging for blue hydrogen than for green hydrogen on page 16.

A scale-up of blue hydrogen is a dream scenario for the gas industry. The three benefits are superior volumes, pricing power and acceptance in the energy transition, as explained on pages 17-19.

Leading projects are profiled on page 20, which aim to combine blue hydrogen with CCS.

Leading companies in auto-thermal reforming (ATR) are profiled on page 21, based on reviewing technical papers and over 750 patents.

Aker Carbon Capture’s technology is profiled on page 22. Patents reveal a technical breakthrough, but it will only benefit indirectly from our blue hydrogen theme.

What oil price is best for energy transition?

best oil price for energy transition

It is possible to decarbonize all of global energy by 2050. But $30/bbl oil prices would stall this energy transition, killing the relative economics of electric vehicles, renewables, industrial efficiency, flaring reductions, CO2 sequestration and new energy R&D. This 15-page note looks line by line through our models of oil industry decarbonization. We find stable, $60/bbl oil is the best oil price for energy transition.


Our roadmap for the energy transition is outlined on pages 2-4, obviating 45Mbpd of long-term oil demand by 2050, looking across each component of the oil market.

Vehicle fuel economy stalls when oil prices are below $30/bbl, amplifying purchases of inefficient trucks and making EV purchases deeply uneconomical (pages 5-6).

Industrial efficiency stalls when oil prices are below $30/bbl, as oil outcompetes renewables and more efficient heating technologies (page 7).

Cleaning up oil and gas is harder at low oil prices, cutting funding for flaring reduction, methane mitigation, digitization initiatives and power from shore (pages 8-9).

New energy technologies are developed more slowly when fossil fuel prices are depressed, based on R&D budgets, patent filings and venturing data (pages 10-11).

CO2 sequestration is one of the largest challenges in our energy transition models. CO2-EOR is promising, but the economics do not work below $40/bbl oil prices (pages 12-14).

Our conclusion is that policymakers should exclude high-carbon barrels from the oil market to avoid persistent, depressed oil prices, and stabilize oil at the ‘best oil price for energy transition’ (as outlined on page 15).

Copyright: Thunder Said Energy, 2019-2024.