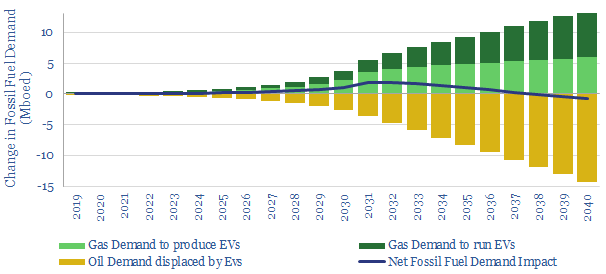
It is widely believed that electric vehicles will destroy fossil fuel demand. We find EVs will increase fossil fuel demand by 0.7Mboed from 2020-35. EVs only start lowering net fossil fuel demand from 2037 onwards. The reason is that 3.7x more energy is consumed to manufacture each EV than the net road fuel it displaces each year; while the manufacturing of EVs is seen growing exponentially. The finding is a strong positive for natural gas, as outline in our new 13-page note.
Pages 2-3 outline our oil demand forecasts out to 2050, reflecting the rise of electric vehicles and six other game-changing technologies.
Pages 4-5 lay out the energy costs manufacturing EVs, based on new, granular details from the recent technical literature.
Pages 6-9 model the exponential rise of electric vehicles, and how rapidly increasing manufacturing energy could outweigh slowly increasing fuel savings.
Pages 10-13 consider pushbacks to our thesis that EVs increase fossil fuel demand, including the use of renewable technology, battery innovations or vehicle autonomy.
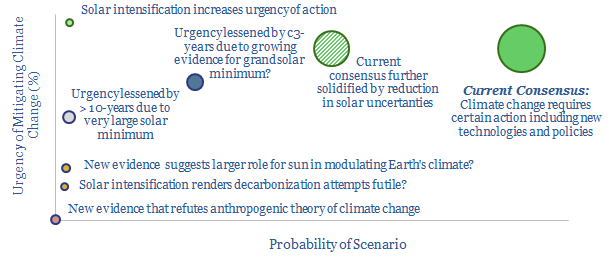
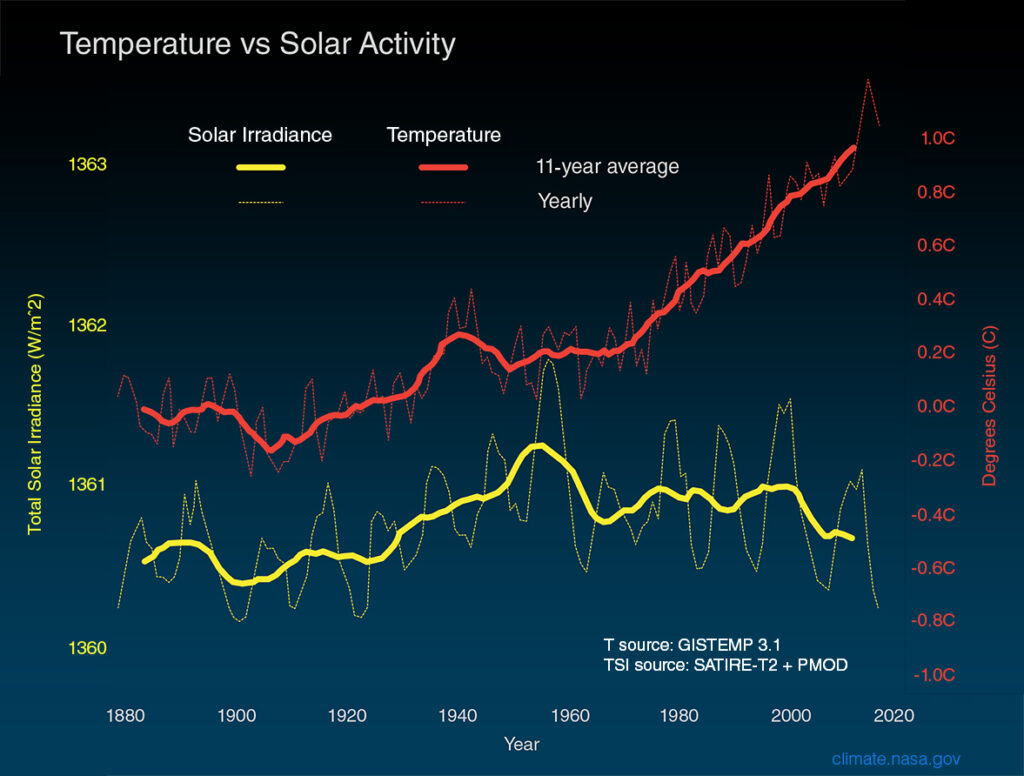
The scientific evidence for anthropogenic climate change is extremely robust, based on the technical papers we have reviewed, warranting better technologies that can decarbonize the global energy system. But the largest uncertainty is our understanding of the sun. Two new satellites (launched in 2018 and 2020) could soon provide unprecedented new data. It is interesting to consider scenarios for how the science could unfold, and how this could alter policies and market sentiment (chart above).
[restrict]
Introduction: Why the Sun Matters?
Much climate science is clear and uncontraversial, making it important to decarbonize the global energy system via better energy technologies. These scientific findings are a guiding reason for our research at Thunder Said Energy.
Around 1,361 watts per square meter (Wm-2) of solar radiation reaches the Earth’s atmosphere.
Around 29% is reflected, 23% is absorbed in the atmosphere and 48% is absorbed at the surface.
CO2 is a greenhouse gas, increasing the portion of solar radiation that is absorbed in th atmosphere.
At its 1980 concentration level, of 330ppm, CO2 was contributing 1.0 Wm-2 more ‘radiative forcing’ than in 1750. At its 2020 concentration, above 410 ppm, it will be contributing 2.0 Wm-2 more radiative forcing than in 1750.
CO2 concentrations correlate closely with indisputable rises in global average temperatures, which have increased by around 0.7-1.0C from pre-industrial times, and at an unusually rapid pace.
The historical precedent is that small changes in climate can instigate large, unpredictable feedback loops.
Small changes in climate can have large socio-economic consequences.
Mass extinctions at the ends of Ordivician period (443 million years ago), late Devonian (375mya), Permian (250-260mya) and Triassic (201mya) were all instigated by major climatic changes, killing off 75-96% of life on Earth.
Better energy technologies, which earn strong returns, are worthwhile whether you believe in climate science or not.
But the role of the sun is much less certain, in our view. The uncertainty makes it harder to model and precisely plan for climate change. It provides a last resort argument for climate skeptics. And long-term solar cycles may sway the sentiment around climate change.
What we know, and what we don’t know, about the sun
The sun undergoes an 11-year sunspot cycle. Specifically, sunspots are dark areas on the solar disc (each tens of thousands of km long, lasting half-a-year), characterized by a strong magnetic field, and associated with warmer solar conditions. Every 11-years, the frequency of sunspots flares up and dies down, causing c1% fluctuation in solar radiation (1.3Wm-2). Each sunspot cycle begins most intensely at the poles and ends most intensely at the sun’s equator (chart below). After each 11-year cycle, the sun’s magnetism mysteriously reverses: North becomes South and South becomes North. Solar cycle 24 began in 2008 and ends in 2020.
Source: NASA
Solar cycles have been getting weaker, with each cycle since 1980, which is another mystery. Solar Cycle 24, ending in 2020, has seen the fewest sunspots in at least 200-years (chart here). Solar Cycle 25 is predicted to be even weaker. This has led some scientists to worry that a ‘grand solar minmum’ (GSM) could be imminent…
Grand solar minima. Longer term data on the sun are not directly available, but can be inferred from the studies of isotopes in ice cores or rocks. These data imply the sun spends around one-sixth of its time in a quiet state called a ‘Grand Solar Minimum’ (GSM). 15-25 grand minima have been identified over the past 11,000 years, lasting 70-years on average. Minima and related solar effects have been posited among the triggers of Ice Ages, every 40-100k years since the start of the Pleisocene, 2.6mya. The causes and impacts of these minima are unclear.
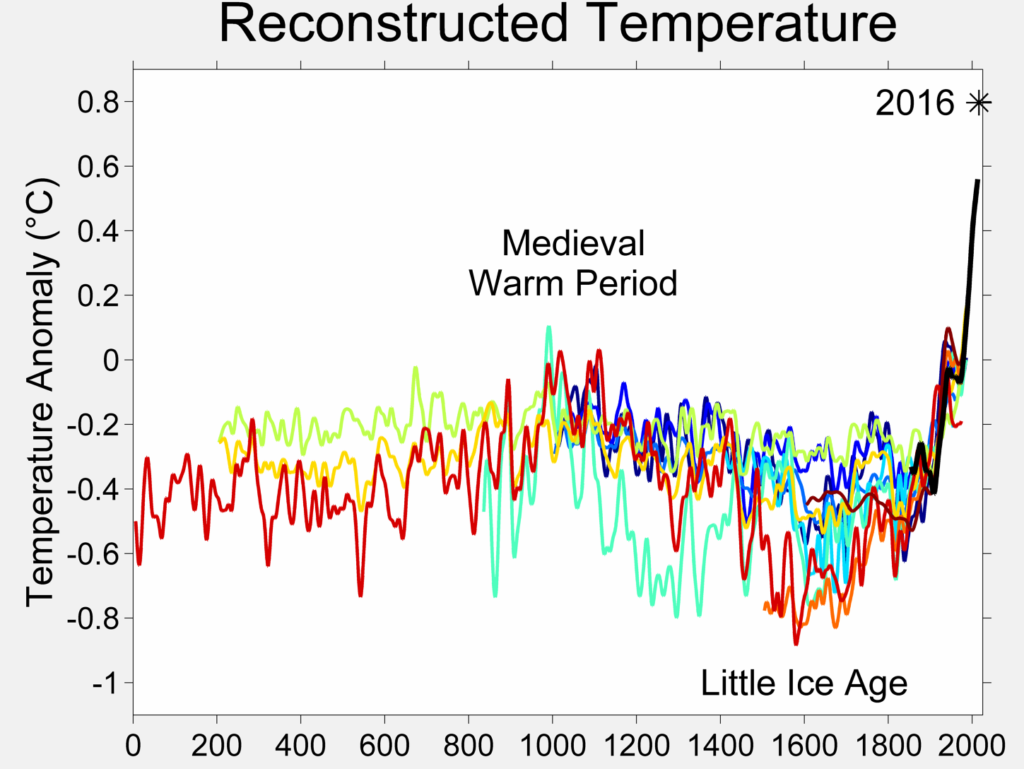
The Maunder Minimum, most famously, was a c50-year period from about 1650-1700 “when sunspots vanished, for reasons which are not yet fully understood” (Meehl et al, 2013), contributing to a ‘Little Ice Age’. Temperatures fell 0.2-1.0C below the medieval warm period (chart below). Other reconstructions, which are not shown below, have estimated a difference of as much as 2C, and others of almost zero.
Source: Wikimedia Commons
We may be going into a minimum. One study notes from cosmogenic isotopes that “in recent decades the Sun has been in a Grand Solar Maximum (GSM) which has lasted longer than all others in the past 9.3 millennia and is expected to end soon” (Barnard et al, 2011). Another study uses a fully coupled climate model to predict 0.25C cooling from a grand solar minimum, between 2020 and 2070 (Meehl et al, 2013). Papers cited by NASA give a similar estimate, around 0.3C.
There are limited data on longer-term solar cycles. Direct solar measurements via satellite started only in 1978. Routine photographs of the sun have been taken since 1876. Direct temperature records are available since 1850. Observations of sunspots go back c400-years, when telescopes were invented. But all of our longer-term data is inferred from proxy measures.
Some studies postulate even longer-term cycles. In addition to a 350-400 year grand cycle, Zharkova et al (2019) posit a ‘super-grand cycle’ of c2,000 years, troughing in c1600, governed by inertial motion of the solar dynamo, around the ‘barycenter of the solar system’. As we are now 350-400 years on from the Maunder Minimum, another GSM is seen denting temperatures in 2020-2050. But even more alarmingly, the upswing of the longer and larger 2,000 year cycle is then seen causing 1.3C further warming by 2100 and 2.5C further warming by 2600.
No one fully understands these long-term solar cycles. Zharkova’s paper, quoted above, is widely criticized for mistaken assertions about the distances betwen Sun and Earth. Others speculate whether these long-term cycles are random, or modulated by the orbits of planets, the rotation of the sun, or something else.
Most contraversial is the suggestion that the sun – not CO2 – has triggered some of the Earth’s warming since 1750. According to AR5, the latest IPCC report, the increase in radiative forcing due to the sun since 1750 is only 0.05 W/m2, compared to a total increase of 2.29 W/m2, mainly caused by CO2. This is corroborated by NASA data (below), albeit note per our comments above that early data are indirectly inferred not measured. Some studies go even further and downplay whether the ‘Little Ice Age’ was even a globally coherent event (Neukom, 2019). But on the other side of the spectrum, other studies based on niche isotope measurements have estimated solar irradiance increased by as much as 4-6 Wm-2 since 1750. Other papers in the last decade claim greater solar activity in the second part of the 20th century than any time in the past 10,000 years. We have not reviewed all of these studies. As a reasonably literate analyst, it is merely noteworthy that there appears to be such a large apparent range of estimates and uncertainty surrounding the sun’s contribution to global temperatures.
What’s Changing: New Data? New Models?
To begin addressing the uncertainties about the sun, two new satellites are going to help. Both have recently launched into space. And their evidence could yield some meaningful new evidence, helping us to model the sun’s future intensity.
The European Space Agency’s Solar Orbiter satellite was launched into space on the 10th February 2020. During its 7-year mission, the satellite will make close approaches to the sun every 6-months, to observe the way magnetic activity builds up. In order to gain a novel perspective, the satellite will use the gravitational pull of Venus to slingshot itself out of the plane where all the planets orbit the sun, in order to observe the solar system from a 25-degree angle. This could help understand the sun’s poles and magnetism much better.
NASA’s Parker Solar Probe was launched in August-2018, billed as the first mission ever to “touch” the sun’s outer corona. It will reach 6M km from the sun’s surface, compared to Earth, which is c150M km away. It will assess the structure and dynamics of the sun’s coronal plasma, magnetic fields and energy flows. A new wave of 47 research papers was released in February-2020, based on the mission’s data and findings so far.
What Implications for Energy Transition?
What is not conceivable to us is that any imminent data source will disconfirm the Earth’s recent warming trend, its links with CO2, or the need to decarbonize global energy. Indeed, the most likely outcome of deeper solar research is to allay the mysteries described above.
But the new data could nevertheless have profound consequences for companies, investors, the global economy and the world, which may be interesting to consider.
What if we are due for a grand solar minimum? A 0.2-0.3C downward influence on temperature from 2020-2070 may ‘buy more time’ for the incubation of new technologies (at least 3-years, according to NASA, possibly more). Some commentators talk about acting urgently to stop climate change, which may entail policies that are economically debilitating. Immediately imposing debilitating policies may not be needed if evidence strengthens for a GSM.
What if we are due for a very large solar minimum? As we have discussed, some climate scientists have postulated a much larger role for the sun, with potentially larger temperature reductions ahead by 2050, on the scale of 1-2C. There is a remote chance that new solar data may stoke these theories. Although remote, it is fascinating to consider how market sentiment might change, if we suddenly found our carbon budgets doubled, or our timeline to achieve an energy transition pushed out by 20-years.
What if we are due for further solar intensification? As we have also discussed, there is a possibility that a further 1.3-2.5C of warming lies ahead, due to solar intensification, linked to a super-grand solar cycle. It is difficult to imagine what would happen if evidence mounted for such a theory. Would it tempt the world to give up on mitigating climate change, or to double down?
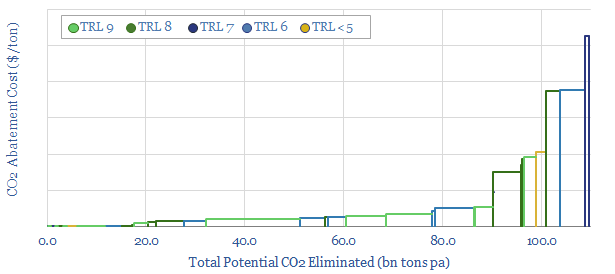
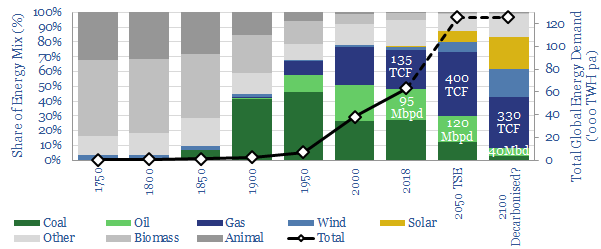
Our research aims to identify economic technologies that can best drive a full decarbonization of the global energy system by 2050 (chart below, data-file here). As a researcher, it is always important to stress-test your firmly-held premises, and to consider what new evidence could unseat them, hence we hope you found this short article useful.
Sources:
Meehl, G., Arblaster, J. M. & Marsh, D. R. (2013). Could a future “Grand Solar Minimum” like the Maunder Minimum stop global warming? Geophysical Research Letters
Usoskin, I. G. (2017). A history of solar activity over millennia. Living Review of Solar Physics.
Barnard, L. Lockwood, M., Hapgood, M. A., Owens, M. J. & Davis, C. J. (2011). Predicting space climate change. Geophysical Research Letters.
Neukom, R., Steiger, N., Gomez-Navarro, J. J., Wang, J. & Werner, J. P. (2019). No evidence for globally coherent warm and cold periods over the pre-industrial common era. Nature, 571
Zharkova, V. V., Shepherd, S. J., Zharkov, S. I. & Popova, E. (2019). Oscillations of the baseline of solar magnetic field and solar irradiance on a millennial timescale. Nature Scientific Reports
Molten carbonate fuel cells (MCFCs) could be a game-changer for CCS and fossil fuels. They are electrochemical reactors with the unique capability to capture CO2 from the exhaust pipes of combustion facilities; while at the same time, efficiently generating electricity from natural gas. The first pilot plant was due to be tested in 1Q20, by ExxonMobil and FuelCell Energy, but was deferred. Economics range from passable to phenomenal. The opportunity is outlined in our 27-page report.
Pages 2-4 outline the market opportunity for more efficient carbon separation technologies, which can be retrofitted to 4TW of pre-existing power plants, without adding $50/T of cost and 15-30% of energy penalties per traditional CCS.
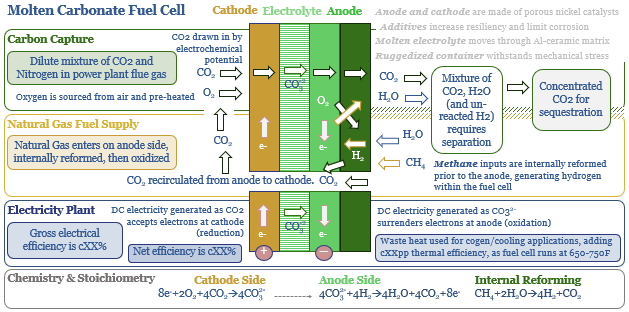
Pages 5-13 outline how MCFCs work, including their operation, development history, how recent patents promise to overcome reliability problems, and their emergent adaptation to carbon capture.
Pages 14-18 assess the economics, both in absolute terms, and by comparison to new gas plants and hydrogen fuel cells. CCS-MCFC economics range from passable to phenomenal, at recent power prices.
Pages 19-23 suggest who might benefit. Fuel Cell Energy has received $60M investment from ExxonMobil, hence both companies’ prospects are explored.
Appendix I is an overview of incumbent CCS technologies, and their limitations.
Appendix II is an overview of six different fuel cell types, comparing and contrasting MCFCs.
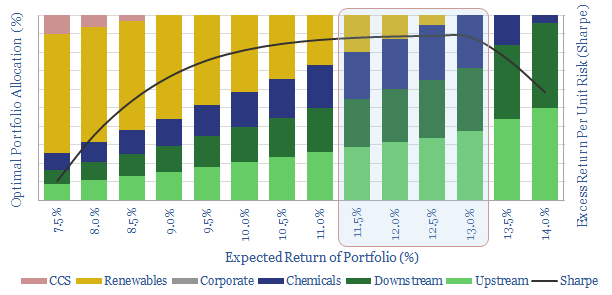
It is often said that Oil Majors should become Energy Majors by transitioning to renewables. But what is the best balance based on portfolio theory? Our 7-page note answers this question, by constructing a mean-variance optimisation model. We find a c0-20% weighting to renewables maximises risk-adjusted returns. The best balance is 5-13%. But beyond a c35% allocation, both returns and risk-adjusted returns decline rapidly.
Pages 2-3 outline our methodology for assessing the optimal risk-adjusted returns of a Major energy company’s portfolio, including the risk, return and correlations of traditional investment options: upstream, downstream and chemicals.
Page 4 quantifies the lower returns that are likely to be achieved on renewable investment options, such as wind, solar and CCS, based on our recent modeling.
Pages 5-6 present an “efficient frontier” of portfolio allocations, balanced between traditional investment options and renewables, with different risk and return profiles.
Pages 6-7 draw conclusions about the optimal portfolios, showing how to maximise returns, minimise risk and maximise risk-adjusted returns (Sharpe ratio).
The work suggests oil companies should primarily remain oil companies, working hard to improve the efficiency and lower the CO2-intensities of their base businesses.
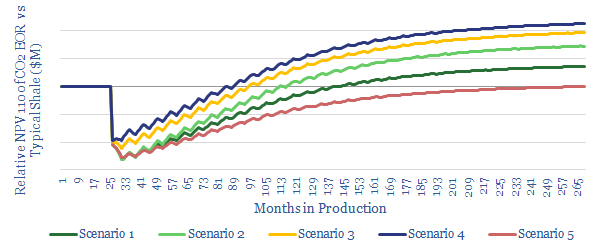
What if there were a technology to sequester CO2, double shale productivity, earn 15-30% IRRs and it was on the cusp of commercialization? Promising momentum is building, at the nexus of decarbonised gas-power and Permian CO2-EOR…
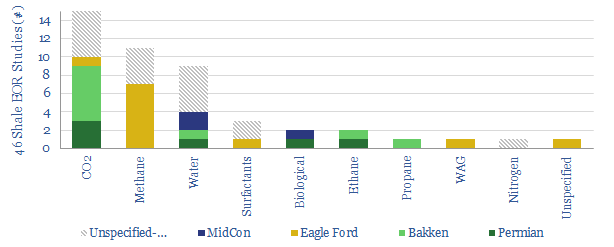
First, this week, we finished reviewing 350 technical papers from the shale industry’s 2019 URTEC conference. The biggest YoY delta is that publications into EOR rose 2.3x. CO2-EOR is favored (chart below). Further insights from the technical literature will follow in a detailed publication, but importantly we do not see underlying productivity growth in shale to be slowing.
Second, we re-read Occidental Petroleum’s 2Q19 conference call. More vocally than ever before, Oxy hinted it could take the pure CO2 from decarbonised power plants and use it for Permian-EOR; with its equity interest in NetPower, 1.6M net Permian acres, and leading CO2-EOR technology. Quotes from the call are below:
On CO2-EOR: “We are investing in technologies that will not only lower our cost of CO2 for enhanced oil recovery in our Permian conventional reservoirs, but will also bring forward the application of CO2 enhanced oil recovery to shales across the Permian, D.J. and Powder River basins”
On decarbonised gas power: “What it does is, it takes natural gas combines that with oxygen and burns it together, and that’s what creates electricity and it creates that electricity at lower costs… one of our solutions is to put that in the Permian… for use in our enhanced oil recovery… It will utilize our gas that that if we sold it would make nearly as much”.
On the opportunity: “We are getting calls from all over the world, with people wanting our help to — figure out how to capture CO2 from industrial sources, and then what to do with it and oil reservoirs”.
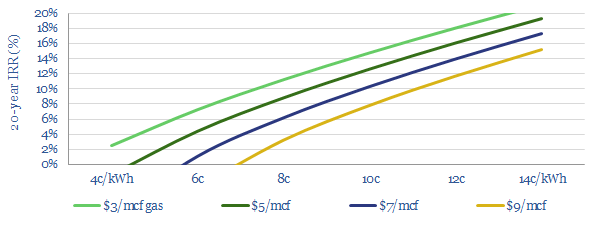
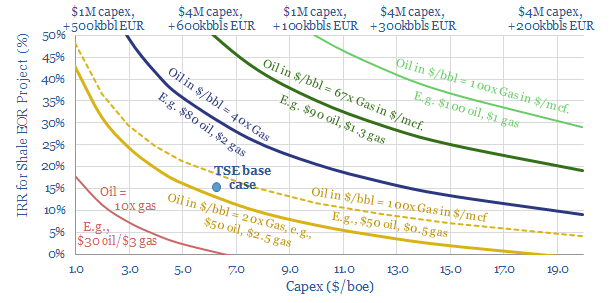
Our extensive work on these themes includes two deep-dive reports linked above. Our underlying models can connect c10% IRRs on oxy-combustion gas plants (first chart below) with 15-30% IRRs at Permian CO2-EOR (second chart below). On these numbers, the overall NPV10 of an integrated system could surpass $10bn.
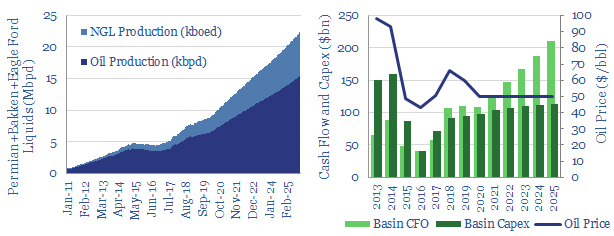
EOR remains one of the most exciting avenues to boost Permian production potential. So far, our shale forecasts assume little direct benefit (chart below). But an indirect benefit is implicit, as we assume 10% annualized productivity growth to 2025, which would underpin a very strong ramp-up (chart below). 2023-25 currently look well-supplied in our oil market model, due to falling decline rates, but this could be compounded by CO2-EOR.
We are more positive on the ascent of gas, stoked by increasing usage in decarbonised power. We see potential for gas demand to treble by 2050.
We are positive on the opportunity to de-carbonise gas-fired power generation using next-generation combustion technologies, such as oxy-combustion, which is reviewed in our deep-dive note, ‘Decarbonising Carbon‘. Could the same technology be used in automobiles? It is more difficult. But the world’s largest oil company is nevertheless trying.
[restrict]
Oxy-Combustion aims to obviate the challenging step of separating CO2 from exhaust gas by burning fuels in an atmosphere that has been purged of Nitrogen (e.g., pure oxygen and CO2). This means that the exhaust gas will comprise CO2 and H20 (i.e., no nitrogen). It can readily be de-hydrated and the CO2 can be sequestered.
(In thermodynamic terms, this requires using a mechanical cycle such as the Allam Cycle in lieu or the traditional Otto Cycle or Diesel Cycle).
This technology works. It is being trialled at three power facilities globally, to decarbonise heat and power. One very promising industry-leader is backed by Occidental. The opportunity of economically de-carbonising gas is extremely positive for global gas demand, as reflected in our own models (chart below, download here).
But could oxy-combustion be used to de-carbonise oil-fired transportation?
In our review of 3,000 patents around the industry, Saudi Aramco stands out as the company working hardest to reduce the emissions of oil-fired transportation. It published over a dozen novel vehicle designs last year (details available to ThunderSaid clients).
Almost all of its efforts aim to reduce the CO2 intensity of burning liquid fuels in auto-engines. Those using oxy-combustion go back to 2013. They have been filed in multiple geographies and updated repeatedly in 2019.
The rationale is to reduce emissions from mobile sources, which comprise 25% of global CO2 and to prevent the formation of NOXs by restricting Nitrogen from the engine. One patent states: “Since pure or nearly pure 02 is combusted with the fuel, the resulting combustion product will constitute principally C02 and H20. The water can readily be condensed and separated to provide a pure, or nearly pure CO2 stream for densification and storage.”
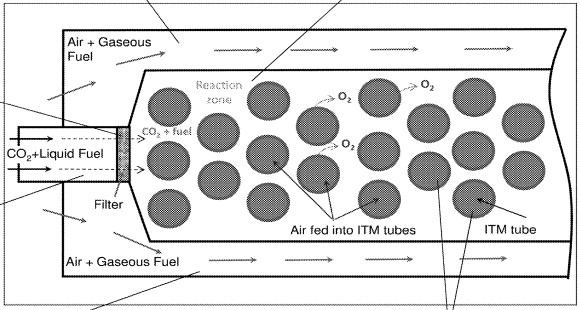
The challenge with oxy-combustion is to purify the oxygen prior to combustion. Aramco’s approach is to achieve this task using electro-ceramic membranes, as commercialised by Ceramatech of Salt Lake City, Utah and Air Products. Aramco has also patented its own membrane cell designs (image below).
The drawback is that these membranes require high temperatures (700-800F). But Aramco’s patent notes this need not be problematic in an internal combustion engine, where c60% of the energy in fuels is converted into heat in to the engine, at 600-650C.
Thus a schematic of the proposed oxy-combustion engine is shown below, including a specially-enlarged air intake, and a membrane to separate N2 from O2.
Can Oxy-Combustion Vehicles be Commercialised?
Challenges of deploying oxy-combustion in a mobile vehicle are not overlooked by the patents.
(1) Space and weight limitations are more acute in a small, mobile vehicle than they are in a fixed power facility. Hence “a major problem … is how to minimize the additional weight and space required by air separation components” in, say, a car.
(2) Storing CO2 on board the mobile vehicle will be necessary, until it can be discharged at a disposal facility. This requires compression energy, to pressure the CO2 to 5-1,600kg/m3. There may be limited storage space. A network of CO2 disposal sites would also need to be developed alongside fuel retail stations.
(3) System stability. The electro-ceramic cells used to separate N2 and O2 have “capacity to produce high-purity O2 over thousands of hours”. But it is not clear whether they will work under extreme temperature variations. The cells may also degrade over time, given the complex chemistry of the electro-ceramic cells: e.g., doped cerium oxide electrolyte, sintered lanthanum strontium cobalite electrodes covered with silver.
(4) System sufficiency. In some high-intensity conditions — hills, motorways — Aramco’s patents acknowledge it will still be necessary to introduce N2 to the engine, emitting NOXs and CO2.
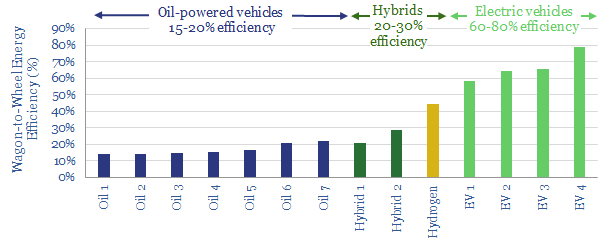
(5) Competition with electric vehicles. Finally, the fundamental energy efficiency of combustion remains c20-30%, compared with 60-80% for electric vehicles (chart below, data here). Electric vehicles have an order-of-magnitude fewer parts, whereas oxy-combustion vehicles appear to have many more.
[/restrict]
We conclude there is strong potential to de-carbonise gas-fired power generation with next-generation combustion technologies. But de-carbonising oil-fired automobiles may be most readily accomplished by electrification, i.e., substituting in smaller, more-specialised electric alternatives.
Source: Hamad, E. Z. & Al-Sadat, W. I. (2013). Apparatus and Method for Oxy-Combustion of Fuels in Internal Combustion Engines. Saudi Aramco Patent WO2013142469A1.
Source 2: Ben-Mansour, H., Habib, M., Jamal, A. (2017). Gas-Assisted Liquid Fuel Oxygen Reactor. Saudi Aramco Patent US2017284661
We see enormous opportunity from CO2-EOR in the Permian. It can double well productivity, generate 15-20% IRRs (at $50 oil) and uplift production potential from the basin by 2.5Mbpd. The mechanism and economics are covered in detail in our deep-dive note, Shale-EOR, Container Class.
But what is happening at the leading edge, as companies try to seize the opportunity?
To deploy CO2-EOR, operators must be confident in the technology. It must be predictable, with well-calibrated models informed by field-tests and laboratory studies.
Excitingly, Occidental Petroleum is developing such models. Its laboratory analysis into CO2-EOR has been published in a new SPE paper, in partnership with CoreLabs.
Oxy is at the forefront of CO2-EOR, according to our screening of patents and technical papers. It has conducted 4 x field trials, with further ambitions to lower decline rates from 2020 and drive value through its Anadarko acquisition.
This note profiles our top five findings from Oxy’s recent technical paper. CO2-EOR’s deployment is supported.
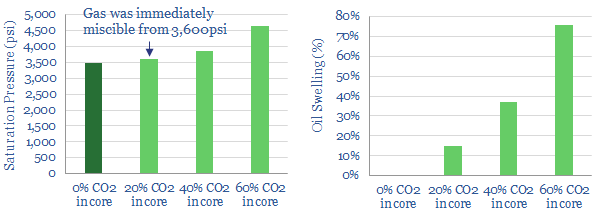
(1) CO2 was found to be “the best solvent” for huff’n’puff in the Permian, after laboratory-testing Wolfcamp cores, with CO2, methane and field gas. Under simulated reservoir conditions, around 3,600psi, bubbles of CO2 immediately began dissolving into the oil, helping to mobilise it.
(2) CO2 swelled the oilby 15-76% under the reservoir conditions tested in the study (below, right). Swollen oil is more likely to dissociate from the reservoir rock and flow into the well.
(3) Accurate ‘Equation of State’ models have been developed, matching the pressure, viscosity and well data from the laboratory study.
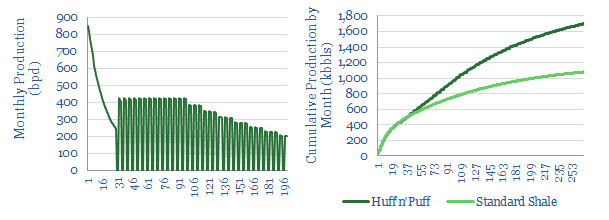
(4) Multiple Cycles. Huff’n’puff works by sequentially ‘huffing’ gas into a depleted shale well to entrain residual oil, then ‘puffing’ back the mixture of gas and oil. Ideally, this cycle can be repeated multiple times, recovering more oil each time (illustration below). Oxy’s laboratory study continued recovering material volumes of oil over six cycles. Lighter fractions were recovered in earlier cycles, followed by heavier fractions in later cycles. The authors concluded: “The multi-cycle incremental recovery – even at the small core plug scale – suggests the significant potential for multiple HnP EOR cycles for a future unconventional EOR project design”.
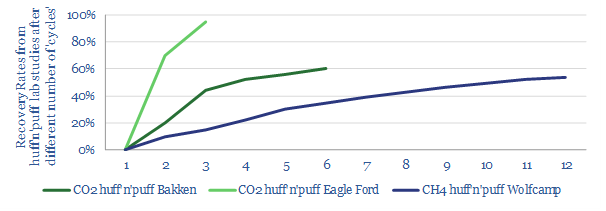
(5) Huge Recovery Factors. What slowed the eventual recovery of oil in the study was the high volume of oil already recovered. Initially, these shale samples contained 10.3% oil (as a percentage of the initial pore volume). By the end of the huff’n’puff trial, they contained just 2.4%, implying c77% of the oil had been drained: an incredibly high number, when compared with c 8-10% recovery factors in most analyst models. The result matches other lab tests we have seen in the technical literature (chart below). The field-scale implications of these studies are discussed in our deep-dive research.
Source: Liu, S., Sahni, V., Tan, J., Beckett, D. & Vo, T. (2019). Laboratory Investigation of EOR Techniques for Organic Rich Shales in the Permian Basin. SPE.
Decarbonisation is often taken to mean the end of fossil fuels. But it is more feasible simply to de-carbonise them, with next-generation combustion technologies.
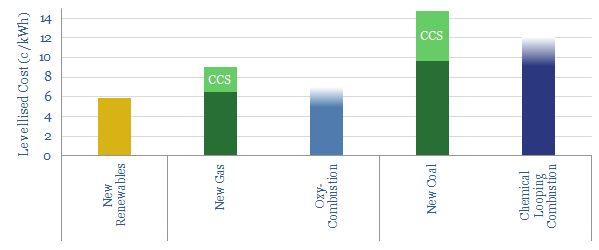
This 19-page note presents our top two opportunities: ‘Oxy-Combustion’ using the Allam Cycle and Chemical Looping Combustion. Both can provide competitive energy with zero carbon coal & gas.
Leading Oil Majors are supporting these solutions, to create value while advancing the energy transition.
Carbon capture remains an “orphan technology”, absorbing just c0.1% of global CO2. The costs and challenges of current technologies are profiled on pp2-4.
Energy penalties are particularly problematic. Paradoxically, the more CCS in our models, the longer it takes to de-carbonise the energy system (see pp5-6).
Next generation combustion-technologies are therefore necessary…
Allam Cycle Oxy-Combustion burns CO2 in an inert atmosphere of CO2 and oxygen. We evaluate a demonstration plant and model strong economics (see pp12-15).
Chemical Looping Combustion burns fossil fuels in a fluidized bed of metal oxide. We profile the technology’s development to-date, net efficiency and levellised costs, which are passable (pp8-11).
Oil Majors are driving the energy transition. We count ninety patents from leading companies to process CO2, including 30 to de-carbonise power. The best advances are profiled from TOTAL, Occidental, Aramco and ExxonMobil. (See pp16-19).
In 2019, Shell pledged $300M of new investment into forestry. TOTAL, BP and Eni are also pursuing similar schemes. But can they move the needle for CO2? In order to answer this question, we have tabulated our ‘top five’ facts about forestry. We think Oil Majors may drive the energy transition most effectively via developing better energy technologies in their portfolios.
[restrict]
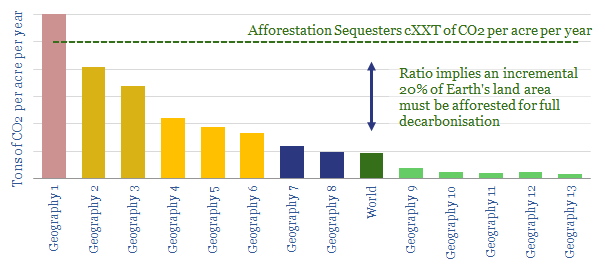
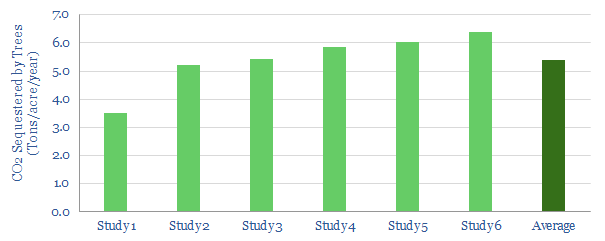
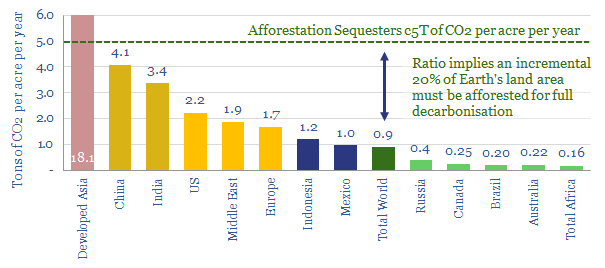
(1). Forests should sequester 5T of CO2 per acre per annum, which is the average figure in half-a-dozen technical papers that we reviewed. However, the rates in these studies vary from 1-25 Tons per acre per annum, depending upon the species, the latitude and the rate of harvesting. Forests grow fastest in their early stages, and so paradoxically, to maximise CO2 sequestration, it may be necessary to cut them down periodically (and then re-plant).
(2). The world emits 1T of CO2 per acre per annum, which means that for forestry to absorb all of the world’s CO2 emissions, an incremental 20% of the world’s land mass must be given over to planting new forests. An extremely high number. Global carbon emissions run at 34bn tons per annum, while the world’s total land area is 37bn acres (c150M sq km).
(3). It matters where you plant. The chart above also shows a problematic skew in the world’s carbon emissions. If developed Asian countries (Japan, Korea, Singapore) wanted to offset all of their emissions by planing forests, they would need to access land areas that are c3.5x larger than their entire territories. Likewise, India and China would need to access areas equivalent to 60-80% of their own borders. To move the needle, large new forests would need to be planted in the countries on the right hand side of the chart. For the full data series, please download our data-file.
There are select opportunities in the mix, which Oil Majors can pursue. Perhaps the largest come from irrigating and afforesting desert areas. Not only are these areas large, but forests in hot areas have a tendency to grow more quickly and release more moisture, which in turn seeds clouds, which in turn reflects more sunlight and cools the planet.
(4). Environmental question marks? Forests clearly sequester CO2, but the precise climate science is surprisingly complex. Leaves absorb more sunlight than other types of land cover, increasing albedo, and warming the planet mildly. Trees can also release compounds called isoprenes, which reacts with nitrogen oxides in the air to form ozone (a greenhouse gas), while lengthening the lifespan of atmospheric methane (another greenhouse gas). Similarly, trees in tropical forests can seem to act as a conduit for soil to convey methane into the atmosphere. This deepens the need for “the right kind” of forestry investment, based on science.
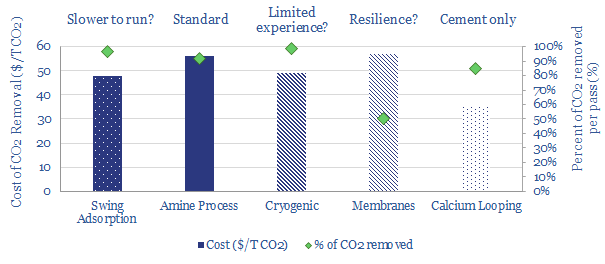
(5). Capital may be better spent elsewhere? Most of the estimates we have encountered point to $20-100/ton of costs for sequestering CO2 using forests. This is competitive with other current forms of CCS (chart below, data here). However, we are also researching next-generation carbon capture technologies, which are much more competitive, below $20/ton.
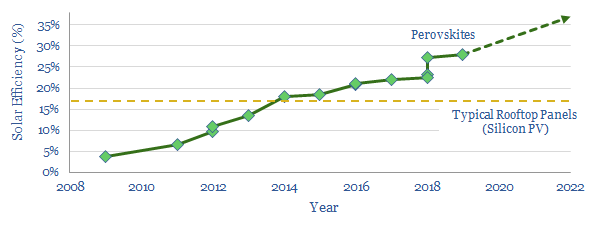
To illustrate the same point another way, photosynthesis’s energy efficiency is around 0.5-1%, compared to today’s solar cells at c17% and next-generation perovskites reaching c35% (chart below). So ramping up next-genration solar could yield greater decarbonisation per unit of land area.
While we think Majors have a deep role to play in driving the energy transition, it will most likely be though game-changing technologies, which also unlock multi-billion dollar economic opportunities, per our recent note here.
References
Caldecott, B., Lomax, B. & Workman, M., (2015). Stranded Carbon Assets and Negative Emissions Technologies Working Paper. Stranded Assets Programme.
Gorte, R. (2009). U.S. Tree Planting for Carbon Sequestration. Congressional Research Service
Lenton, T.M., 2010. The potential for land-based biological CO2 removal to lower future atmospheric CO2 concentration. Carbon Management 1(1), 145–160.
Lewandrowski, J., Peters, M. & Jones, C. (2004). Economics of Sequestering Carbon in the U.S. Agricultural Sector, USDA Economic Research Service, Technical Bulletin TB-1909
Popkin, G., (2019). How much can forests fight climate change? Nature 565, 280-282
U.S. Environmental Protection Agency (2005). Greenhouse Gas Mitigation Potential in U.S. forestry and Agriculture, EPA 430-R-05-006, Washington, DC.
BP (2019). BP Statistical Review of World Energy
[/restrict]
Cookies?
This website uses necessary cookies. Our cookies are simply to improve your experience. We do not undertake any advertising or targeting via our cookies. By clicking 'accept' or continuing to use the website, you consent to our use of cookies.AcceptRead More
Privacy & Cookies Policy
Privacy Overview
This website uses cookies to improve your experience while you navigate through the website. Out of these, the cookies that are categorized as necessary are stored on your browser as they are essential for the working of basic functionalities of the website. We also use third-party cookies that help us analyze and understand how you use this website. These cookies will be stored in your browser only with your consent. You also have the option to opt-out of these cookies. But opting out of some of these cookies may affect your browsing experience.
Necessary cookies are absolutely essential for the website to function properly. This category only includes cookies that ensures basic functionalities and security features of the website. These cookies do not store any personal information.
Any cookies that may not be particularly necessary for the website to function and is used specifically to collect user personal data via analytics, ads, other embedded contents are termed as non-necessary cookies. It is mandatory to procure user consent prior to running these cookies on your website.