Learning curves and cost deflation are widely assumed in new energies but overlooked for nature-based CO2 removals. This 15-page note finds that via optimization of nature based solutions the CO2 uptake of reforestation projects could double again from here. Support for NBS has already stepped up sharply in 2021. Beneficiaries include the supply chain and leading projects.
Nature based carbon removals are re-capped on page 2, covering their importance, their costs and how they are re-shaping the energy transition.
But policy support is growing faster than expected, as outlined on pages 3-5. Now that nature-based CO2 removals are on the map, they are in competition with other new energies. Hence which technologies will ‘improve fastest’?
The historical precedent from agriculture is that yields have improved 4-7x over 50-100 years, due to learning curve effects. So will forestry practices be similar? (pages 6-7).
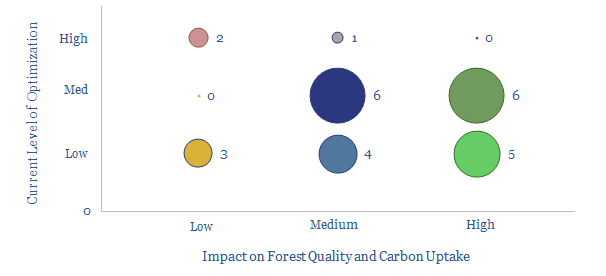
Thirty variables can be optimized when re-foresting a degraded eco-system. We run through the most important examples on pages 8-13.
But is optimizing nature ‘natural’? This is a philosophical question. Our own perspectives and conclusions on optimization of nature based solutions, and who benefits are offered on page 14-15.
This 14-page note lays out a new model to supply fully carbon-neutral energy to a cluster of commercial and industrial consumers, via an integrated package of renewables, low-carbon gas back-ups and nature based carbon removals. This is remarkable for three reasons: low cost, high stability, and full technical readiness. The prize may be very large.
Four building blocks for a zero-carbon energy mix are outlined on pages 2-5. They include wind, solar, gas-fired CHPs and gas-fired CCGTs. Costs, CO2 intensities and key debates are reviewed for each technology.
Taking out the CO2 requires high-quality nature based carbon removals, for any truly ‘carbon neutral’ energy mix. Meeting this challenge is described on pages 5-7. There will be nay-sayers who do not like this model. To them, we ask, why do you hate nature so much?
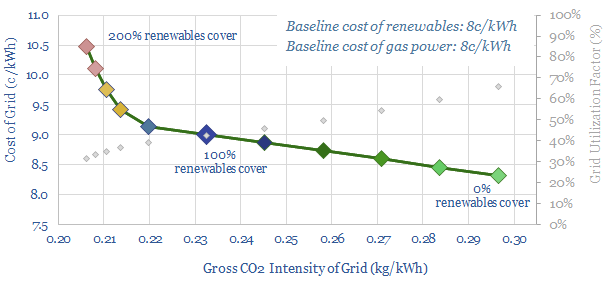
Finding a fit requires combining the different building blocks above into an integrated energy system. We find the optimal fit is for renewables capacity to cover 110% of average grid demand. The balancing act is outlined on pages 8-10.
The gas supply chain that backs up the renewables must minimize methane leaks and use the gas as efficiently as possible. Our suggestions are laid out on pages 11-12.
The commercial benefits of this integrated model are described on pages 13-14. We think this is an excellent opportunity to provide fully carbon-neutral energy, using fully mature technologies, at costs well below 10c/kWh and highly bankable price-stability.
Some policymakers now aspire to ban gas boilers and ramp heat pumps 10x by 2050. In theory, the heat pump technology is superior. But in practice, there are ten challenges. Outright gas boiler bans could become a political disaster. The most likely outcome is a 0-2% pullback in European gas by 2030. We have also screened leading heat pump manufacturers in this 18-page note.
The opportunity for heat pumps in the energy transition is laid out on pages 2-3, as the IEA now advises that “bans on new fossil fuel boilers need to start being introduced globally in 2025, driving up sales of electric heat pumps”.
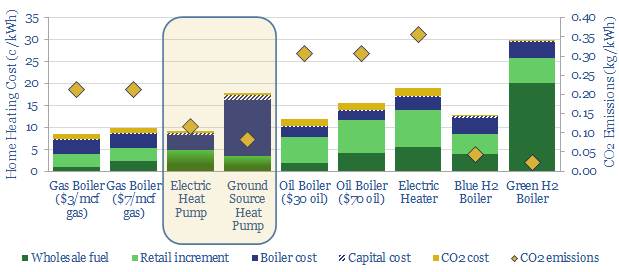
But are they ready for prime time? We have reviewed technical specifications, costs and consumer feedback on pages 4-13. The work suggests large heat pumps may not feasibly substitute for gas boilers in every context. There are ten crucial challenges for the industry to overcome.
Gas market impacts are quantified on pages 14-17. Our base case is that trebling heat pump capacity in Europe by 2030 will erode 2% of total gas demand. But rebound effects and under-performance could cut the net benefits to nil.
The best placed companies are explored in our detailed screening work (which we have used to select a heat pump provider for our own GSHP project in Europe). One company stands out in particular, having built-up an industry leading portfolio through acquisitions.
As Europe advances its decarbonization agenda, a ‘border adjustment mechanism’ has now been proposed to mitigate carbon leakage. Its initial formulation is modest. But it will snowball. And ultimately divide the global economy in two. Hence this 15-page report lays out our top five predictions for CO2 border taxes to reshape energy markets and the world.
In 1946, Winston Churchill made his famous ‘Iron Curtain’ speech, prophesizing decades of tensions between different economic systems in the West and elsewhere. The concept of a carbon curtain is similar, and is laid out on pages 2-4 of our report.
These wheels are now firmly in motion, as Europe has proposed a carbon border adjustment mechanism, in order to stem carbon leakage, as it tightens its environmental policies. For those who prefer not to read the Commission’s entire 291-page leviathan, we have summarized the key features on pages 5-6.
Expansion is inevitable. Page 7 argues for domino effects, where CBAM will be emulated by other Western economies; and then broadened, first into the manufacturing sector, then universally.
There will be five investable consequences of these escalating border taxes, which we spell out on pages 8-15. They could be extremely constructive for the gas/LNG industry, pre-existing renewables assets, and some lower carbon economies. But we also see major losers in the coal industry, higher-carbon countries and victims of inflation.
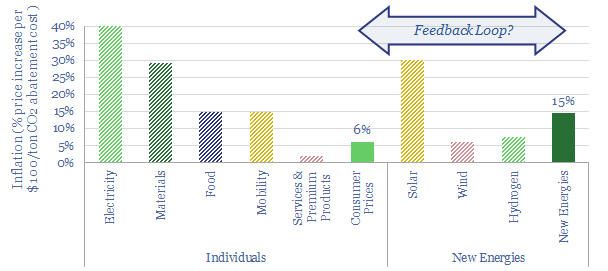
New energy policies will exacerbate inflation in the developed world, raising price levels by 20-30%. Or more, due to feedback loops. We find this inflation could also cause new energies costs to rise over time, not fall. As inflation concerns accelerate, policymakers may need to choose between delaying decarbonization or lower-cost transition pathways.
The importance of costs on the roadmap to net zero evokes a surprising amount of debate. We re-cap these debates, including our own roadmap on pages 2-3. Recently, organizations such as the IEA have published a roadmap, which we believe will be c10x more expensive.
The inflationary impacts of energy transition can be compared for different levels of abatement costs. Hence we discuss the concept of abatement costs, including two paradoxes, on pages 4-5.
Top-down, we calculate that each $100/ton of CO2 abatement cost would likely lead to 6% aggregate price increases in the developed world, on page 6.
Bottom-up, we model that each $100/ton of CO2 abatement cost would lead to 2-70% price increases, across a basket of twenty different goods and commodities, on pages 7-8. The impacts are regressive and basic goods and staples rise more.
An additional source of inflation comes from supply-demand dynamics, as some materials will be dramatically under-supplied in the energy transition (page 9).
What does it mean for new energies? To answer this question, we bridge the impacts of all these cost increases in our models of wind, solar, hydrogen and batteries, on pages 10-12. There are surprising feedback loops, which could amplify inflation.
No brakes? We also find that the usual mechanism to slow inflation is blunted by the need for an energy transition, on pages 13-14. Hence if inflation accelerates, it could surprise by a wide margin.
Our conclusion is that policy-makers and companies should consider costs more closely, while there are measures for investors to inflation-proof portfolios.
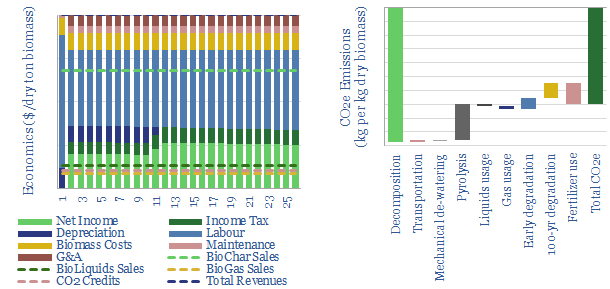
Biochar is a miraculous material,improving soils, enhancing agricultural yields and avoiding 1.4kg of net CO2 emissions per kg of waste biomass (that would otherwise have decomposed). IRRs surpass 20% without CO2 prices or policy support. Hence this 18-page note outlines the opportunity, leading companies and a disruption of biofuels?
Biochar is presented as a miracle material by its proponents, improving water and nutrient retention in soils by 20% and crop yields by at least 10%. We review technical papers in support of biochar on pages 2-3.
Biochar pricing varies broadly today, however we argue biochar can earn its keep at a price in the thousands of dollars per ton, based on its agricultural benefits (pages 4-5).
The production process is described in detail on pages 6-8, reviewing different reactor designs, their resultant product mixes, their benefits and their drawbacks.
Economics are laid out on pages 9-10, outlining how IRRs will most likely surpass 20%, on our numbers. Sensitivity analysis shows upside and downside risks.
Carbon credentials are debated on pages 11-12, using detailed carbon accounting principles. Converting each kg of dry biomass into biochar avoids 1.4kg of CO2 emissions.
We are de-risking over 2GTpa of CO2 sequestration, as the biochar market scales up by 2050. There is upside to 6GTpa, if fully de-risked, as discussed on pages 13-14.
Biofuels would be disrupted? We find much greater CO2 abatement is achieved converting biomass into biochar than converting biomass into biofuels. Hence pages 15-16 discuss an emerging competition for feedstocks.
Leading companies are profiled on pages 17-18, including names that stood out for our screening work.
Additional data-files. The economics of biochar production are modeled here. Companies producing biochar are screened here. The related theme of bio-coke is modeled here.
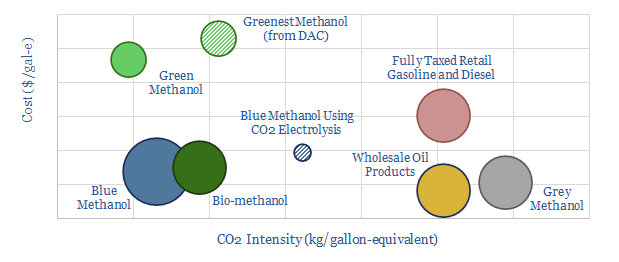
Methanol is becoming more exciting than hydrogen as a clean fuel to help decarbonize transport. Specifically, blue methanol and bio-methanol are 65-75% less CO2-intensive than oil products, while they can already earn 10% IRRs at c$3/gallon-equivalent prices. Unlike hydrogen, it is simple to transport and integrate methanol with pre-existing vehicles. Hence this 21-page note outlines the opportunity.
The objectives and challenges of hydrogen are summarized on pages 2-3. We show that clean methanol can satisfy the objectives without incurring the challenges.
An overview of the methanol market is given on pages 4-5, to frame the opportunity, particularly in transportation fuels and cleaner chemicals.
Conventional methanol production is described on 6-8. We focus upon the chemistry, the costs, the economics and the CO2 intensity.
Bio-methanol is modelled on pages 9-10. We also focus upon the costs, economics and CO2 intensity, including an opportunity for carbon-negative fuels.
Blue methanol is outlined on pages 11-15. Converting CO2 and hydrogen into methanol is fully commercial, based on recent case studies, which we also use to model the economics and CO2 credentials.
Green methanol is more expensive for little incremental CO2 reduction, and indeed some routes to green methanol production are actually higher-CO2 (pages 16-18).
Companies in the methanol value chain are profiled on pages 19-20. We focus upon leading incumbents, technology providers and private companies commercializing clean methanol.
Our conclusion is that methanol could excite decision-makers in 2021, the way that hydrogen excited in 2020. This thesis is spelled out on page 21.
Joe Biden’s presidency will prioritize energy transition among its top four focus areas. Below we present our top ten pieces of research that gain increasing importance as the new landscape unfolds. We are cautious that aggressive subsidies may stoke bubbles and supply shortages in the mid-2020s. Decisions-makers will become more discerning of CO2. As usual, we focus on non-obvious opportunities.
(1) Kingmaker? There are two policy routes to accelerate the energy transition. An escalating CO2 tax could decarbonize the entire US by 2050, for a total abatement cost of $75/ton, while unlocking $3.5trn of investment. The other approach is with subsidies. This is likely to be Biden’s preferred approach. However, giving subsidies to a select few technologies tends to crowd out progress elsewhere. Who gets the subsidies is arbitrary, and thus ensues a snake-pit of lobbying. It is also more expensive, with some subsidies today costing $300-600/ton. Finally, subsidies will only achieve limited decarbonization on our models. Our 14-page note outlines these ideas and backs them up with data, to help you understand the policy landscape we are entering.
(2) Bubbles? The most direct risk of aggressive subsidies is that we fear they will stoke bubbles in the energy transition. Specifically, we have argued a frightening resemblance is appearing between prior and notorious investment bubbles (from Dutch tulips to DotCom stocks) and many of the best-known decarbonization themes today. It is driven by an expectation that government policies will grow ever more favorable, thus technical and economic challenges are being overlooked. Our 19-page note evaluates the warning signs, theme by theme, to help you understand where bubbles may be likely to build and later burst.
(3) Overbuilding renewables is a potential bubble. Our sense is that Biden’s policy team prefers to subsidize renewables today and defer the resultant volatility issues for later. But eventually, we model that this will result in power grids becoming more expensive and more volatile, which could end up having negative consequences, both for consumers and industrial competitiveness. More interestingly, we find expensive and volatile grids have historically motivated installations of combined heat and power systems behind the meter, which can also cut CO2 emissions by 6-30% compared to buying power from the grid, at 20-30% IRRs. The reason is that CHPs capture and use waste heat. Thus they achieve c70-80% thermal efficiencies, where simple cycle gas turbines only achieve c40%. The theme and opportunity are therefore explored in our 17-page note below.
(4) Over-building electric vehicles? Subsidies for EVs are also more likely under a Biden presidency. This is widely expected to destroy fossil fuel demand. Indeed a vast scale-up of EVs is present in our oil demand forecasts helping global oil demand to peak in 2023. However, our 13-page note finds this electrical vehicle ramp-up will actually increase net fossil fuel demand by +0.7Mboed from 2020-35, with gains in gas exceeding losses of oil. The reason is that manufacturing each EV battery consumes 3.7x more energy than the EV displaces each year. So there is an energy deficit in early years. But EV sales are growing exponentially, so the energy costs to manufacture ever more EVs each year outweighs the energy savings from running previous years’ EVs until the EV sales rate plateaus.
(5) Under-investment in fossil fuels? A sticking point in the presidential debates was whether President Biden would ban fracking. An impressive understanding of the energy industry was shown by his response that instead “we need a transition”. However, some have commentators continued fearmongering. We think the fearmongering is overdone. Nevertheless, at the margin, Biden’s presidency may reduce investment appetite for oil and gas. In turn, this would exacerbate the shortages we are modelling in the 2020s. A historical analogy is explored in our 8-page note, which looks back at whale oil, a barbaric lighting fuel from the 19th century. Amidst the transition to kerosene and electric lighting, whale oil supply peaked long before whale oil demand, causing strong price performance for whale oil itself, and very strong price performance for by-products such as whale bone.
(6) Under-investment in oil? Our oil market outlook in 2021-25 is published below. New changes include downward revisions to US shale supplies (particularly from 2022), increased chances of production returning in Iran, and increased production from Saudi Arabia and Russia to compensate for lower output in the US. Steep under-supply is seen in 2022, over 1Mbpd, even after OPEC has exited all production cuts. Restoring market balance in 2024-25 requires incentivizing an 8Mbpd shale scale-up. We do not believe Biden’s policies will block this shale ramp, but they may help its incentive costs re-inflate by c$5-15/bbl, particularly if Trump-era tax breaks are reversed.
(7) Under-investment in gas? Where US shale growth slows, there is clearly going to be less associated gas available to feed US LNG facilities. But there may also be a lower investment appetite to construct US LNG facilities. This matters because our 12-page note below finds gas shortages are likely to be a bottleneck on decarbonization in Europe, which compounds our fears that Europe’s own decarbonization objectives could need to be walked back. Specifically, Europe must attract another 85MTpa of global LNG supplies before 2030 to meet the targets shown on the chart. This is one-third of the 240MTpa risked LNG supply growth due to occur in the 2020s, of which 100MTpa is slated to come from the United States. There is no change to our numbers yet.
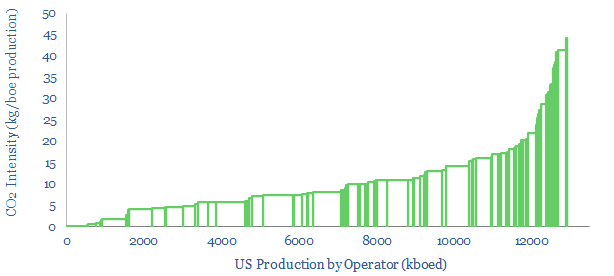
(8) Lower carbon beats higher carbon? We are not fearmongering that oil and gas investment will stall under a Biden presidency. But we do believe that investment in all carbon-intensive sectors will proceed somewhat more discerningly than it would have under Trump. Low-carbon producers will be more advantaged in attracting capital, while higher-carbon producers will be penalized with higher capital costs and lower multiples. In order to help you rank different operators, we have assembled a data-file covering 13Mboed of production from major US basins, operator-by-operator (below and here) alongside our broader screens of CO2 intensity, which span across 30 different sectors, such as LNG plants, refineries, chemical facilities, cement and biofuels (here).
(9) Mitigating methane? Biden’s presidency will likely re-strengthen the EPA. Our hope is that this will accelerate the industry’s assault on leaking methane, which is a 25-120x more powerful greenhouse gas than CO2. Methane accounts for 25-30% of all man-made warming, of which c25% derives from the oil and gas industry. If 3.5% of gas is leaked across the value chain, then debatably gas is no greener than coal (the number is less than 1% in the US but can be greatly improved). Our 23-page note evaluates the best emerging technology options to mitigate methane. We are excited by replacing high-bleed pneumatics, as profiled in our short follow-up note (also below). We also see shale operators accelerating their quest for ‘CO2-neutral’ production (note below).
(10) The weatherization of 2M homes is a central part of Joe Biden’s proposed energy policy. Hence we created a data-file assessing the costs and benefits of different options. The most cost-effective way to lower home heating bills is smart thermostats. They can cut energy use c18%. Leading providers include Nest (Google), Honeywell, Emerson, Ecobee. Second most cost-effective is sealing air leaks. GE Sealants is #1 by market share in silicone sealants. Advanced plastics would also see a modest boost in demand. More questionable are large and expensive construction projects, which appear to have larger up front costs and abatement costs per ton of CO2.
20% of Europe’s renewable electricity currently comes from biomass, mainly wood pellets, burned in facilities such as Drax’s 2.6GW Yorkshire plant. But what are the economics and prospects for biomass power as the energy transition evolves? This 18-page analysis leaves us cautious.
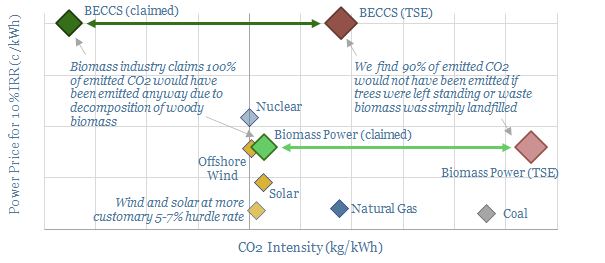
Arguments in favor of biomass are outlined on pages 2-3, using the carbon cycle to show how biomass could be considered zero-carbon in principle.
Examples of biomass power plants are described on pages 4-5, focusing upon Drax and RWE, and drawing upon data from 340 woody biomass facilities in US power.
The economics of producing biomass pellets are presented on pages 6-7, including a detailed description, capex breakdown, and critique of input assumptions.
The economics of burning biomass pellets to generate electricity are presented on pages 8-9, again with a detailed description and critique of input assumptions.
The economics of capturing and disposing of the CO2 are presented on pages 10-12, allowing us to build up a full end-to-end abatement cost for BECCS.
Energy economics are disaggregated on pages 13-14, in order to derive a measure of energy return on energy invested (EROEI) and CO2 intensity (in kg/kWh). Surprisingly, we find the EROEI for BECCS to be negative.
Is it sustainable? We answer this question on 15-17, arguing that biomass energy and BEECS, properly considered, both have a higher CO2 intensity than gas.
Conclusions and implications are presented on pages 18, including bridges for the total CO2 intensity of biomass and BECCS.
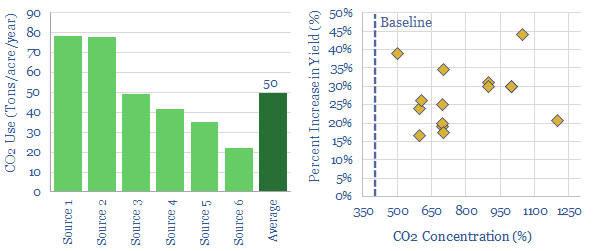
Enhancing the concentration of CO2 in greenhouses can improve agricultural yields by c30%. It costs $4-60/ton to supply this CO2, while $100-500/ton of value is unlocked. Shell and ABF have already under-taken projects using CO2 in agriculture and greenhouses, while industrial gas and monitoring companies can also benefit. But the challenge is scale. Around 50Tpa of CO2 is supplied to each acre of greenhouses. Only c10% is sequestered. So the total CO2 sequestration opportunity may be limited to around 50MTpa globally.
This 8-page note explains the opportunity, progress to date and our conclusions.
Cookies?
This website uses necessary cookies. Our cookies are simply to improve your experience. We do not undertake any advertising or targeting via our cookies. By clicking 'accept' or continuing to use the website, you consent to our use of cookies.AcceptRead More
Privacy & Cookies Policy
Privacy Overview
This website uses cookies to improve your experience while you navigate through the website. Out of these, the cookies that are categorized as necessary are stored on your browser as they are essential for the working of basic functionalities of the website. We also use third-party cookies that help us analyze and understand how you use this website. These cookies will be stored in your browser only with your consent. You also have the option to opt-out of these cookies. But opting out of some of these cookies may affect your browsing experience.
Necessary cookies are absolutely essential for the website to function properly. This category only includes cookies that ensures basic functionalities and security features of the website. These cookies do not store any personal information.
Any cookies that may not be particularly necessary for the website to function and is used specifically to collect user personal data via analytics, ads, other embedded contents are termed as non-necessary cookies. It is mandatory to procure user consent prior to running these cookies on your website.