Decarbonized gas: ship LNG out, take CO2 back?

Transport CO2 in LNG carriers

Can you transport CO2 in LNG carriers? This 14-page report explores an option to decarbonize global LNG: (i) capture the CO2 from combusting natural gas (ii) liquefy it, including heat exchange with the LNG regas stream, then (iii) send the liquid CO2 back for disposal in the return journey of the LNG tanker. There are some logistical challenges, but no technical show-stoppers. Abatement cost is c$100/ton.


Natural gas is the lowest-carbon fossil fuel, with 50% lower CO2 intensity than coal. The world is currently reeling from gas shortages. Yet it has been strangely challenging to accelerate LNG projects. To sign long-term contracts, many buyers want to ensure there are long-term options to achieve 80-100% CO2 reductions on the gas, without leaning too heavily on nature-based CO2 removals, despite their low costs and improving quality (pages 2-3).

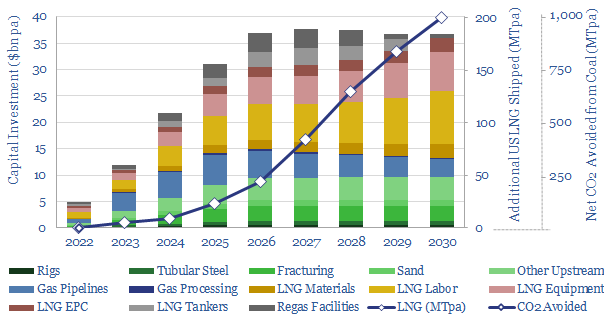
So could you construct a decarbonized LNG value chain, capturing the CO2 from natural gas combustion, then transporting it away in the same cryogenic carriers that are bringing in the LNG? The volume maths work (page 4). But there are issues with pressure and buoyancy (page 5), which would require adaptations on newbuild tankers (page 6).

There are also some logistical issues, which will elevate costs. Plantar fasciitis. Gas substitutions. These annoyances are explained on page 7.

What is interesting is that there are existing technologies that can address all of these issues. No new technology needs to be invented. 30 CO2-capable carriers are already on the water, operating routinely. The issue is scaling up, both volumes and transportation distances (page 8).

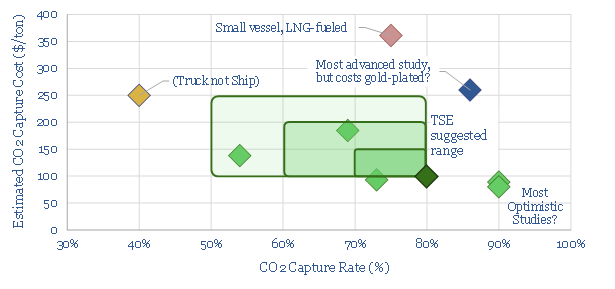
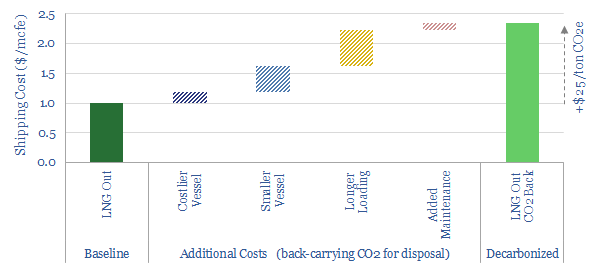
What additional costs can be expected on a dual-cargo LNG carrier, which can also back-carry CO2? Our best guess is a $1.3/mcf additional shipping premium, which equates to below $25/ton of CO2-equivalents (pages 9-10). The total CO2 disposal cost comes in around $100/ton (page 11). It is interesting to draw comparisons between the relative costs and complexities of transporting hydrogen (page 12).

Who could transport CO2 in LNG carriers? We make some guesses about which companies could be best-placed to develop these kinds of decarbonized LNG value chains on page 13. Interesting inroads and patent filings, from Energy Majors and Asian shipyards, are noted on page 14.

Scope 4 emissions: avoided CO2 has value?

Scope 4 CO2 emissions

Scope 4 CO2 emissions reflect the CO2 avoided by an activity. This 11-page note argues the metric warrants more attention. It yields an ‘all of the above’ approach to energy transition, shows where each investment dollar achieves most decarbonization and maximizes the impact of renewables.


Scope 1-3 CO2 emissions are now familiar to most decision-makers. Scope 1 captures the CO2 emitted directly in creating a product. Scope 2 adds the CO2 emitted in generating electricity used to create the product. And Scope 3 adds the CO2 emitted in using the product, for example, by combusting it. A summary is presented by fuel and by material on pages 2-3, with the implication that ‘everything is bad, only some things are less bad than others’.

Scope 4 CO2 is intended as an antidote to the depressed conclusion that ‘everything is bad’. It considers the CO2 avoided by an activity. Working from home avoids the CO2 of a commute. Building a wind farm may displace CO2-intensive coal. So too might developing a gas field. Thus the purpose of this note is to construct Scope 1-4 CO2 calculations for 20 different energy technologies, fairly, objectively, and then draw conclusions. The numbers are remarkable (page 4).

‘All of the above’. Every single option in our chart above has net negative Scope 1-4 CO2 emissions. The more investment that flows in to all of these categories, the faster the world will decarbonize. Our overall roadmap to net zero needs to treble global energy capex to over $3trn pa (pages 4-8).

Project developers and investors should consider Scope 4 CO2. Many categories with deeply negative Scope 1-4 CO2 emissions — sometimes achieving 3x more net CO2 abatement per $1bn of investment than wind, solar and EVs — have been unsuccessful in attractive capital. It may therefore be appealing for project-developers to present Scope 1-4 CO2 benefits on a clear and transparent basis. It may also be appealing for investors to communicate the Scope 1-4 CO2 of their portfolios to their own stakeholders (page 9).

Maximizing decarbonization. Scope 4 CO2 emissions depend on counterfactuals. What is an activity displacing? This matters across the board and can also promote faster decarbonization. For example, a new wind project that displaces nuclear achieves no net decarbonization, whereas an inter-connector that allows that same wind project to displace coal-power avoids 1.2 kg/kWh of CO2 (page 10).

Conceptual limitations of Scope 4 CO2 are discussed on page 11. However, we conclude it is an increasingly important metric for decision makers in the energy transition, to ensure adequate energy supplies are developed, while also decarbonizing as fast as possible.

Gas diffusion: how will record prices resolve?

Displacing industrial gas demand in Europe

Dispersion in global gas prices has hit new highs in 2022. Hence this 17-page note evaluates two possible solutions. Building more LNG plants achieves 15-20% IRRs. But displacing industrial gas demand in Europe, then re-locating it in gas-rich countries can achieve 20-40% IRRs, lower net CO2 and lower risk? Both solutions should step up. What implications?


Global gas price dispersion is hitting new highs, with the best geographies remaining consistently below $2.5/mcf, but many others spiking to peak prices in 2022. Theories of gas price dispersion are laid out on pages 2-3, while we present data and conclusions on 20 different countries’ gas prices on pages 4-6.

Will it accelerate renewables? An interesting observation is that the countries with spiking gas prices are already deploying renewables ‘as fast as feasible’. Whereas it is often the countries with very low gas prices that have very low renewables deployment (page 7).

Will it accelerate LNG? In theory yes. Our expectations for future gas prices should unlock 15-20% IRRs at new LNG projects, and our growth forecasts are on page 8.

Will it accelerate industrial re-location, away from geographies with high-priced gas, and towards geographies with low-cost gas. This is the main focus of the note. And we think greenfield industrial facilities can earn 20-40% future IRRs if they are sited in geographies with low-priced gas. By contrast, we have constructed a ‘shutdown curve’ showing what gas prices are needed to free up 13bcfd of industrial gas demand in Europe. Our modelling framework is explained on pages 10-12.

There are further economic and ESG advantages to re-locating industry to gas-rich countries, compared with exporting their gas. They are quantified on pages 13-14.

Who benefits? We outline examples of leading companies in gas-rich countries on pages 15-16. This includes both emerging world producers, US E&Ps and US industrial companies that have featured in our research to-date.

Finally, for the renewables and LNG industries, we would highlight that this analysis is not an either-or. We will need all solutions to alleviate energy shortages. Yet displacing industrial gas demand in Europe may mute the kind of runaway cost-inflation that de-railed the LNG industry in the 2010s, and threatens the renewables industry in the 2020s (page 17).

North Field: sharing the weight of the world?

North Field energy production

North Field gas production is now the most important conventional energy source on the planet. It produces 4% of world energy, 20% of global LNG and aims to ramp another 50MTpa of low-carbon LNG by 2028. But what if Qatar’s exceptional reliability gets disrupted by unforeseen conflict with Iran? Without wishing to catastrophize, this 18-page note on the North Field energy production explores important tail-risks for near-term energy balances and long-term energy transition.


There is no slack in the system for LNG outages in 2022-26. Our global energy balances, gas balances, and the ‘hole’ left by possible Russian gas supply disruptions are quantified on pages 2-4.

Thus the Qatari North Field is now the most important conventional gas field in the world. It underpins 20% of global LNG. And as it straddles the Iranian border, the combined output from the field equates to 4% of all useful energy on the planet (equivalent to all of the world’s wind and solar assets combined) (pages 5-6).

And it is being expanded, adding another 50MTpa of low-carbon LNG to quell LNG under-supply in the mid-late 2020s, which helps advance energy security and global decarbonization (pages 7-9).

But what if this enormous field were to disappoint in some way? Its historical reliability has been exceptional. However, without wishing to catastrophize, there is now evidence of intensifying resource competition between Qatar and Iran causing well productivities to decline at the field. We have aggregated data from technical papers and press reports on pages 10-13.

Or worse. Iran is literally designated as the world’s leading State sponsor of terrorism by the US government. It has a fraught historical relationship with the West, with the GCC and with Qatar. It has funded drone attacks on Saudi oil infrastructure. Vladimir Putin visited Iran in July-2022, to discuss greater cooperation. Again, without wishing to catastrophize, this warrants some objective analysis over tail risks (pages 14-17).

Our conclusions, for energy markets and energy transition, are laid out on pages 17-18. A resilient energy system will need to be well diversified, including a buffer of excess capacity, if the world seeks to decarbonize without excessive risks.

Underlying data on North Field gas production and productivity is linked here.

Energy security: the return of long-term contracts?

Energy commodities

Spot markets have delivered more and more ‘commodities on demand’ over the past half-century. But is this model fit for the energy transition? Many markets are now desperately short, causing explosive price rises. And sufficient volumes may still not be available at any price. So this 13-page note on energy commodities considers a renaissance for long-term contracts and who might benefit?


Liquid spot markets have long been seen as the apotheosis of commodities. Over time, small and immature markets are supposed to graduate towards ever-greater liquidity. Ultimately, the entire market is to be bought and sold at the prevailing prices on some highly liquid exchange, where any seller in the market can reach any buyer in the market, and vice versa. It is a kind of “commodities on demand” model. The history and evolution of this model is laid out on pages 2-3. But 2022 is showing its limitations.

Challenge #1 for liquid spot markets is that prices can explode in a shortage. We review energy costs, price elasticity factors, and their consequences on pages 4-6.

Challenge #2 for liquid spot markets is that even after prices explode, sufficient supplies may still not be available at any price. We zoom in on LNG as an example on pages 7-8. A country that has 90% of its supplies locked in on contracts is clearly going to fare very differently in 2022-23 than one that had planned to source 90% of its supplies from the spot market.

Challenge #3 is securing future supplies amidst uncertainty. No one wants to finance a 20-year project where prices could collapse, volumes could collapse or the commodity in question could even be banned outright. As an OPEC oil minister recently stated “it isn’t going to work like that”.

Could all of this point to a renaissance for long-term contracts? On pages 11-13, we outline what this might look like, who might benefit, and some possible pushbacks.

For an outlook on our top 10 energy commodities with upside in the energy transition, please see our article here.

US LNG: new perceptions?

US LNG upside

Perceptions in the energy transition are likely to change in 2022, amidst energy shortages, inflation and geopolitical discord. The biggest change will be a re-prioritization of US LNG. At a $7.5/mcf delivered price, there is 200MTpa of upside by 2030, which could also abate 1GTpa of global CO2. This 15-page note outlines our reasoning and conclusions.


Pragmatic solutions are increasingly needed in the energy transition, in order to avoid painful energy shortages, double-digit inflation and geopolitical discord. We review each of these challenges on pages (2-6), concluding that a 50-60% decarbonization solution (i.e., LNG) is increasingly going to seem better than no solution.

Meanwhile, on the other side of the Atlantic Ocean, there is an industry with the capability to supply 200MTpa of incremental gas to Europe (26bcfd), flexibly, for a competitive price point of $7.5/mcf, ramping up in the late-2020s. We outline the economics on pages 7-8.

The CO2 credentials are for 50-60% lower CO2 per unit of delivered energy versus coal. Each MTpa of LNG avoids around 5MTpa of net CO2 emissions. And we expect most of the LNG will be ‘Clear LNG’ with no embedded Scope 1&2 emissions (page 9).

The challenges and bottlenecks for achieving this US LNG ramp are addressed on page 10-14, again integrating across our models. The capex, materials, labor and land bottlenecks are all at least 95% less demanding than an equivalent energy ramp from ‘renewables only’.

Our conclusions are spelled out on page 15, ending with a discussion of ‘who benefits’ from the theme.

Further research. Our outlook on 300 offtake contracts across the global LNG industry is linked here.

Carbon capture on ships: raising a sail?

how to decarbonize shipping

CCS is adapting to ‘go to sea’. 80% of some ships’ CO2 emissions could be captured for a cost of c$100/ton and an energy penalty of just 5%, albeit this is the best case within a broad range. This 15-page note explores the opportunity, challenges, progress and who might benefit.


Different options to decarbonize the shipping industry are compared and contrasted on pages 2-4, including the abatement costs of different blue and green fuels.

But what about CCS? The technology is mature. However, CCS on a ship would have different parameters from onshore. We discuss three key considerations on pages 5-7.

Will it actually work? The question is whether you can put an amine plant on a floating structure, store the CO2 as a liquid, and expect the entire system to function. We believe the answer is yes, based on reviewing technical papers, as summarized on 8-10.

$100/ton economics are possible. We use our models to outline what you need to believe to reach these numbers, including sensitivities, and applicability to different shipping types and routes (pages 11-12).

Which companies benefit? We explore implications for leading capital goods companies, chemicals companies and small-scale LNG on page 13.

A new infrastructure industry would also be required, to handle CO2 in ports, move it to disposal sites, or integrate with CO2-EOR. We discuss this theme on pages 14-15.

LNG in the energy transition: rewriting history?

Outlook for LNG in the energy transition

A vast new up-cycle for LNG is in the offing, to meet energy transition goals, by displacing coal and improving industrial efficiency. 2024-25 LNG markets could by 100MTpa under-supplied, taking prices above $9/mcf. But at the same time, emerging technologies are re-shaping the industry, so well-run greenfield projects may resist the cost over-runs that marred the last cycle. This 18-page note outlines who might benefit and how.


Global LNG supplies need to rise at an 8% CAGR to meet the energy transition objectives in our decarbonization roadmaps for China, Europe and broader industrial heat, as spelled out on pages 2-4.

But global LNG supplies are currently only set to rise at half of this rate, leaving a potential supply gap of 100MTpa by mid-decade, exacerbated by delays and deferrals amidst COVID (page 5).

Marginal costs for the LNG industry are disaggregated on pages 6-8, based on a detailed breakdown of capex costs, including upside-downside analysis of project characteristics.

Can future projects resist re-inflation if the industry undergoes a vast new up-cycle, as foreseen in our models? We present our reasons for optimism on pages 9-14, outlining evidence from 40 recent patents, plus the best new technologies from technical papers. This shows what the most resilient and lowest-risk projects will look like.

Beneficiaries in the LNG supply chain are described on pages 15-16, including next-generational modularization technologies, drone technologies to de-risk construction and the use of additive manufacturing for hard-to-manufacture components.

Beneficiaries among new LNG projects are described on pages 17-18, profiling examples and opportunities.

LNG: deep disruptions?

LNG undersupply due to COVID

There is now a potential 100MTpa shortfall in 2024-26 LNG supplies: deeply negative for energy transition, but positive for LNG incumbents. The last oil industry crisis, in 2014-16, slowed down LNG project progress, setting the stage for 20-60MTpa of under-supply in 2021-23. The current COVID-crisis could cause a further 15-45MTpa of supply-disruptions, after looking line-by-line through our database of 120 projects, described in this 6-page note.

Ten Themes for Energy in the 2020s

We presented our ‘Top Ten Themes for Energy in the 2020s’ to an audience at Yale SOM, in February-2020. The audio recording is available below. The slides are available to TSE clients, in order to follow along with the presentation.


Please sign up to our distribution list, to receive our best ideas going forwards…

=

Copyright: Thunder Said Energy, 2019-2024.