Solar surface: silver thrifting?

silver use in solar

Ramping new energies is creating bottlenecks in materials. But how much can material use be thrifted away? This 13-page note is a case study of silver use in solar. Silver intensity halved in the past decade, and could halve again? Conclusions matter for solar companies, silver markets, other bottlenecks.


An important goal for curing energy shortages and accelerating the energy transition is to accelerate solar capacity additions. Our solar forecasts are discussed here, modelled here and re-capped on page 2.

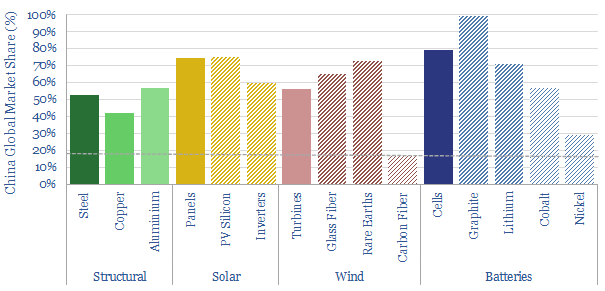
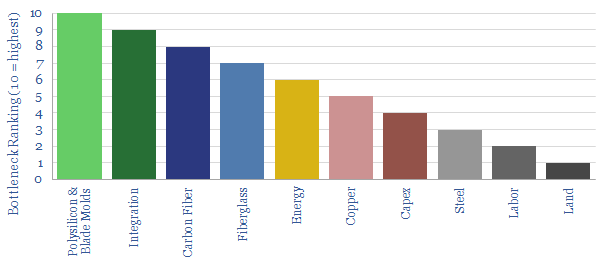
Solar bottlenecks. There are seven separate materials where our solar ramp-up is likely to consume well over 20% of today’s total global market balances. However, this is assuming materials intensity remains constant (in grams/kW or kg/kW) (page 3).

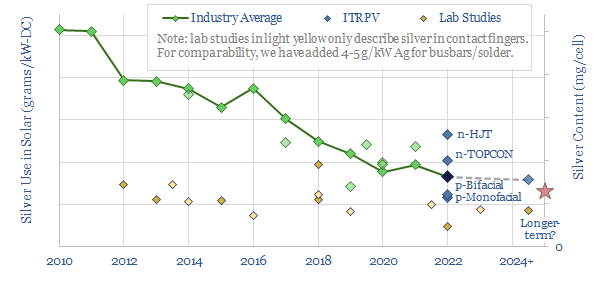
A silver case study. Silver intensity of the average installed solar module has recently halved. So can it halve again? Important uses of silver are in the front contact fingers, busbars and solder of modern solar cells. This is explained on pages 4-6.

What determines the amount of silver use in solar? To answer this question, we have modeled the losses on the surface of a solar cell, due to resistance in the emitter layer, resistance in the contact layer and due to shading. The engineering equations are strangely beautiful (pages 7-8).

Can you thrift silver from a solar cell? The answer is yes. Especially if silver prices explode. It is easy if you don’t mind sacrificing electrical efficiency. Trade-offs and quantities are explored on page 9.

Can you reduce silver use in solar, while also increasing efficiency? Intriguingly, the answer here is also yes. To an extent. Especially with improved printing technologies (pages 10-11).

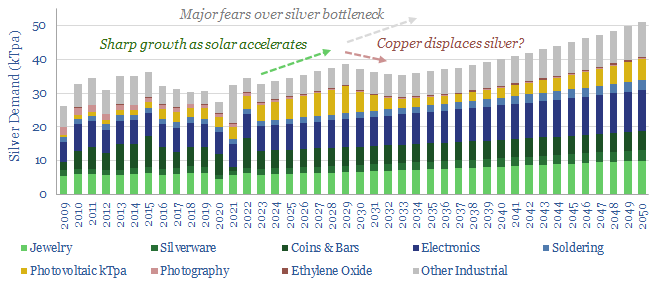
Silver markets. Our conclusions for silver markets are updated (in kTpa terms). We still see solar tightening silver markets, after balancing volume growth, changing cell designs (e.g., TOPCons) and thrifting. But continued thrifting partly mutes the upside (page 12).

Company implications. Leading solar manufacturers that optimize silver loadings can easily derive 0.3 – 1.0% benefits in operating margins. We think silver is a soft bottleneck for solar’s ascent and not a hard bottleneck (distinction here). Improved contact printing technologies may also be pulled into the money (page 13).

Solar volatility: tell me lies, tell me sweet little lies?

short-term volatility of solar

This 20-page note quantifies the statistical distribution of the short-term volatility of solar power plants, by evaluating second-by-second data, for an entire year. Solar output typically flickers downwards by over 10%, around 100 times per day. We want to ramp solar in the energy transition. But how can industrial processes truly be ‘powered by solar’? Buffering the volatility creates opportunities for gas and nuclear back-ups, inter-connectors, supercapacitors, smart energy and power electronics?


Fleetwood Mac released their classic hit, ‘Little Lies’, in the winter of 1987. In the song, Christine McVie describes a once-wonderful relationship that has ultimately run its course. There is a reluctance to accept this fact about the future. Hence the song’s chorus pleads “tell me lies, tell me sweet little lies”. The refrain is then hauntingly echoed by Stevie Nicks and Lindsey Buckingham (“tell me, tell me lies!”).

This research note is a statistical analysis of an entire year’s second-by-second solar volatility (our methodology is laid out on pages 2-5). It is a nerdy and numerical topic. Hence without wishing to dilute the importance of this issue, we are going to draw some inspiration from Fleetwood Mac in our chapter headings.

For example, should solar power keep ramping up forever, to over 50% of future power grids? Or might solar slow down, after running its course, and ramping to 20-30%? And are analysts like us, who want to see solar capacity additions ramp up by 3-5x in the energy transition, wilfully asking to be told sweet little lies about overcoming short-term volatility issues? Our goal is to use data and find genuine, objective answers to these questions.

Variability. The best day, a typical day and the worst day of second-by-second solar volatility are presented on pages 6-9. For example, the chart above shows the second-by-second solar output at a typical-good day, with relatively little short-term volatility.

The statistical distribution of different days’ solar volatility is plotted in candlestick charts and marimekko charts on pages 10-11. There is volatility in the volatility itself.

“Powered by solar”. Can we power typical industrial processes purely from input feeds like the ones we have shown in our chart above, and throughout this report? Issues that need to be overcome are discussed on pages 12-15. They include annoyingness, lost output, mission-critical loads, damaged work-in-progress and faster degradation rates at industrial machinery.

Overcoming volatility. We want to ramp solar as much as possible as part of our ‘roadmap to net zero‘. We think a future grid with 20-30% solar are optimal, which involves a 3-5x acceleration in the pace of annual solar deployments. However, smoothing the short-term volatility, we think, is also going to create concomitant opportunities (page 16).

The best opportunities to de-bottleneck short-term solar volatility include diversified and resilient power grids, gas and nuclear back-ups, super-capacitors, inter-connectors, smart-energy, demand shifting and power electronics. The merits, drawbacks and costs (in $/kW) of these different solutions are presented on pages 17-20.

This note into the short-term volatility of solar (i.e., second-by-second) aims to complement our other research into the long-term volatility of solar (i.e., year-by-year). It is interesting that building out power grids and inter-connectors helps to resolve both issues.

Scope 4 emissions: avoided CO2 has value?

Scope 4 CO2 emissions

Scope 4 CO2 emissions reflect the CO2 avoided by an activity. This 11-page note argues the metric warrants more attention. It yields an ‘all of the above’ approach to energy transition, shows where each investment dollar achieves most decarbonization and maximizes the impact of renewables.


Scope 1-3 CO2 emissions are now familiar to most decision-makers. Scope 1 captures the CO2 emitted directly in creating a product. Scope 2 adds the CO2 emitted in generating electricity used to create the product. And Scope 3 adds the CO2 emitted in using the product, for example, by combusting it. A summary is presented by fuel and by material on pages 2-3, with the implication that ‘everything is bad, only some things are less bad than others’.

Scope 4 CO2 is intended as an antidote to the depressed conclusion that ‘everything is bad’. It considers the CO2 avoided by an activity. Working from home avoids the CO2 of a commute. Building a wind farm may displace CO2-intensive coal. So too might developing a gas field. Thus the purpose of this note is to construct Scope 1-4 CO2 calculations for 20 different energy technologies, fairly, objectively, and then draw conclusions. The numbers are remarkable (page 4).

‘All of the above’. Every single option in our chart above has net negative Scope 1-4 CO2 emissions. The more investment that flows in to all of these categories, the faster the world will decarbonize. Our overall roadmap to net zero needs to treble global energy capex to over $3trn pa (pages 4-8).

Project developers and investors should consider Scope 4 CO2. Many categories with deeply negative Scope 1-4 CO2 emissions — sometimes achieving 3x more net CO2 abatement per $1bn of investment than wind, solar and EVs — have been unsuccessful in attractive capital. It may therefore be appealing for project-developers to present Scope 1-4 CO2 benefits on a clear and transparent basis. It may also be appealing for investors to communicate the Scope 1-4 CO2 of their portfolios to their own stakeholders (page 9).

Maximizing decarbonization. Scope 4 CO2 emissions depend on counterfactuals. What is an activity displacing? This matters across the board and can also promote faster decarbonization. For example, a new wind project that displaces nuclear achieves no net decarbonization, whereas an inter-connector that allows that same wind project to displace coal-power avoids 1.2 kg/kWh of CO2 (page 10).

Conceptual limitations of Scope 4 CO2 are discussed on page 11. However, we conclude it is an increasingly important metric for decision makers in the energy transition, to ensure adequate energy supplies are developed, while also decarbonizing as fast as possible.

Solar contacts: silver bullet?

Solar contacts silver and copper

The front contacts in today’s solar cells are made of screen-printed silver. Thus solar cells absorbed 11% of 2021’s silver market, and growing. Solar silver contacts can be substituted with copper. But manufacturing is more complex and c5x more costly. So we expect a silver spike, then a switch. This 16-page note explains our outlook, and who benefits?


Silver demand in the solar industry is currently running at 3.6kTpa, or 11% of the total global silver market, and growing. The use of silver in the front contacts of solar cells is explained on pages 2-4. We envisage that silver is going to become a bottleneck.

Silver’s advantages are that it is the most conductive metal in the world, it is unreactive, and it is easy to screen print. These advantages are explained on pages 5-8, including an overview of the screen printing process for manufacturing front contacts, and a quantification of the costs (in $/kW).

Copper is 100x cheaper and 1,000x more abundant than silver. However, there are two key challenges for replacing silver with copper in the front contacts of solar cells. It diffuses into the silicon, where it is an “efficiency killer”. And it cannot readily be screen-printed. These issues are spelled out on pages 8-9.

But copper contacts can be manufactured. It is simply a more complex and costly process. Examples of different processes, and their approximate costs, are outlined on pages 10-11.

In particular, we focus in upon SunDrive, a private company based in Australia, which made headlines in 2021, and we have reviewed its patents (pages 12-13).

Our outlook on silver and copper solar contacts is therefore that silver prices will spike, then this will ultimately motivate the industry to dampen the inflationary impacts, by switching out silver for copper. This view, and our best guesses on timings, are presented on pages 14-15.

Finally, the note ends with a review of leading silver mining companies, which will clearly be impacted by the solar industry’s whipsawing silver demand (page 16).

To read about our outlook on PV silicon costs, please see our article here.

FACTS of life: upside for STATCOMs & SVCs?

Upside for STATCOMs

Wind and solar have so far leaned upon conventional power grids. But larger deployments will increasingly need to produce their own reactive power; controllably, dynamically. Demand for STATCOMs & SVCs may thus rise 30x, to over $25-50bn pa. This 20-page note outlines upside for STATCOMs and who benefits?


This 20-page research note is about controlling reactive power in increasingly renewable-heavy grids. We believe this theme is going to become increasingly important, but it has been overlooked, for two reasons, laid out on pages 2-3.

What is reactive power? After reviewing hundreds of technical papers and patents, our ‘best explanation’ is set out on pages 4-7, to explain concepts such as real power, reactive power, power factor, power triangles, phase angle and VARs.

Lean on me. Wind and solar assets inherently produce no reactive power and may even have consumed it. This was fine in the early days, as renewables assets could rely on the large and controllable output of reactive power from spinning generators. But regulations are tightening. And if renewables are to dominate future grids, replacing spinning generators, then they will increasingly need to produce their own reactive power (page 8).

FACTS = Flexible AC Transmission Systems. We review different options for renewables to control reactive power on pages 9-14. The discussion covers switched capacitor banks, synchronous condensers, upsized inverters, Static VAR Compensators (SVCs) and Static Synchronous Compensators (STATCOMs). In each case, we review the costs ($/kVAR), advantages and challenges for each technology. We think STATCOMs are taking the lead to back up large wind projects.

Market sizing for STATCOMs and SVCs market suggests that a 30x ramp-up is not mathematically inconceivable. If wind capacity additions ramp from 100 GW pa to 300-500 GW pa, and we install 0.5 MVAR/MW of STATCOMs/SVCs at an average of $160/kVAR, then this would become a $25-50bn pa market. Huge numbers. Worked examples and quotes from technical papers are also given (page 15-16).

Who benefits? Leading companies in STATCOMs and SVCs are profiled on pages 17-20, after reviewing 2,500 patents. The market is incredibly concentrated, with two leading large-caps, and a handful of smaller and interesting semi-pure plays. Our screen is linked here.

To read more about the upside for STATCOMs & SVCs, please see our article here.

Capacitor banks: raising power factors?

Wind and solar power factor corrections

Wind and solar power factor corrections could save 0.5% of global electricity, with $20/ton CO2 abatement costs at typical facilities in normal times, and 30% pure IRRs during energy shortages. They will also be needed to integrate more new energies into power grids. This 17-page note outlines the opportunity in capacitor banks, their economics and leading companies.


Reactive power is needed to create magnetic fields within ‘inductive loads’ like motors, electric heat, IT hardware and LEDs. But it is wasteful. 0.8-0.9 x power factors mean that 10-20% of the flowing current is not doing any useful work; it is simply amplifying I2R resistive losses; and if it is not compensated, then voltage drops can de-stabilize the grid.

All of these statements might seem a little bit confusing. Hence, after reading hundreds of pages into this topic, our ‘best explanation’ of the physics, the problem and the solution are set out on pages 2-6 of the report. We would also recommend the excellent online videos from the Engineering Mindset.

Power factor correction technologies are seen accelerating for three reasons. Saving electricity is increasingly economic amidst energy shortages (pages 7-8).

Second, they will enable greater electrification for around 30% less capex (pages 9-11).

Third, the rise of renewables will see large rotating turbines (especially coal) replaced with distributed generators that inherently offer no reactive power (wind and solar). This is not a “problem”. It simply requires conscious power factor correction (pages 12-14).

What challenges? Capacitor banks are likely to be the lowest cost solution for power factor correction, but they are also competing with other technologies, as reviewed on page 15. For ultra-high quality grid-scale wind and solar power-factor corrections, we think there is greater upside in STATCOMs (note here).

What opportunities? Leading companies are profiled on pages 16-17, based on reviewing patents, and include the usual suspects in power-electronic capital goods.

East to West: re-shoring the energy transition?

re-shoring the energy transition

China is 18% of the world’s people and GDP. But it makes c50% of the world’s metals, 60% of its wind turbines, 70% of its solar panels and 80% of its lithium ion batteries. Re-shoring the energy transition will likely be a growing motivation after events of 2022. This 14-page note explores resultant opportunities.


World events in 2022 have created a new appetite for self-reliance; avoiding excessive dependence upon particular suppliers, in case that relationship should sour in the future. China’s exports are 5x Russia’s. And it dominates supply chains that matter for the energy transition. The trends and market shares are quantified on pages 2-4.

There are five challenges that must be overcome, in order to re-shore value chains from China to the West: input materials, energy costs, 2-3 re-inflation risks, dumping and general Western NIMBY-ism. We outline each challenge on pages 5-6.

Re-shoring the energy transition and its best opportunities are summarized, looking across all of our research, for metals and materials (page 7), wind (page 8), solar (page 9) and batteries (pages 10-11). In each case, where would be the most logical to site the infrastructure, and which companies are involved?

An unexpected implication of re-shoring these value chains is that their underlying energy demand would be re-shored too. Our current base case is that Western energy demand per capita has peaked and Western oil demand is in absolute decline. These markets may be re-shaped, with resultant opportunities for infrastructure investors (pages 12-14).

For an outlook on China’s coal industry and how we compare Chinese coal companies to Western companies, please see our article here.

Renewables: can they ramp up faster?

Bottlenecks on renewable capacity

How fast can wind and solar accelerate, especially if energy shortages persist? This 11-page note reviews the top ten bottlenecks that set the ‘upper limit’ on renewables’ capacity additions. Seven value chains will tighten enormously in the coming years. Paradoxically, however, ramping renewables could exacerbate near-term energy shortages.


Our growing fear for 2022 is that a full-blown energy crisis may be brewing. The most ‘obvious’ solution is going to be to accelerate renewables. Hence this note models out a hypothetical scenario where the world tried to scale up renewables about 5x faster, adding 1TW pa of new wind and solar capacity each year (page 2).

Capex is the first bottleneck, as our scenario would require almost $2trn of spending on wind and solar, which is 3x total global energy investment from the past half-decade. This is a lot of capital, but not a show-stopper in our assessment (page 3).

Materials are more challenging, and we map out the total demand pull on global steel, copper, silicon, fiberglass and carbon fiber; and we also discuss the CO2 and energy intensity of each of these materials in turn (pages 4-7).

Specialized supply chains tighten most. We identify three specific industries which would effectively see unlimited pricing power in our scenario (pages 7-8).

Energy paybacks present the biggest paradox. It takes 2-years for the average wind and solar asset to repay the energy costs of manufacturing and installing it. Hence in the near-term, a very rapid ramp-up of renewables would tend to exacerbate energy shortages (page 9).

Land and labor are often cited as bottlenecks on ramping up renewables, but we do not think these are material barriers, by contrast to the others (pages 10-11).

Our conclusion is that appetite to scale renewables will rise sharply in 2022. It will
not resolve near-term energy shortages. But inflation will accelerate in ‘bottlenecked’
parts of the supply chain. Investors can help by debottlenecking those bottlenecks.

Decarbonizing global energy: the route to net zero?

Decarbonizing global energy

This 18-page report revises our roadmap for the world to reach ‘net zero’ by 2050. The average cost is still $40/ton of CO2, with an upper bound of $120/ton, but this masks material mix-shifts. New opportunities are largest in efficiency gains, under-supplied commodities, power-electronics, conventional CCUS and nature-based CO2 removals.

Important note: our latest roadmap to net zero is from 2022, published here. But this note remains on our website, for transparency into our views at the end of 2021.


This note looks back across 750 of our research publications from 2019-21 and updates our most practical, lowest cost roadmap for the world to reach ‘net zero’. Our framework for decarbonizing 80GTpa of potential emissions in 2050 is outlined on pages 2-3.

Our updated roadmap is presented on pages 4-6. Most striking is the mix-shift. New technologies have been added at the bottom of the cost curve. Other crucial components have re-inflated. And we have also been able to tighten the ‘risking factors’ on earlier-stage technologies, thus an amazing 87% of our roadmap is not technically ready.

The resulting energy mix and costs for the global economy are spelled out on pages 7-8, including changes to our long-term forecasts for oil, gas, renewables and nuclear.

What has changed from our 2020 roadmap? A full attribution is given on pages 9-10. Disappointingly, global emissions will be 2GTpa higher than we had hoped mid-decade, as gas shortages perpetuate the use of coal.

A more detailed review of our roadmap is presented on pages 11-18. We focus on summarizing the key changes in our outlook in 2021, in a simple 1-2 page format: looking across renewables, nuclear, gas shortages, inflationary feedback loops, more efficiency gains, carbon capture and storage and nature-based carbon removals.

Solar decline rates: causes and solutions?

Causes of solar decline rates

The average solar asset declines at 2.5% per year. This 14-page note reviews the causes of solar decline rates. We find humid climates moderate Potential Induced Degradation, adding a relative headwind in coastal geographies and floating solar. But an exciting way to mitigate declines is emerging via smaller inverters.


Data into solar decline rates are presented on pages 2-3, describing how we have reached our 2.5% decline rate calculation based on 3,200 assets in the US, and plotting the average capacity factor of assets in Europe.

The impacts of solar degradation are quantified on pages 4-5, detracting from IRRs, adding to levelized costs and investment requirements. But this also creates an opportunity to understand and mitigate the declines.

What causes solar degradation? Our goal on pages 6-8 is to explain solar declines from first principles, underlining the main mechanisms of Potential Induced Degradation.

Cure by location is explored on pages 9-10. We find that humidity is a major moderating variable for solar declines. This helps the case for solar in hot, dry climates.

Cure by inverter strategy is explored on pages 11-13. Our work supports the shift from central inverters towards smaller inverters, possibly micro-inverters at utility scale. Companies covered in the report include Enphase, SolarEdge and Shoals.

Other cures, observations and conclusions into the causes of solar decline rates are laid out on page 14.

Copyright: Thunder Said Energy, 2019-2024.