Kardashev scale: a futuristic future of energy?

Possible uses of basically free solar energy.

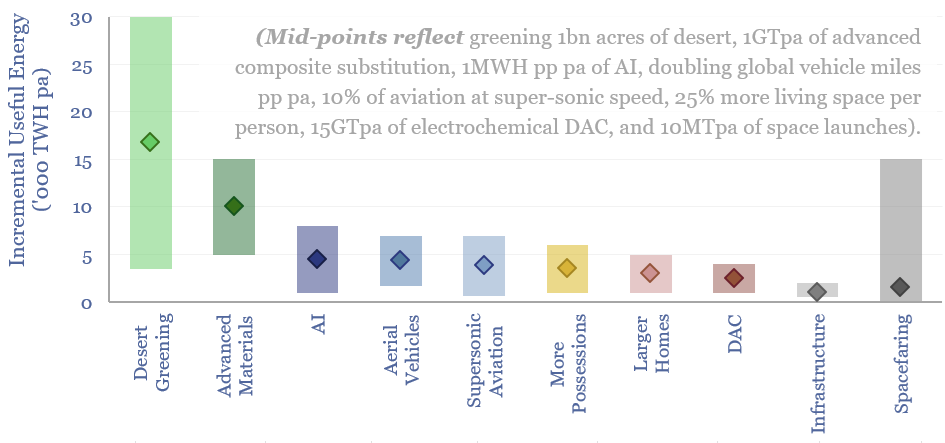
A Kardashev scale civilization uses all the energy it has available. Hence this 16-page report explores ten futuristic uses for global energy, which could absorb an additional 50,000 TWH pa by 2050 (60% upside), mainly from solar. And does this leap in human progress also allay climate concerns better than pre-existing roadmaps to net zero?


Most long-term energy forecasts simply lack imagination. In particular, most energy transition scenarios leave little room for new demand, which is why AI was a shock in 2024. But what if civilization was capable of harnessing vastly more energy?

The Kardashev scale was proposed by Nikolai Kardashev, in 1964. It measures the technological advancement of a civilization according to the amount of energy it is capable of harnessing and using. Kardashev Level 1.0 equates to a civilization that can use all the available energy on its planet. Currently, the useful energy consumption of all human civilization is equivalent to about 0.01% of the solar energy reaching the Earth’s surface at ground level, as discussed on pages 2-3.

In this note, we will go full sci-fi, and indulge the fantasy of near-infinite energy, e.g., from vast quantities of future solar available at 1c/kWh? How much incremental energy demand might human civilization want? Where could it go? And does this produce better human outcomes than limiting global energy demand in order to reach net zero by 2050?

Incremental demand for living space and material possessions are probably the two most obvious yet boring use cases, with demand sensitivities on pages 4-5.

More interesting and futuristic, however, the bulk of this note explores advanced materials that push the limits of engineering (page 6), an unstoppable rise of AI energy potentially culminating in Matrioshka Brains powered by Dyson Spheres (!) (page 7), a return of supersonic aviation (page 8), aerial vehicles (page 9), greening 1bn acres of desert (page 10), infrastructure projects that transform urban landscapes (page 11), electrochemical DAC to construction materials (page 12) and of course space-faring (page 13).

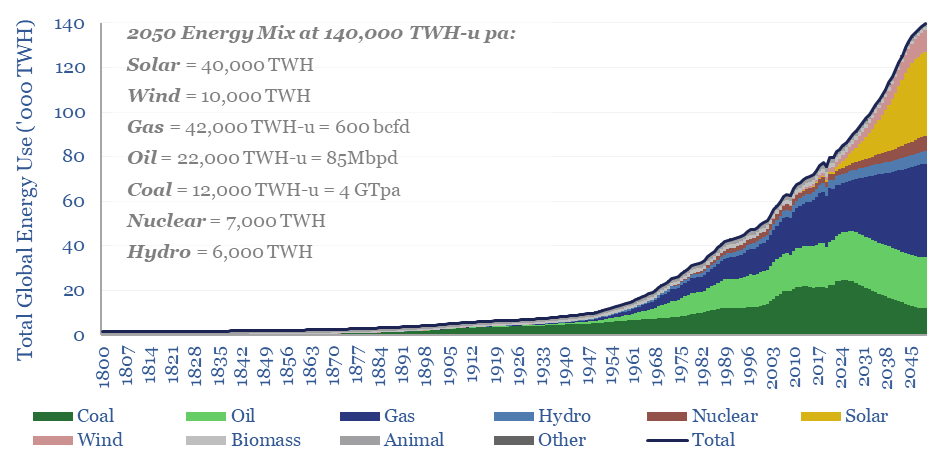
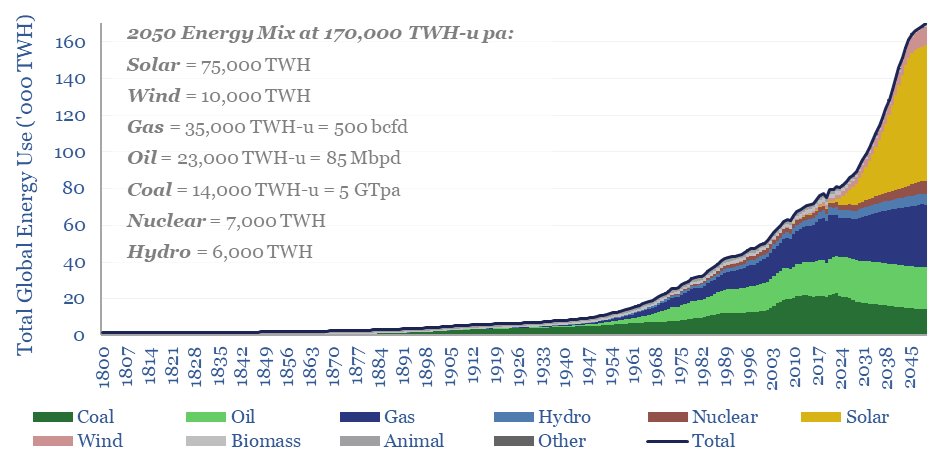
We propose how low-cost solar would provide the vast majority of the energy needed for these futuristic new energy uses, yet oil runs sideways and gas use still rises, in this future energy system (chart below), based on the economic reasoning on pages 14-16.

Possible energy demand in 2050 in the sci-fi scenario where solar becomes dirt-cheap, at around 1c/kWh.

We started this note as a science fiction fantasy. But after writing it, we think this kind of energy transition is actually more likely to play out than our last published roadmap to net zero, whose deliverability has recently started to seem less likely.

Energy transition: classic blunders?!

Classic blunders famously include “never start a land war in Asia” and “never go up against a Sicilian when death is on the line”. But this video sets out what we believe are the three classic blunders that should be avoided by energy analysts, and in the energy transition, based on our own experiences over the past 15-years.


2024 has been a particularly forceful year for busting through blunders, so the video contains important reflections, and early resolutions for 2025, as we are trying to learn from the scars we have accumulated over the past six years of TSE research.

Our first classic blunder for energy analysts is never to assume that what you want to happen in the energy transition will defy the laws of economics. Costs matter. This is why we have ended up building over 200 economic models.

Our second classic blunder for energy analysts is never to write that a new physical or chemical process technology is “right on the cusp of commercialization”. We enjoy exploring new technologies, and deep-diving into patent libraries, but usually new technologies take longer than expected to reach commerciality.

Our third classic blunder is never to bet against semiconductor technologies. This seems important as the biggest theme in 2024 energy markets has been the rise of AI, but another semiconductor technology is solar, and there are other potentially world-changing semiconductor energy technologies waiting in the wings.

In case you are wondering, the video was recorded in Kadriorg Park, in Tallinn, because a sunny winter day in Estonia demands going outside!! Although it was somewhat windy in the park, and hence please accept our apologies that the audio went a little bit funny in places, and makes Rob sound like a robot.

Some recent research that seeks to avoid these energy transition blunders, and draw out opportunities discussed in the video, is linked below…

Cool concept: absorption chillers, data-centers, fuel cells?!

Working principle of absorption chillers

Absorption chillers perform the thermodynamic alchemy of converting waste heat into coolness. Interestingly, solid oxide fuel cells and absorption chillers may have some of the lowest costs and CO2 for powering and cooling AI data-centers. This 14-page report explores the opportunity, costs and challenges.


Some power generation sources produce both electricity and waste heat. Absorption chillers can convert that waste heat into coolness. Hence could this combination provide both data-center power and data-center cooling, more economically and with lower carbon, than the traditional approach of using electrically-driven HVAC? This question felt interesting to explore in a dedicated research note.

A fascinating avenue to get net zero back on track, more broadly, while also enhancing energy security and competitiveness, would be to capture more waste heat, including by turning heat into coolness, via absorption chillers. Market sizes are quantified on pages 2-3.

How does an absorption chiller work? The four key stages, in the evaporator, absorber, generator and condenser, are described clearly and concisely on pages 4-5.

What does an absorption chiller cost? Capex, opex and total costs of cooling are drawn from our economic model of absorption chillers, in cents per ton-hour and in $/kW-th, and compared with mechanical HVAC equipment on pages 6-8.

Hence how do the costs compare for powering and cooling a data-center using (i) grid power and mechanical HVAC (ii) CCGTs and mechanical HVAC (iii) simple cycle gas turbines and absorption chillers (iv) Solid Oxide Fuel Cells and absorption chillers? The answers on this comparison surprised us, per pages 9-11.

Challenges with fuel cells and absorption chillers should be considered, before getting overly excited, hence some recent successes and issues are summarized on pages 12-13.

Companies producing absorption chillers and solid oxide fuel cells, including our review of Bloom Energy’s patents, are on page 14.

Grid-forming inverters: islands in the sun?

The grid-forming inverter market may soon inflect from $1bn to $15-20bn pa, to underpin most grid-scale batteries, and 20-40% of incremental solar and wind. This 11-page report finds that grid-forming inverters cost c$100/kW more than grid-following inverters, which is inflationary, but integrate more renewables, raise resiliency and efficiency?


The output of a solar module, a lithium ion battery, or a rectified wind turbine generator comes in the form of Direct Current, i.e., a steady flow of charge.

However, power is transmitted and mostly consumed as Alternating Current, a smooth sine wave of rising and falling voltage and current. This makes it easier to alter voltages in transformers and drive motors that are 40% of global electricity.

Inverters are used to convert DC to AC. In fact, there are two ways of synthesizing an AC waveform from a DC generation source: using pulse-width modulation or by stacking transistors, as outlined on pages 2-3.

But how do the inverters know what waveform to synthesize, i.e., at what frequency, phase angle and in synchrony with the rest of the grid? Historically the answer has almost entirely been via grid-following inverters, as described on page 4.

The issue that arises for energy systems with high penetrations of inverter-based resources – wind, solar and batteries – is that grids become unstable once grid-following inverters start providing around 60-70% of the instantaneous power, as described on pages 5-6.

Grid-forming inverters are the solution to enable stable grids with higher instantaneous shares of inverter-based generation. We outline how they work, and what they cost, on pages 6-7.

Other advantages of grid-forming inverters appear in small grids, in island grids, or when preventing the inefficient operation of rotating generators at low loads, which in turn can amplify fueling costs and CO2 intensity factors by 2-4x, per pages 8-9.

Our estimates of market sizing for grid-forming inverters are outlined on page 10 and a short screen of leading grid-forming inverter companies is on page 11, alongside some conclusions.


Energy transition: losing faith?

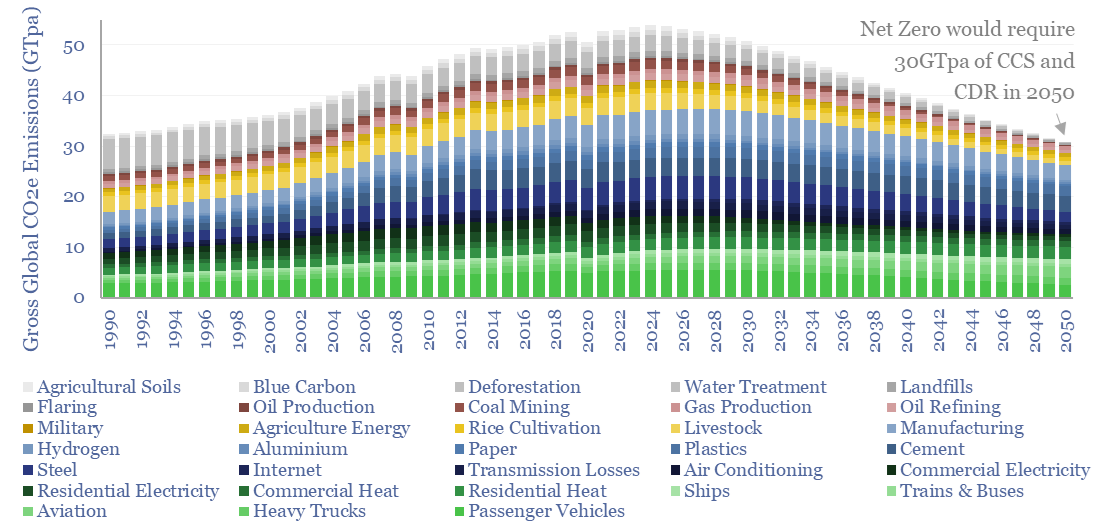
Global CO2 equivalent emissions by source projected up to 2050

What if achieving Net Zero by 2050 and/or reaching 1.5ยบC climate targets now has a <3% chance of success, for reasons that cause decision-makers to backtrack, and instead focus on climate adaptation and broader competitiveness? This 14-page report reviews the challenges. Can our Roadmap to Net Zero be salvaged?


The goal of research is neither to cheerlead for what you want to happen, or to whine about what you donโ€™t want to happen. It should be to predict what will happen. Even when you don’t like the predictions.

Hence every December we have attempted to distil our research from the previous year,ย into a Roadmap to Net Zero, which suggests the most likely trajectory where the world could reach zero net CO2 emissions by 2050, thereby limiting climate change to 1.5 โ€“ 2.0ยบC of warming.

Unfortunately, this year, we increasingly fear our Roadmap to Net Zero is not what will happen. The purpose of this note is to explain why.

The first challenge is that we are seeing lower willingness to pay for decarbonization than we expected, per the evidence on pages 5-6.

The second challenge is a more adversarial world, where issues such as defence, self-sufficiency and competitiveness threaten themes such as coal-to-gas switching and climate coordination, per pages 7-11.

The third challenge is slow progress with CCS and CDRs. We find it unlikely that gross emissions will fall below 30GTpa by 2050, but can anything close to 30GTpa be captured and/or offset, per pages 12-13?

Hence our most likely scenario is now for Net Zero to be delayed by 2-3 decades and for 2.5-3ยบC of warming by 2100. Around 1.3ยบC of this warming has already happened.

What could still salvage a 1.5-2.0ยบC Climate Scenario, versus the 2.5-3ยบC world that increasingly looks more likely, could be some game-changing technology, emerging at the bottom of the cost curve: AI breakthroughs, thermo-electrics, solar + battery costs collapsing sharply, fusion, electrochemical DAC.

And maybe we should not fixate too much on achieving Net Zero by 2050, or the precise level of warming in 2100, which no one really knows anyway. If you can find good opportunities, which boost competitiveness (and are not overly reliant upon fickle policy support!!), then these are the ways to improve the world’s energy system from the bottom up.

Solar trackers: following the times?

A solar tracker improves solar generation by 25%

Solar trackers are worth $10bn pa. They typically raise solar revenues by 30%, earn 13% IRRs on their capex costs, and lower LCOEs by 0.4 c/kWh. But these numbers are likely to double, as solar gains share, grids grow more volatile, and AI unlocks further optimizations? This 14-page report explores the theme and who benefits?


A solar module is a 2.7 m2 rectangle, whose internal semiconductors convert incoming electromagnetic radiation into a direct current via the photovoltaic effect. To maximize energy production, ideally, the entire 2.7 m2 rectangle will be pointed directly at the sun and receive full sunlight. But this is challenging as the sun arcs across the sky, tracing a different path every day of the year, and varying with latitude, as shown on page 2.

Solar trackers orient solar modules towards the sun. The market size, key parameters of different systems, and “how solar trackers work” are succinctly explained on pages 3-4.

The energy uplifts from solar trackers have been estimated at 10-50% in different studies. But we can do better than this broad range, and actually calculate both the energy uplift and the revenue uplift from first principles, on pages 5-8.

The economics of solar trackers can therefore be modeled more effectively. Our base case yields 13% IRRs and deflates solar LCOEs by 0.4 c/kWh. We can also model how steepening duck curves, battery co-deployments, and AI optimizations will further improve the case for solar trackers, on pages 9-10.

The solar tracker industry is worth $10bn pa, relatively concentrated, and relatively unusual for a solar supply chain in that it is still dominated by US companies. We discuss key conclusions from our screen of solar tracker companies on pages 11-13.

A key mega-theme that has permeated our 2024 research has been the rise of AI, and the benefits of greater digitization and optimization. It is interesting to end by noting that solar trackers, once again, fit this trend, and amplify demand for sensor equipment.

Energy transition: the triple challenge?

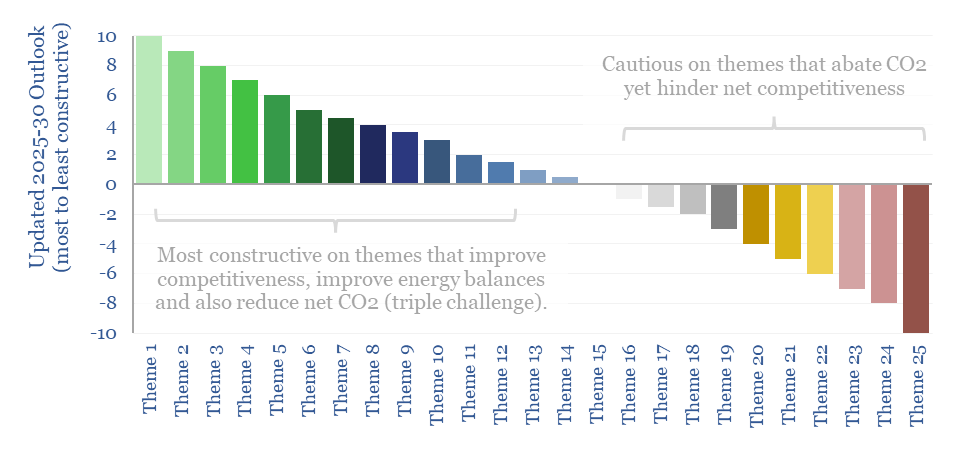
Energy transition is a triple challenge: to meet energy needs, abate CO2 and increase competitiveness. History has now shown that ignoring the part about competitiveness gets you voted out of office?! We think raising competitiveness will be the main focus of the new administration in the US. So this 15-page report discusses overlooked angles around energy competitiveness, and updates our outlook for different themes.  


A common framework is to call the energy transition a โ€œdual challengeโ€. The first task is meeting the energy needs of human civilization. And the second task is abating the worldโ€™s CO2 emissions. But we increasingly think this framework is incomplete. Energy transition is a triple challenge. The third component is raising competitiveness.

If we only solve for energy supply and CO2 reduction, then there is a danger of backing technologies that achieve both of these things at very high costs; which inflates living costs for consumers, and worsens competitiveness in countries that adopt them (pages 2-3).

The distinction between CO2 abatement and competitive CO2 abatement is illustrated by contrasting CCS and nature-based solutions, in a detailed case study on pages 4-6.

It is really worth thinking about this distinction. Our sense is that the incoming Trump administration is not anti-decarbonization per se. It is simply pro-competitiveness. Hence, we have re-visited our outlook for energy markets and energy transition themes from this lens.

How can developed world economies improve their competitiveness with emerging world economies that have lower labor costs, lower energy costs, and lower environmental costs? Our answer hinges on minimizing the difference in energy costs, then producing better products, via better technology, helped by better infrastructure (page 7).

High-quality infrastructure clearly boosts competitiveness, but can it also be considered an energy transition category? A fiber optic cable moves 1 GB of data with 15,000x less energy than physically transporting it. Bridges, canals, railways and transmission lines save MT-scale CO2. Examples and case studies are on pages 8-10.

Boosting the competitiveness of an industrial economy is helped by selecting low-cost sources of energy and de-selecting expensive ones. Hence, we revisit our electricity cost curves. Especially in the US, we grow more constructive on gas production, gas pipelines, gas turbines on pages 11-12.

Some solar and onshore wind deployments genuinely can improve the competitiveness of energy systems, when deployed in the right place, and in the right quantities. Our outlook for renewables under the new US administration is on page 13.

Incentivizing new technology is another area where we think the new US administration may introduce surprising policies. One proposal that resonates with us is a โ€œfirst mover tax creditโ€ to help companies justify investments that will de-risk new technologies that later benefit others. Technologies that excite us are re-capped on pages 14-15.

Gas turbines: what outlook in energy transition?

Gas turbine capacity added globally from 1985 to present, and projected to 2030

Gas turbines should be considered a key workhorse for a cleaner and more efficient global energy system. Installations will double to 100GW pa in 2024-30, and reach 140GW in 2030, surpassing their prior peak from 2003. This 16-page report outlines four key drivers in our gas turbine outlook, and their implications.


25% of global electricity came from burning 150bcfd of natural gas in 2023, generating 6,750 TWH of electricity from a fleet of 1.9 TW of gas turbines. The basic functioning, cost and efficiency of a typical gas turbine are described on pages 2-3.

Our goal in this report is to forecast the market for gas turbines through 2030. To predict the future, however, it is first necessary to predict the past and present, estimating the total market for gas turbines from 1985 to 2023. Our methodology and conclusions are on pages 4-6.

The first reason we think gas turbines will continue gaining share in the global power mix is that they are genuinely a better technology, in thermodynamics terms, than thermal generation via Rankine steam engines, which makes up 50% of global electricity today. This is why the CO2 intensity of a gas CCGT can be 65% below coal-fired power.

There are four key drivers that will accelerate demand in our gas turbine outlook. They are linked to the rise of AI, energy policy in China, the rise of renewables lowering utilization rates across the global generation fleet and pushing baseload facilities to run more like peakers, and rising retirement rates from early-2000s installations. These ideas are discussed on pages 9-13.

Our outlook above suggests a sharp acceleration should be underway in gas turbine orders. Interestingly, we can find evidence that this is occurring, based on the leading indicators discussed on pages 14-15.

Another attribute of the gas turbine market is its high market concentration. Leading companies in gas turbines are noted on page 16.

Metal Organic Frameworks: sorting hat?

Illustration of the structure of CALF-20's metal organic framework

Metal Organic Frameworks (MOFs) are a game-changer for industrial separation, which consumes c10% of global energy. Activity is surging. This 18-page report reviews MOFsโ€™ recent progress and future promise. As a case study, CALF-20 can deflate CCS costs by c50%, per Svanteโ€™s TSA process, hence the note contains a deep-dive on this process.


Separating mixtures into their component parts is worth $300bn, absorbing 10% of global energy, and all the more so if CCS/DAC scale up in the future. Costs, energy intensity, CO2 intensity and challenges of separation processes such as refining, chemicals, LNG, hydrogen, biogas, desalination and CCS are summarized on pages 2-5.

Separation is inherently an energy-consuming process, to overcome the Entropy of Mixing, yet today’s industrial separations use 5-30x more energy than their thermodynamic minimum, as outlined on page 6.

Metal Organic Frameworks (MOFs) could be a game-changer for improving industrial separations. But what are MOFs? Why are there 10^15 MOFs in theoretical state space? What are some examples, advantages, disadvantages and costs for MOFs? Answers are on pages 7-9?

What motivated this research note was not simply desperation, due to slower progress and higher costs for many of the post-combustion CCS technologies we have been tracking. We have recently seen some fascinating technical papers, focusing in upon CALF-20, independently replicating claims made by Svante, and helping us to de-risk the idea that MOFs could gain traction for future CCS/DAC, as reviewed on pages 10-12.

What costs for MOFs in CCS? We can de-risk 50% lower CCS costs using MOFs rather than amines, when we take the numbers back to first principles, including the Langmuir Isotherms, MOF material costs, MOF capture rates (in tons of CO2 per year per kg of MOF) per pages 13-14.

Our company screen captures the building momentum behind leading companies in MOFs. Most of these companies are still at venture stage, and some are now reaching growth stage. For public market investors, the momentum of these companies may determine the market for other CCS-related technologies. Key companies and their recent progress are profiled on pages 15-18.

Commodity intensity of global GDP in 30 key charts?

Intensities of oil and other materials for the global GDP have fallen over time, but electricity intensity has increased.

The commodity intensity of global GDP has fallen at -1.2% over the past half-century, as incremental GDP is more services-oriented. So is this effect adequately reflected in our commodity outlooks? This 4-page report plots past, present and forecasted GDP intensity factors, for 30 commodities, from 1973->2050. The -1.5% pa decline in the oil intensity of global GDP is anomalous and could even slow from here. While surprisingly many other commodities show demand increasing in line with, or above GDP growth.


Each $M of global GDP is associated with 80 tons of coal use, 350 bbls of oil, 1,360 mcf of gas, 285 MWH of electricity, 19 tons of steel, 19 tons of wood, 5 tons of plastics, 1.8 tons of ammonia, 1 ton of hydrogen, 0.7 tons of aluminium, 0.3 tons of copper. These inputs are crucial to the global economy, which in turn drives demand for these inputs.

However, a well-known economic effect is that the commodity intensity of GDP declines as GDP rises, or in other words, incremental units of global GDP tend to be more service-oriented and less energy/materials/manufacturing-oriented. This effect is quantified for different commodities on page 2, showing the commodity intensity of GDP from 1950 to 2023, plus our forecasts through 2050.

Oil intensity of global GDP is particularly interesting, showing one of the larger historical declines among different commodity categories in our database. And for good reason. Oil is expensive relative to other energy commodities. And three categories of global oil demand, have been particularly easy to substitute. Hence fifteen different oil product sensitivities to GDP are plotted on page 3.

Each incremental $1k increase in GDP per capita has tended to unlock 0.75 MWH pp pa of primary global energy demand based on regressions back to 1965. This can be explained by incremental global GDP shifting towards services over time. This is charted on page 4.

Overall, the report sense-checks our long-term commodity forecasts, draws out key conclusion into the commodity intensity of GDP, and finds that the historical trend differs sharply by commodity. For surprisingly many commodities, the relationship with GDP is a 1:1 beta, or evan a >1:1 beta, as highlighted on the conclusions page.


Copyright: Thunder Said Energy, 2019-2024.