Wind
-
Wind power: decline rates?
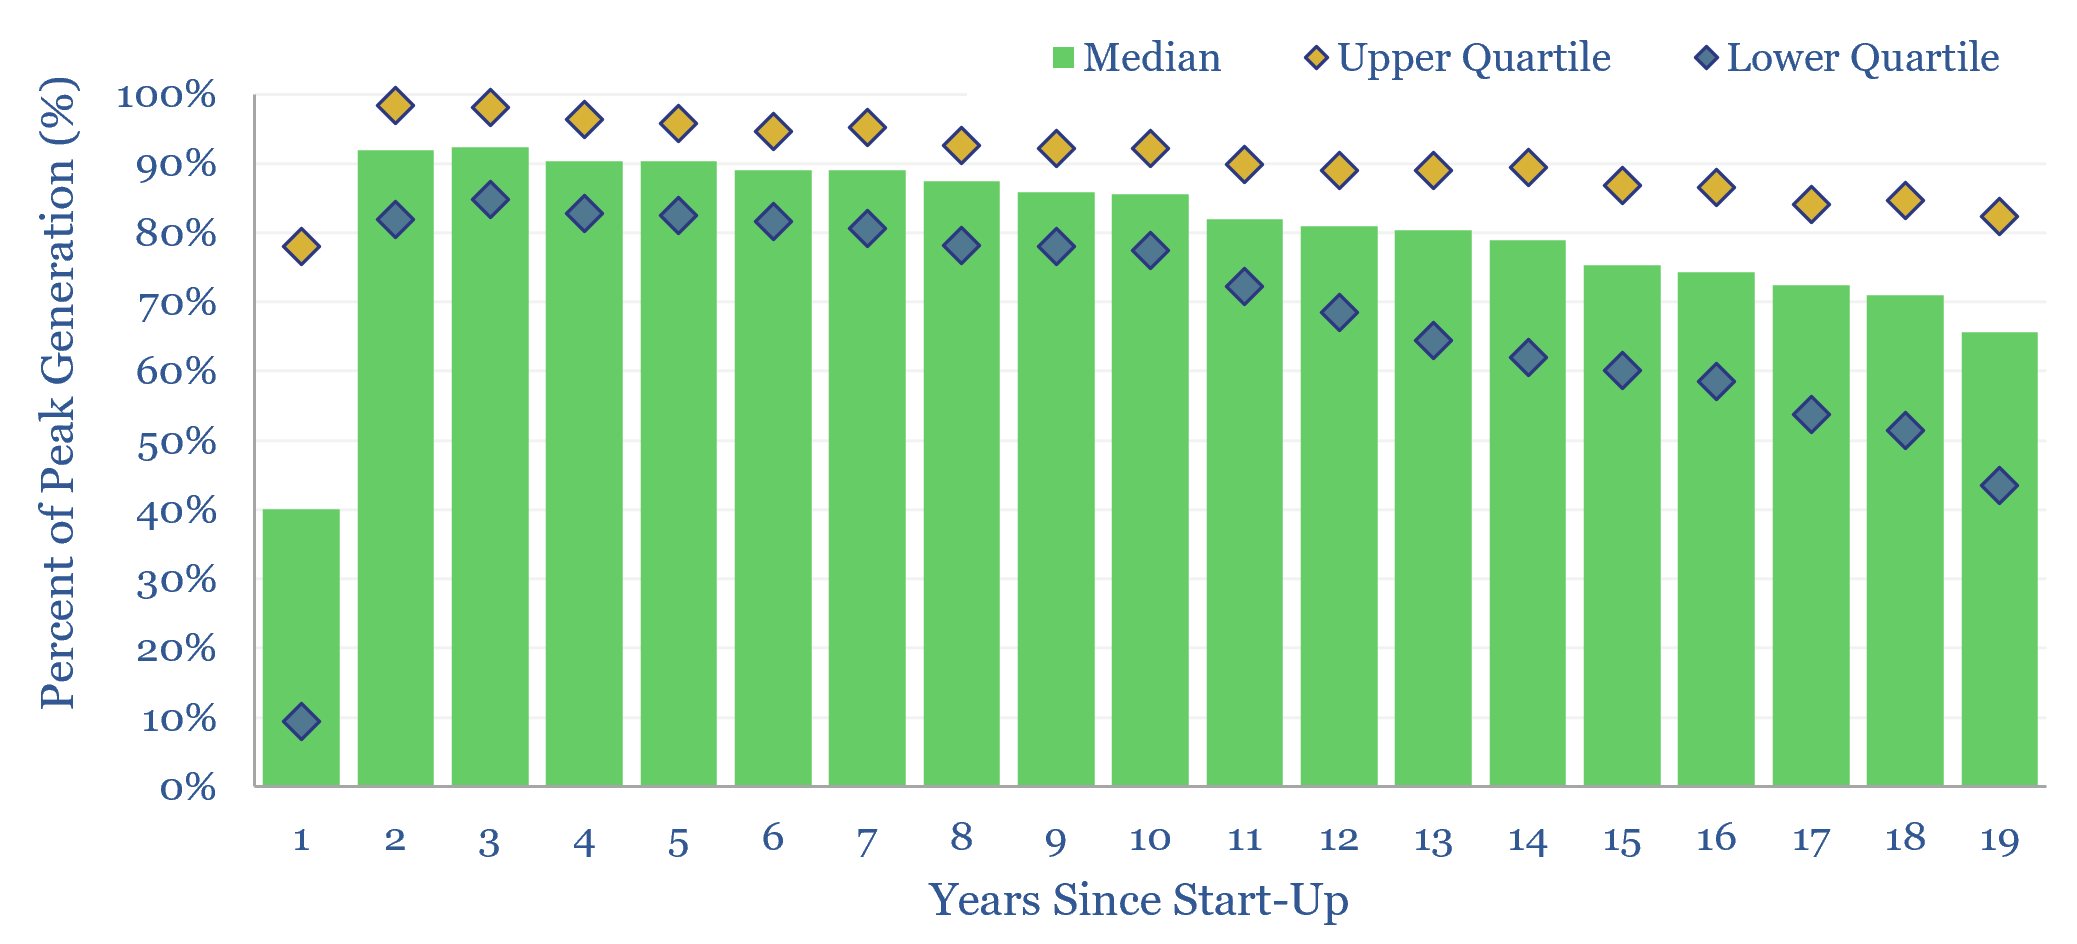
This data-file aggregates wind generation by facility, across the US, at 1,500 wind farms, going back 25-years. Wind power decline rates average 1.1% per year, then accelerate to 2% per year in years 10-20. However wind generation is also noisy, typically varying +/- 7% YoY. This matters for the economics and ultimate share of wind.
-
Wind turbine manufacturers: market share over time?
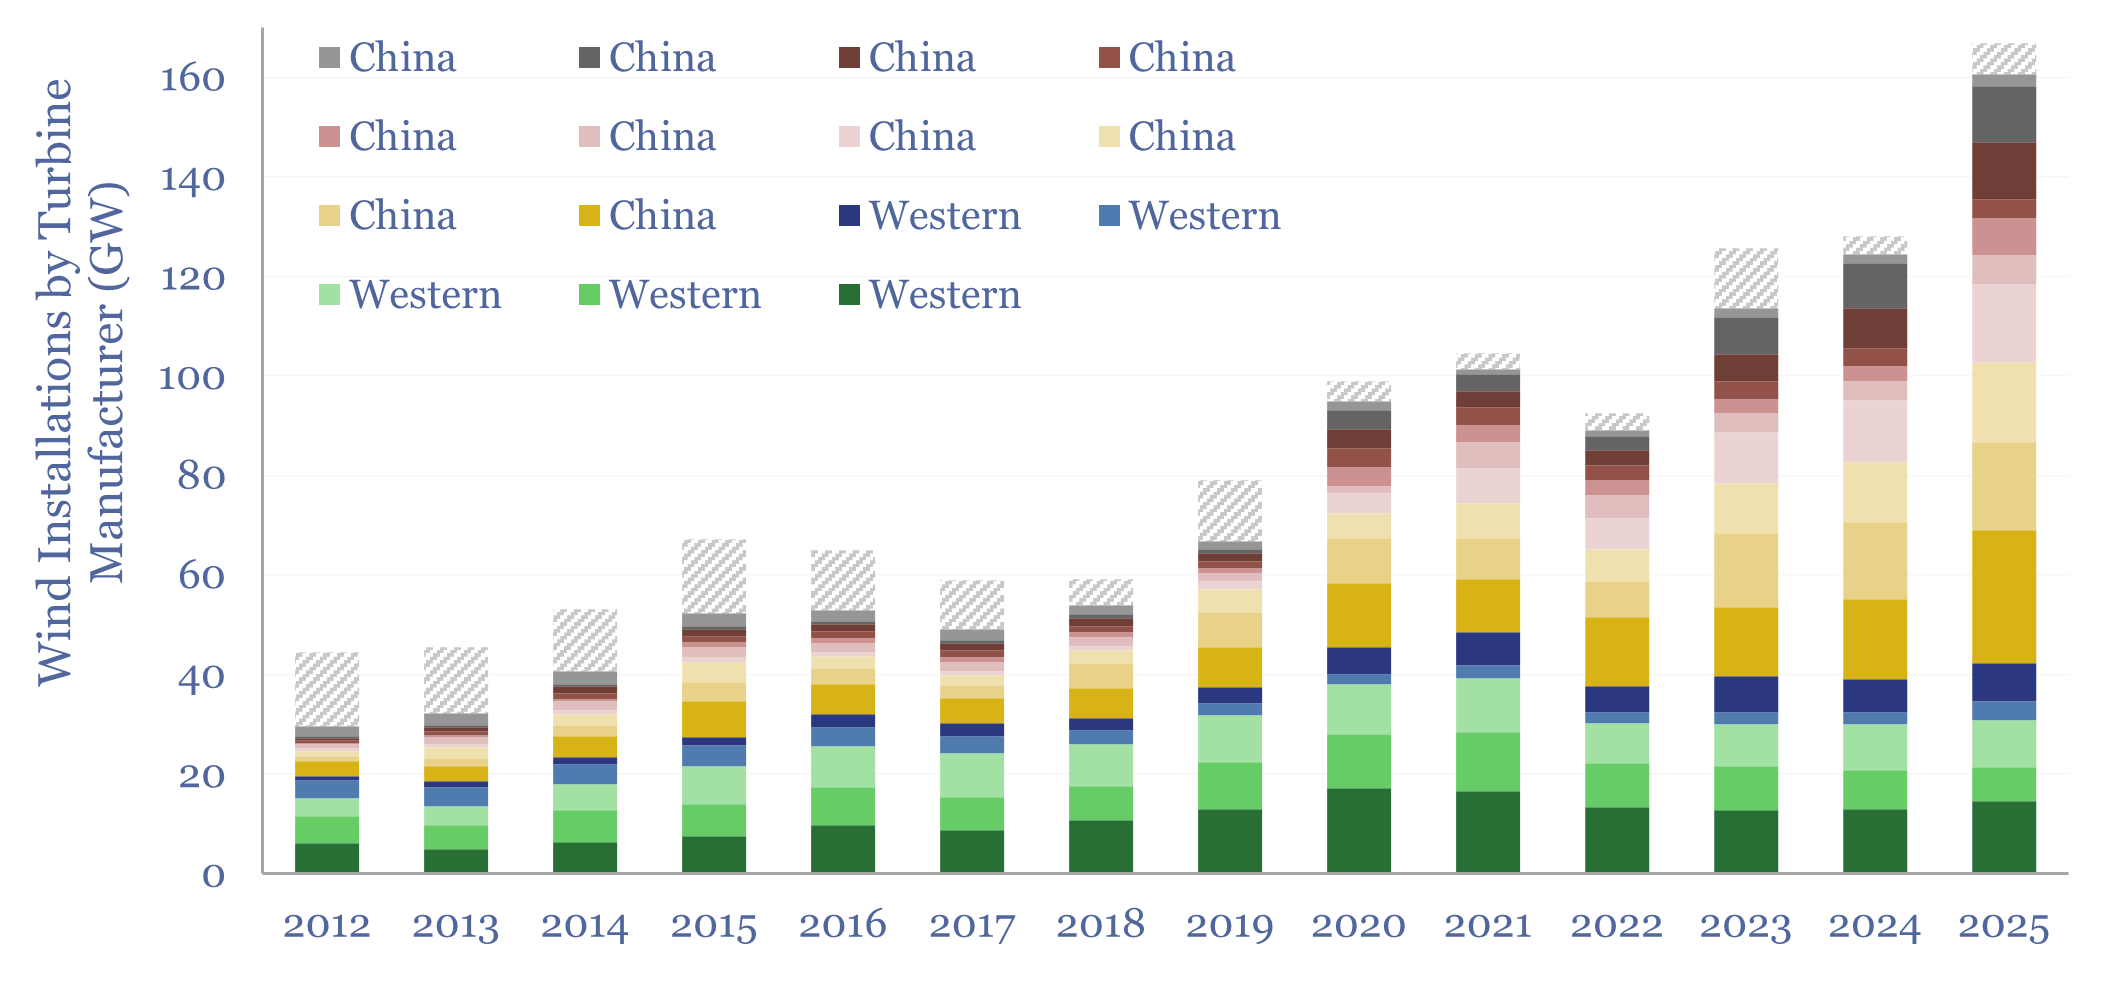
This data-file tracks wind turbine manufacturers, their market shares and their margins over time. By 2025, fifteen companies account for 95% of global wind turbine installations. This includes large Western incumbents, and a growing share for Chinese entrants, which now comprise 70% of the total market, with phenomenal growth in 2025 and continued low selling…
-
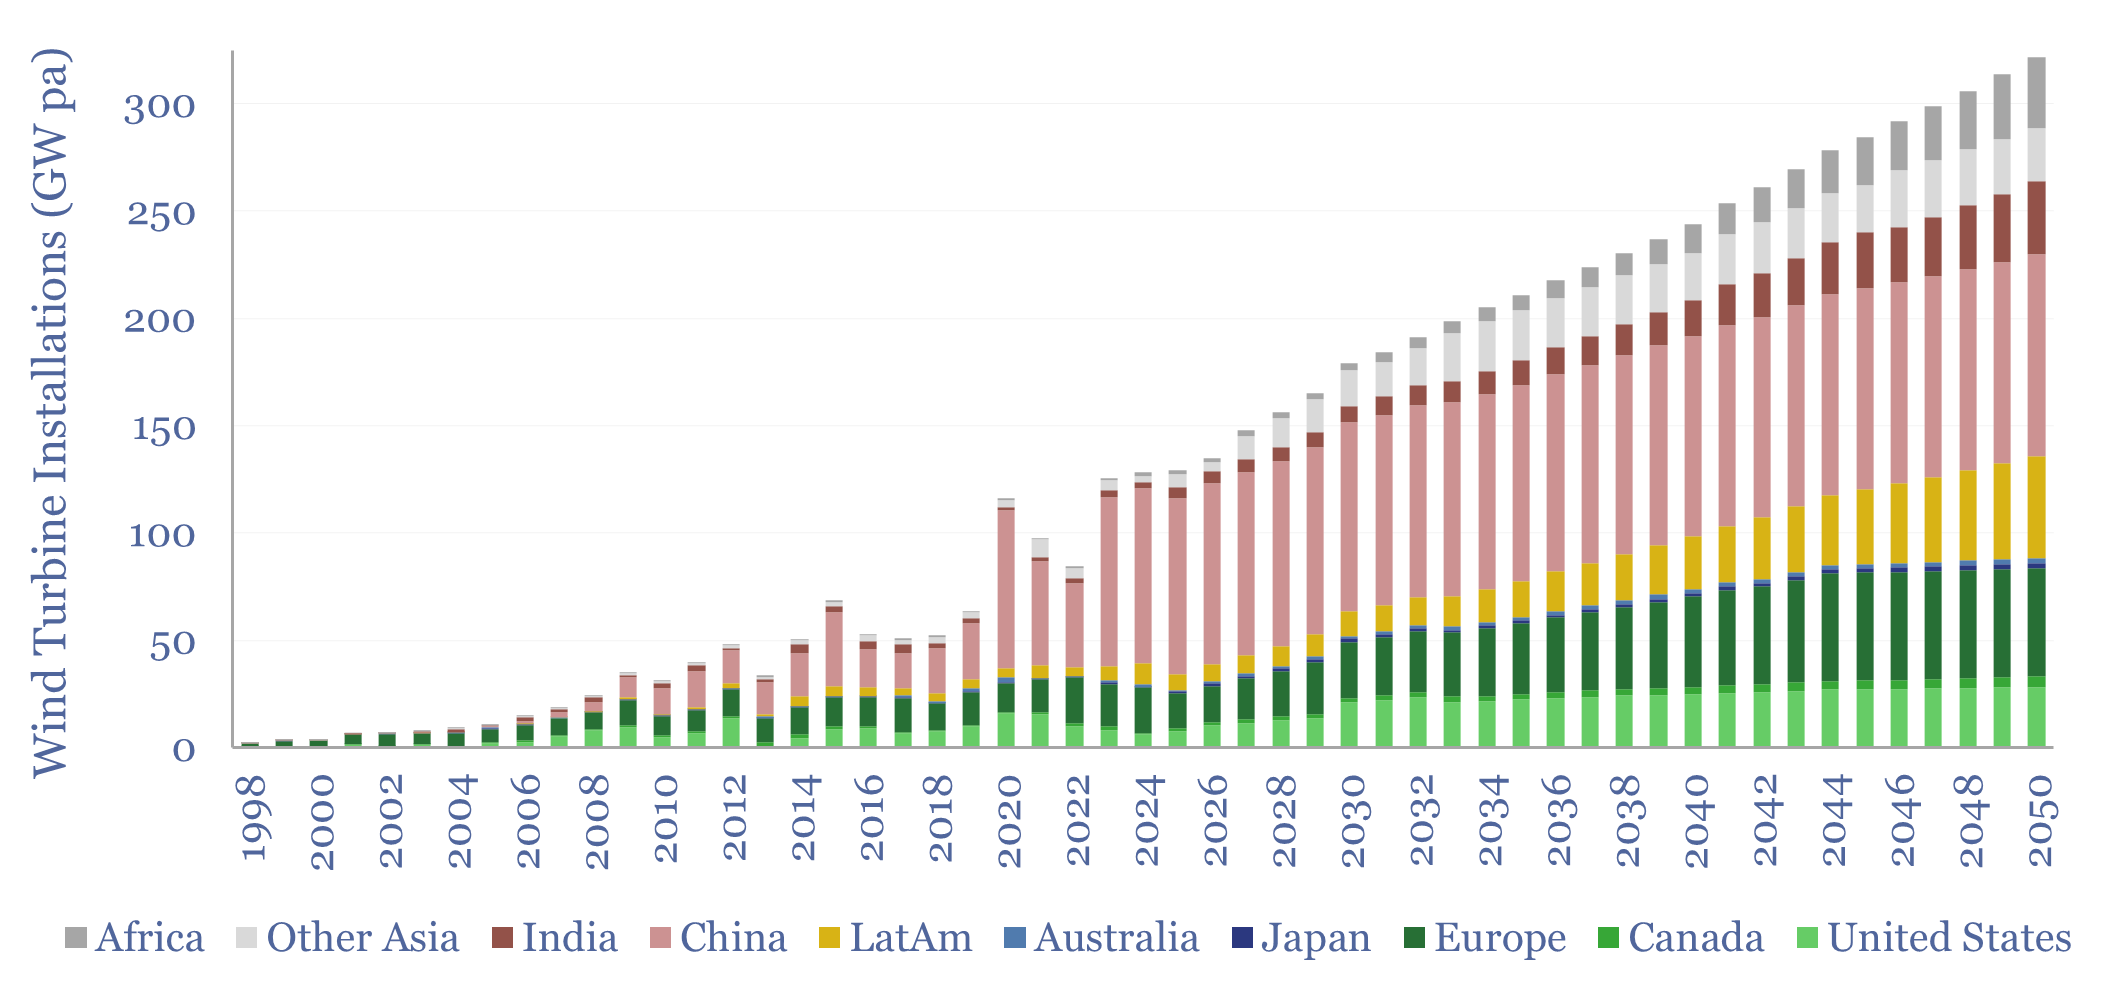
Wind and solar capacity additions?

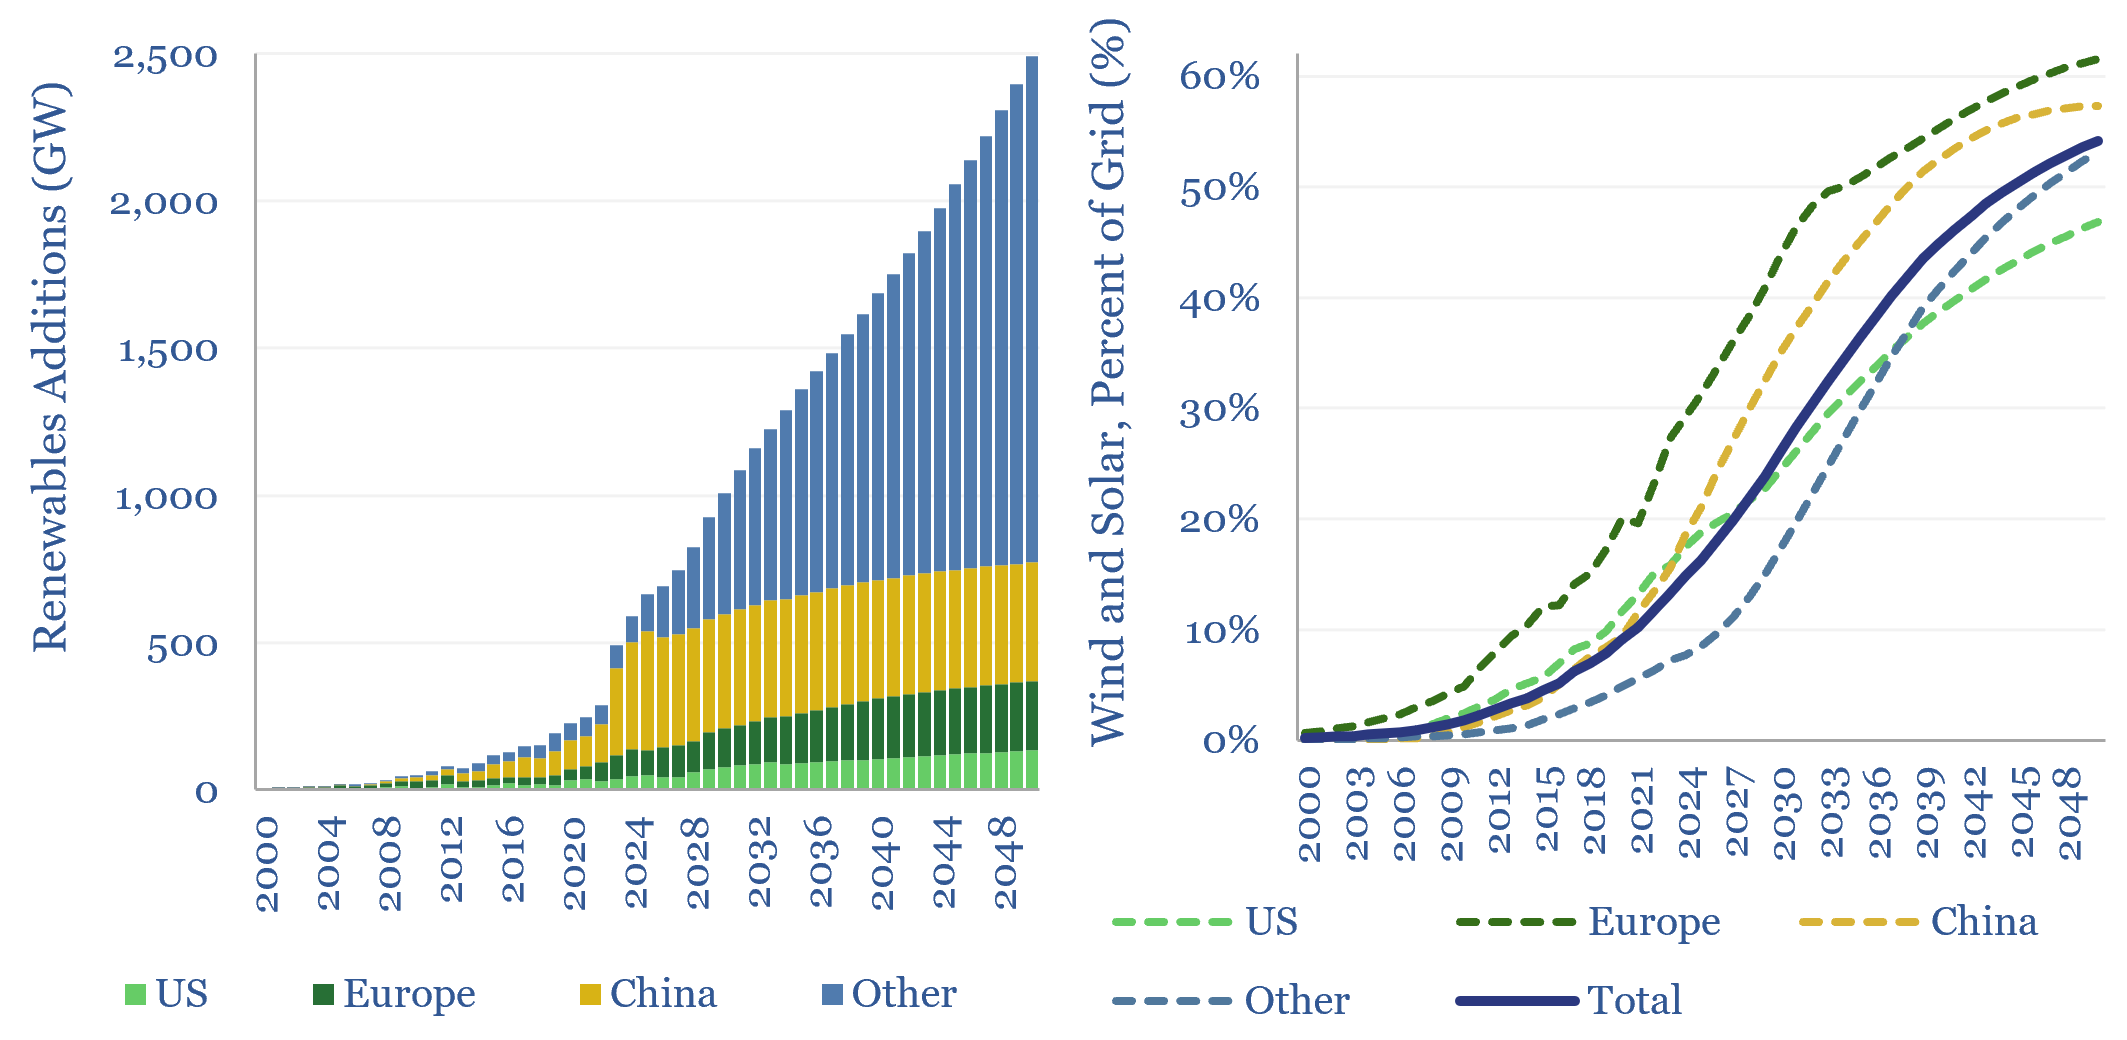
Global wind and solar capacity additions reached 630GW pa (AC-basis) in 2025, which is 3x 2020 levels and 10x 2011 levels. The pace of gross wind and solar capacity additions can rise by a further 3x by 2050, bringing wind and solar to 55% of a greatly expanded global power grid by 2050. Most of…
-
Wind and solar: total resource estimates?

This 16-page report estimates the total global resource potential from solar and wind. Solar resources are 20-100x larger than for wind. And more economical. Wind turbine wake losses are a growing controversy. Hence, will future renewables growth shift more towards solar?
-
Wind turbines: wake losses?

Wind turbine wake losses would deprive a downstream wind turbine of 70% of its generation capacity at 350m immediately downwind of a modern wind turbine, 50% at 700m, 40% at 1km, 20% at 2km and 10% at 4km. This is based on the Jensen model and case studies tabulated in this data-file. More recently, some…
-
Renewable-heavy grids: total system costs?
Renewables can have similar LCOEs as conventional generation sources. Yet ramping renewables to c50% of a developed world power grid inflates total system costs by at least 50%. This is because renewables require back-ups, additional T&D and power electronics. This 16-page report aims to quantify the total system costs of renewable-heavy grids, and their implications.
-
New energies deflation: myths and legends?
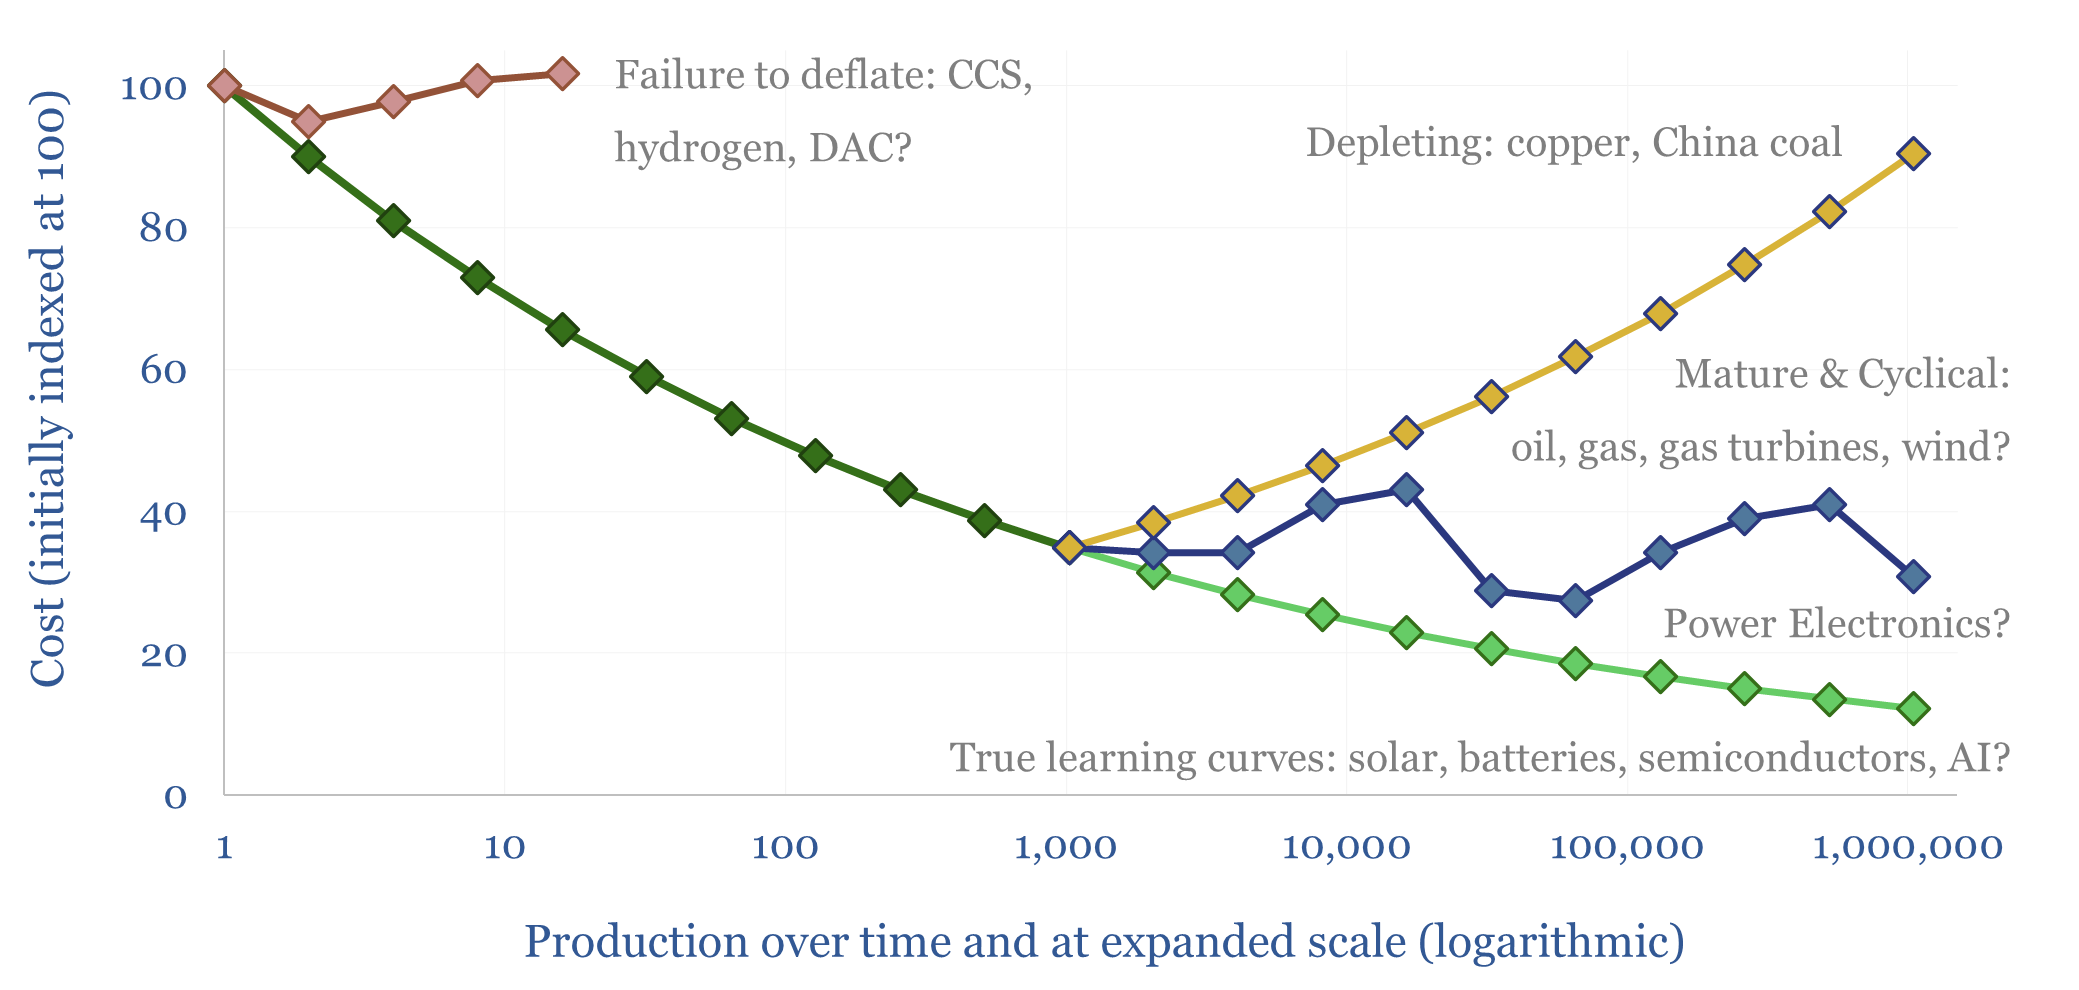
How much of the market’s current disenchantment with new energies can be attributed to persistently high costs, which failed to deflate as much as hoped? This 15-page report reviews the evidence. Cost trajectories have varied. CCS and hydrogen cost more than initially advertised. Wind costs recently re-inflated. Yet, solar, electronics and lithium ion batteries remain…
-
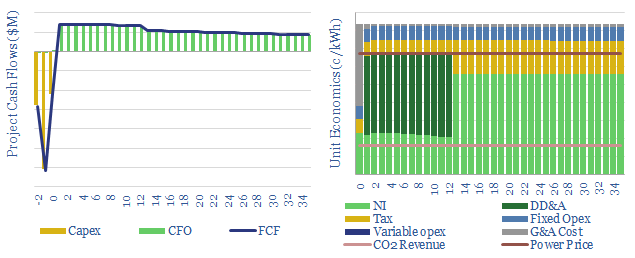
Onshore wind: the economics?

The levelized cost of onshore wind is estimated in this economic model, at 5-7c/kWh to generate 5-10% levered IRRs on new wind projects costing $1,000-3,000/kW. The model also contains a granular breakdown of wind capex costs, operating costs, and other economic assumptions for wind projects.
-
Wind energy: beyond good and evil?

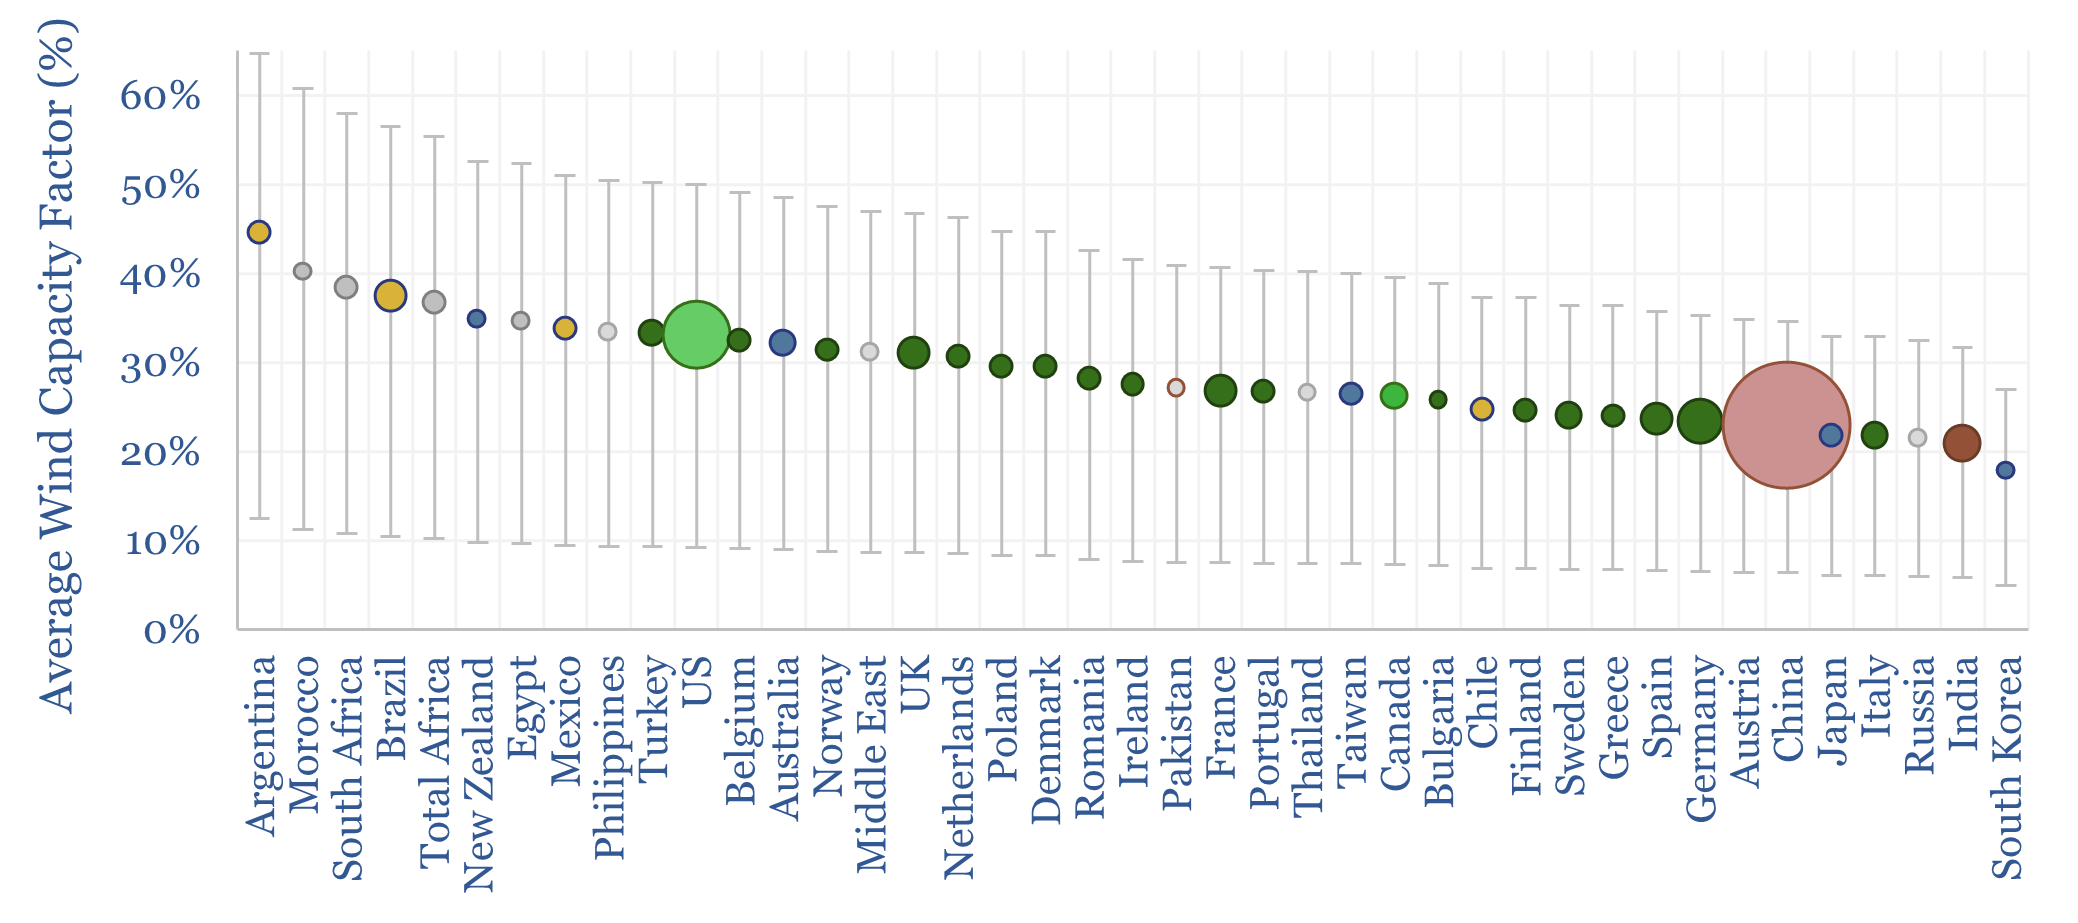
Wind economics are not good or bad in absolute terms. They depend on capacity factors, which average 26% globally, but can range from 10% to 60%. In the best locations, levelized costs are below 4c/kWh. Hence this 16-page note explores global wind capacity factors and updates our wind outlook by region throgh 2050.
-
Wind turbine capacity factors: by country, by facility?

Wind turbine capacity factors average 26% globally. But they vary from c20% in non-windy countries to 45% in the windiest countries. And they also vary within countries, with a normal distribution and a standard deviation of 7-12%. This data-file maps capacity factors of wind power generation.


Content by Category
- Batteries (96)
- Biofuels (44)
- Carbon Intensity (48)
- CCS (64)
- CO2 Removals (9)
- Coal (44)
- Commentary (65)
- Company Diligence (105)
- Data Models (928)
- Decarbonization (163)
- Demand (131)
- Digital (92)
- Downstream (47)
- Economic Model (222)
- Energy Efficiency (76)
- Hydrogen (63)
- Industry Data (311)
- LNG (56)
- Materials (86)
- Metals (89)
- Midstream (45)
- Natural Gas (163)
- Nature (76)
- Nuclear (28)
- Oil (178)
- Patents (39)
- Plastics (44)
- Power Grids (156)
- Renewables (153)
- Screen (139)
- Semiconductors (36)
- Shale (58)
- Solar (72)
- Supply-Demand (53)
- Vehicles (94)
- Video (24)
- Wind (46)
- Written Research (410)