LNG
-
LNG: top conclusions in the energy transition?
Thunder Said Energy is a research firm focused on economic opportunities that drive the energy transition. Our top ten conclusions into LNG are summarized below, looking across all of our research.
-
Global gas supply-demand in energy transition?

Global gas supply-demand is predicted to rise from 400bcfd in 2023 to 650bcfd by 2050, in our outlook, as a complement to wind, solar, nuclear, and as global coal resources mature from the 2030s onwards. This data-file quantifies global gas demand and supply by country, across heating, power and industry.
-
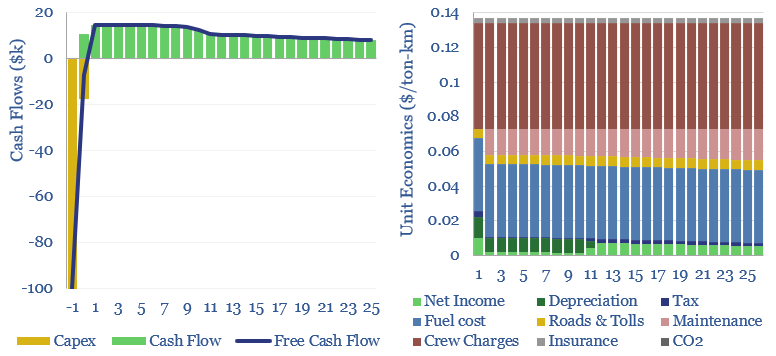
Heavy truck costs: diesel, gas, electric or hydrogen?

Heavy truck costs are estimated at $0.14 per ton-kilometer, for a truck typically carrying 15 tons of load and traversing over 150,000 miles per annum. Today these trucks consume 10Mbpd of diesel and their costs absorb 4% of post-tax incomes. Hydrogen trucks would be 45-75% more costly, but from 2026, we are starting to see…
-
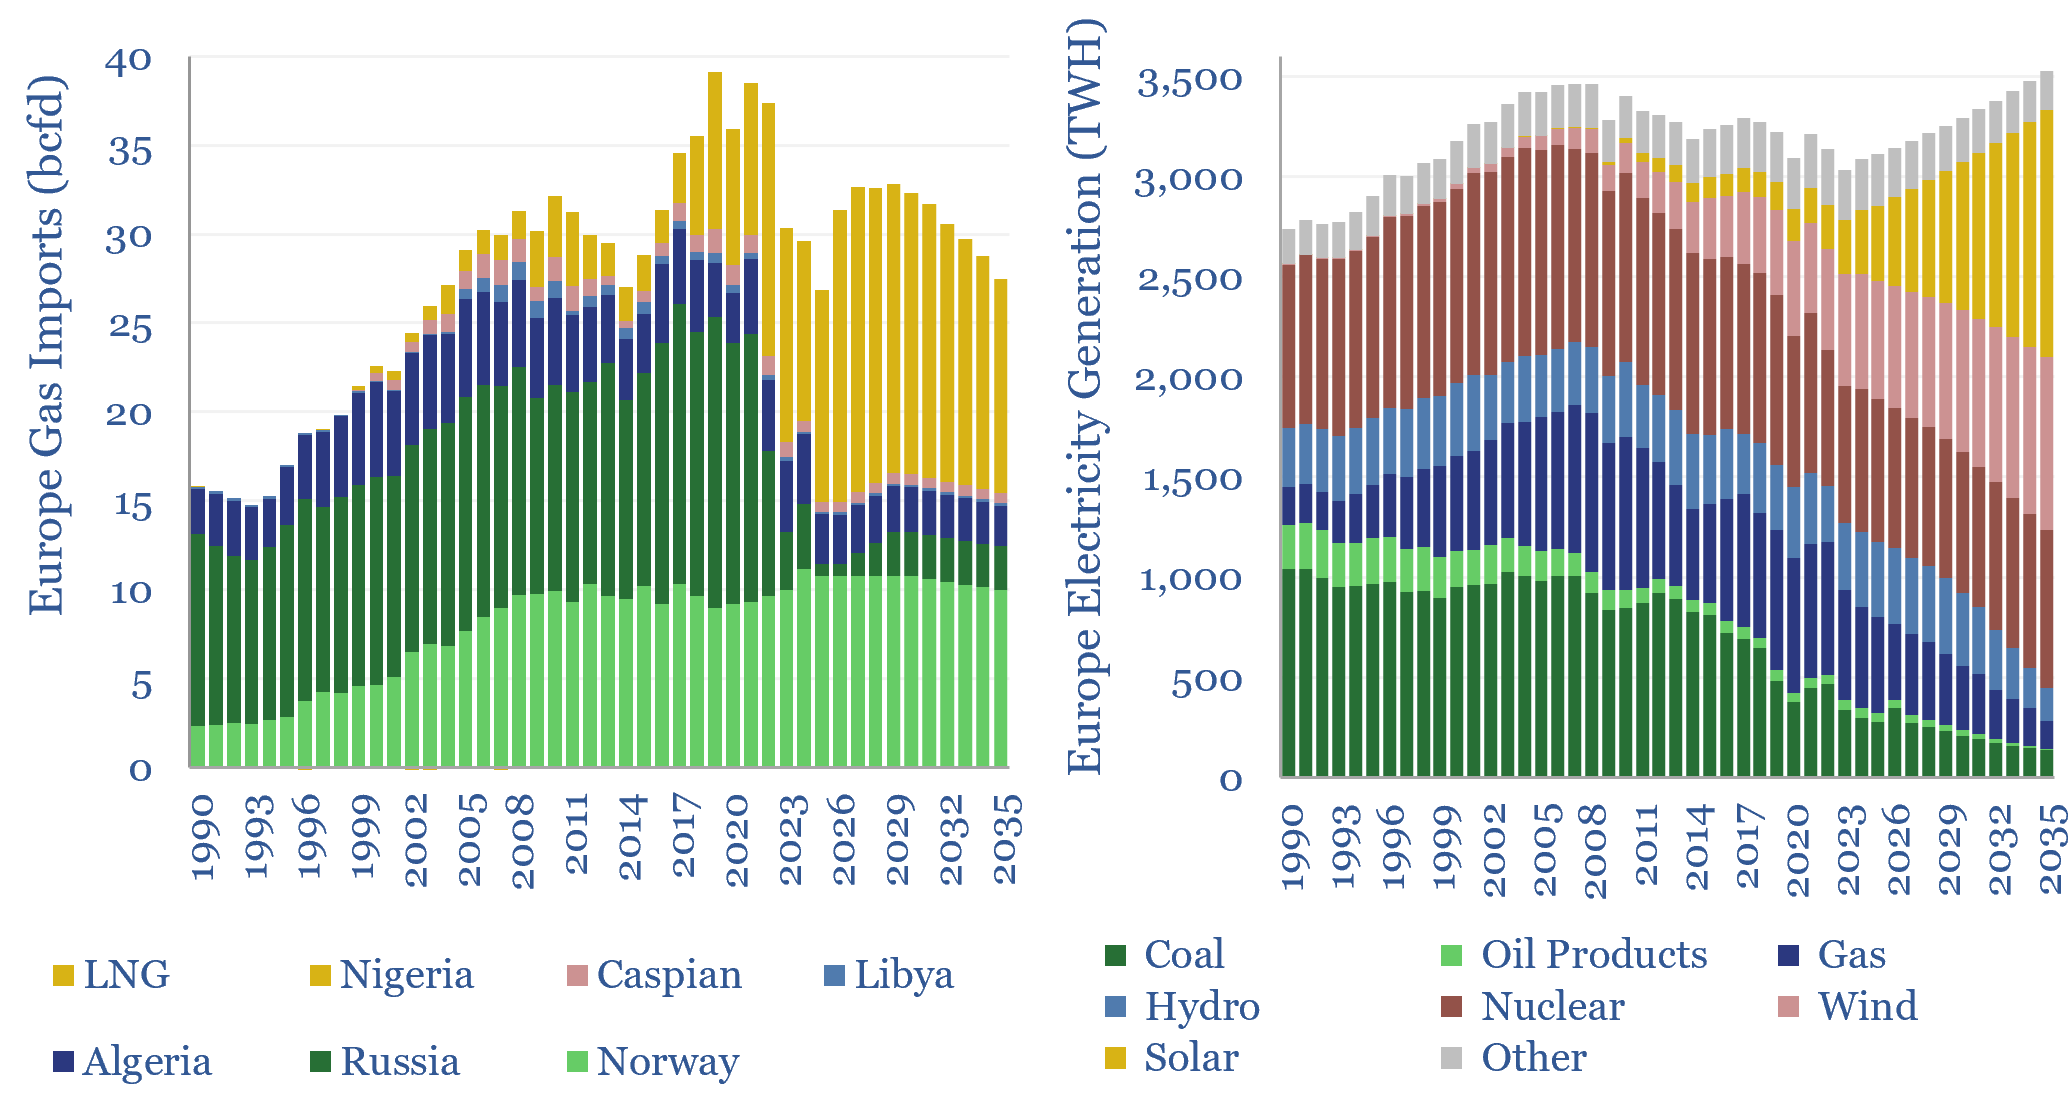
European gas and power model: natural gas supply-demand?

This data-file is our European gas supply-demand model. Balances are assessed in European gas and power markets from 1990 to 2035, reflecting all of our research into Europe’s energy transition. 2024-25 gas markets were supported by inventory draw-downs, but LNG imports step up from 110MTpa to 120MTpa through 2030, before softening again through 2035.
-
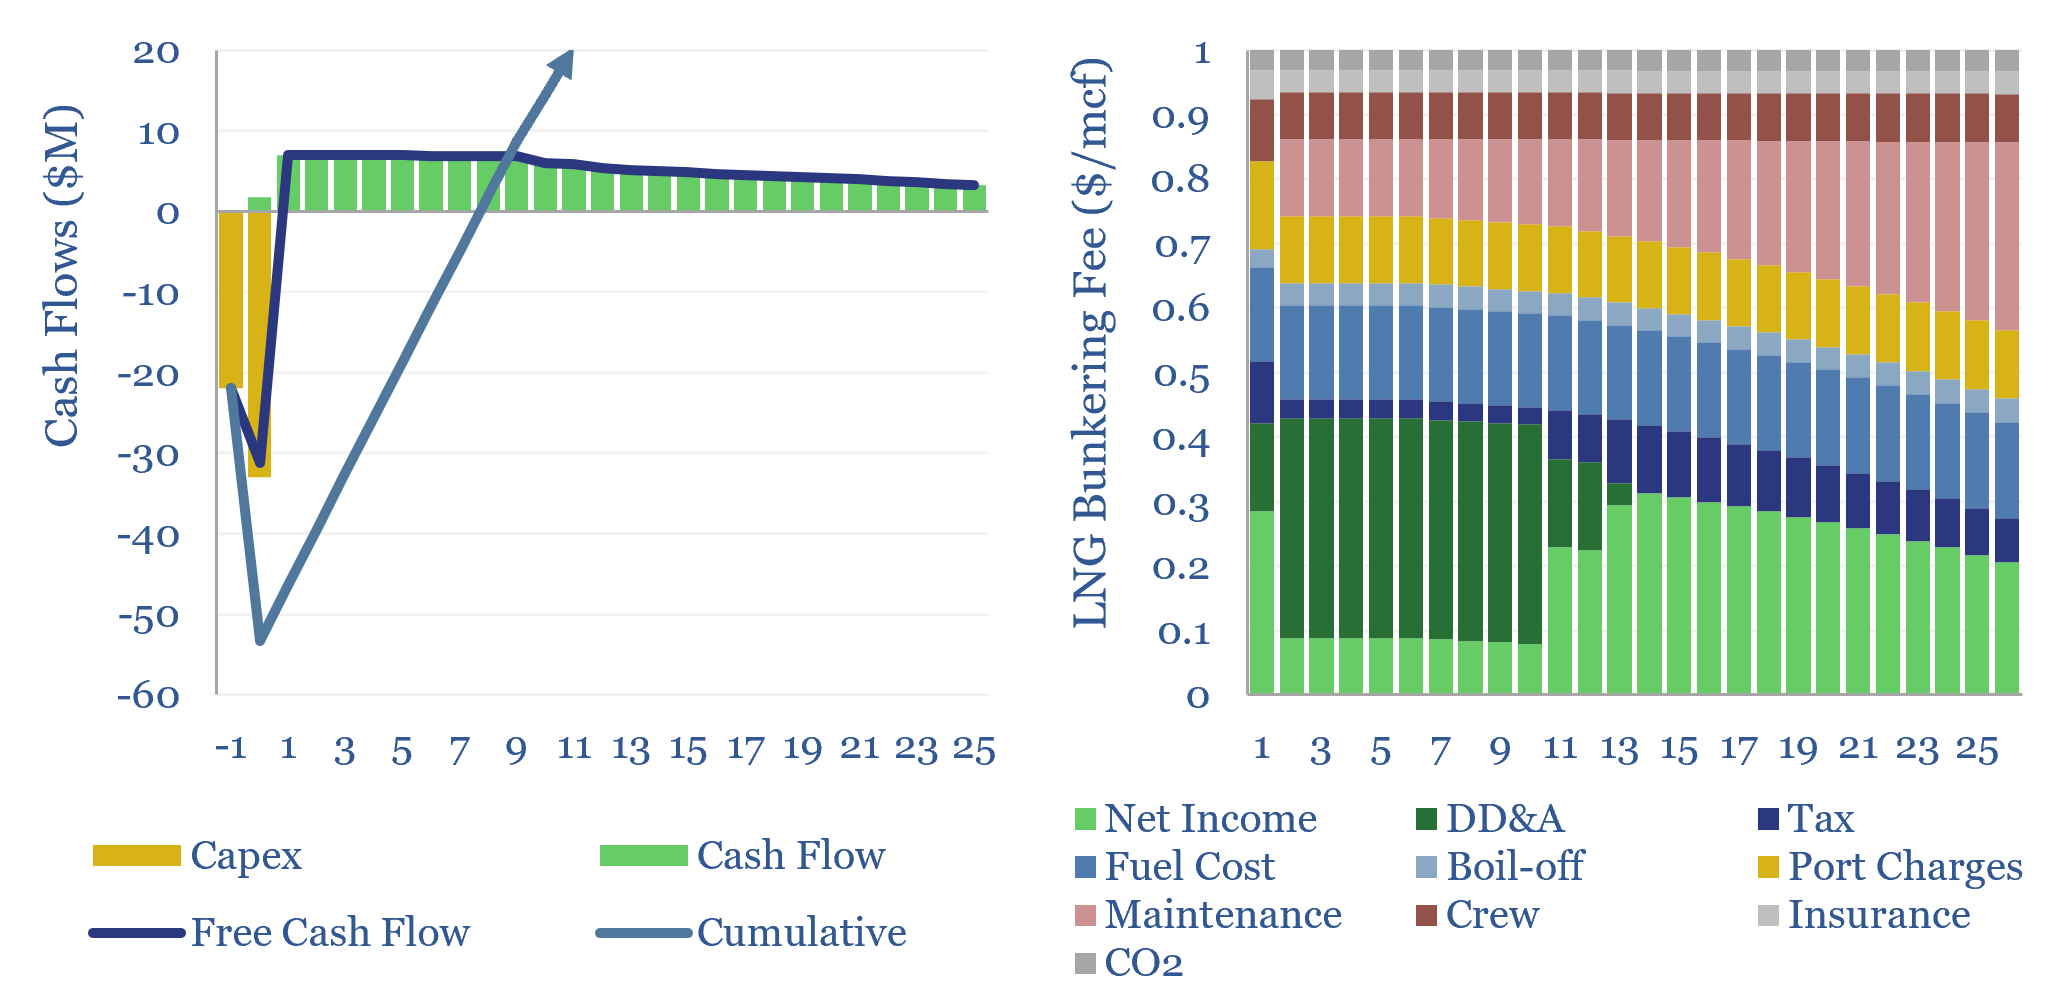
LNG bunkering vessel economics?

This data-file captures the economics of LNG bunkering vessels. LNG bunkering costs $1/mcf in well-utilized contexts, enabling LNG ship fueling at $8-10/mcf, which is 35% below $2/gal oil products at $70/bbl oil. A 1.5-year payback on dual-fuel vessels could thus see another 10MTpa of LNG used in shipping by 2030, displacing 250kbpd of oil?
-
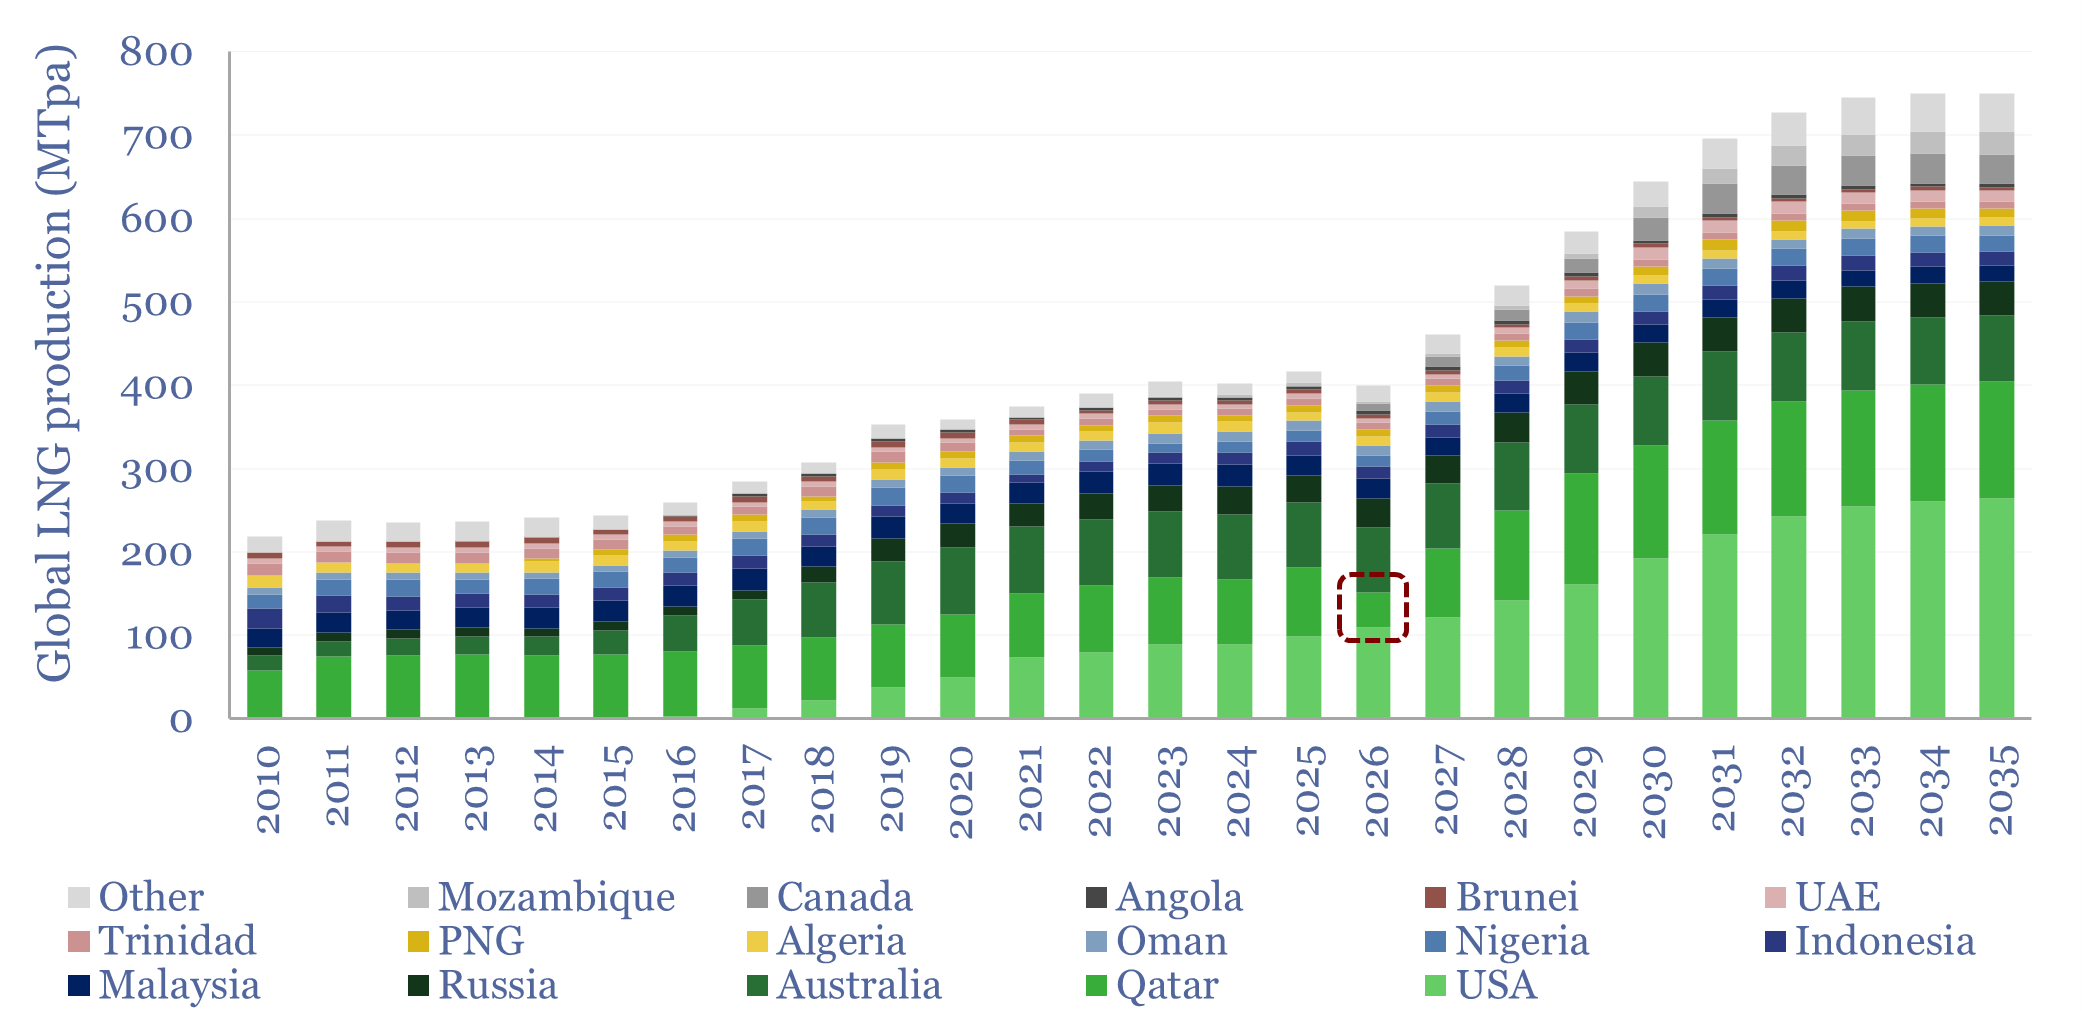
Qatari LNG: the worst supply disruption in LNG history?

What if Qatar’s LNG output falls by -50% YoY in 2026, i.e., by -40MTpa, which is equivalent to a -0.4% reduction in useful global energy supplies? This 11-page report revisits all of our regional energy models, predicts how each Qatari LNG customer will fill the shortfall, and the implications for global energy markets.
-
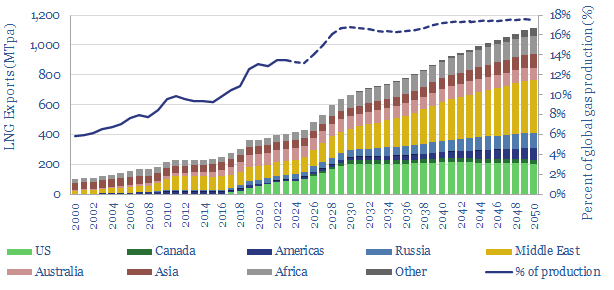
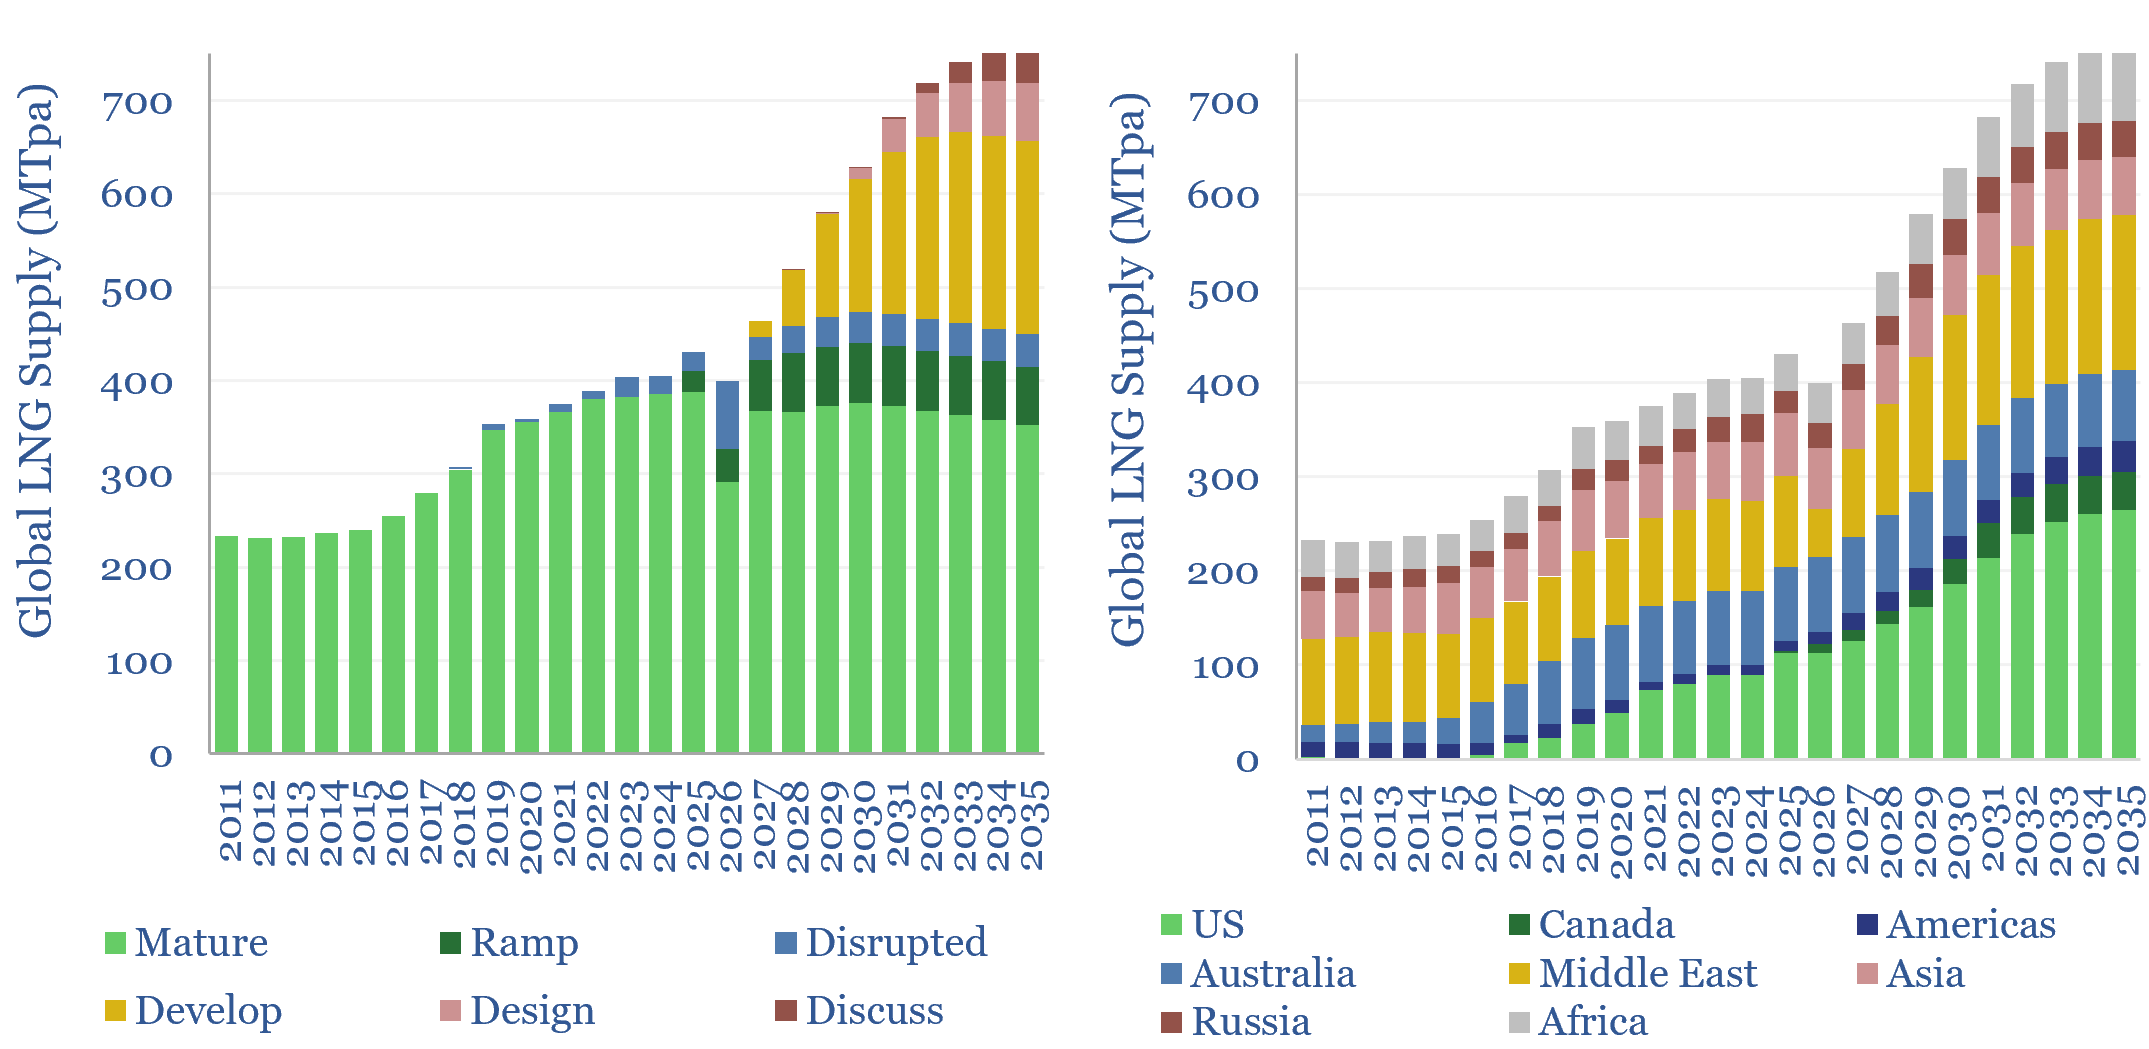
Global LNG supply model: by project and by country?

Global LNG output ran at 430MTpa in 2025. This model estimates global LNG production by facility across 200 LNG facilities and projects. Our latest forecasts are that global LNG demand will rise at a 6% CAGR, to reach 760MTpa by 2035, for an absolute growth rate of +30MTpa per year. There is a construction boom…
-
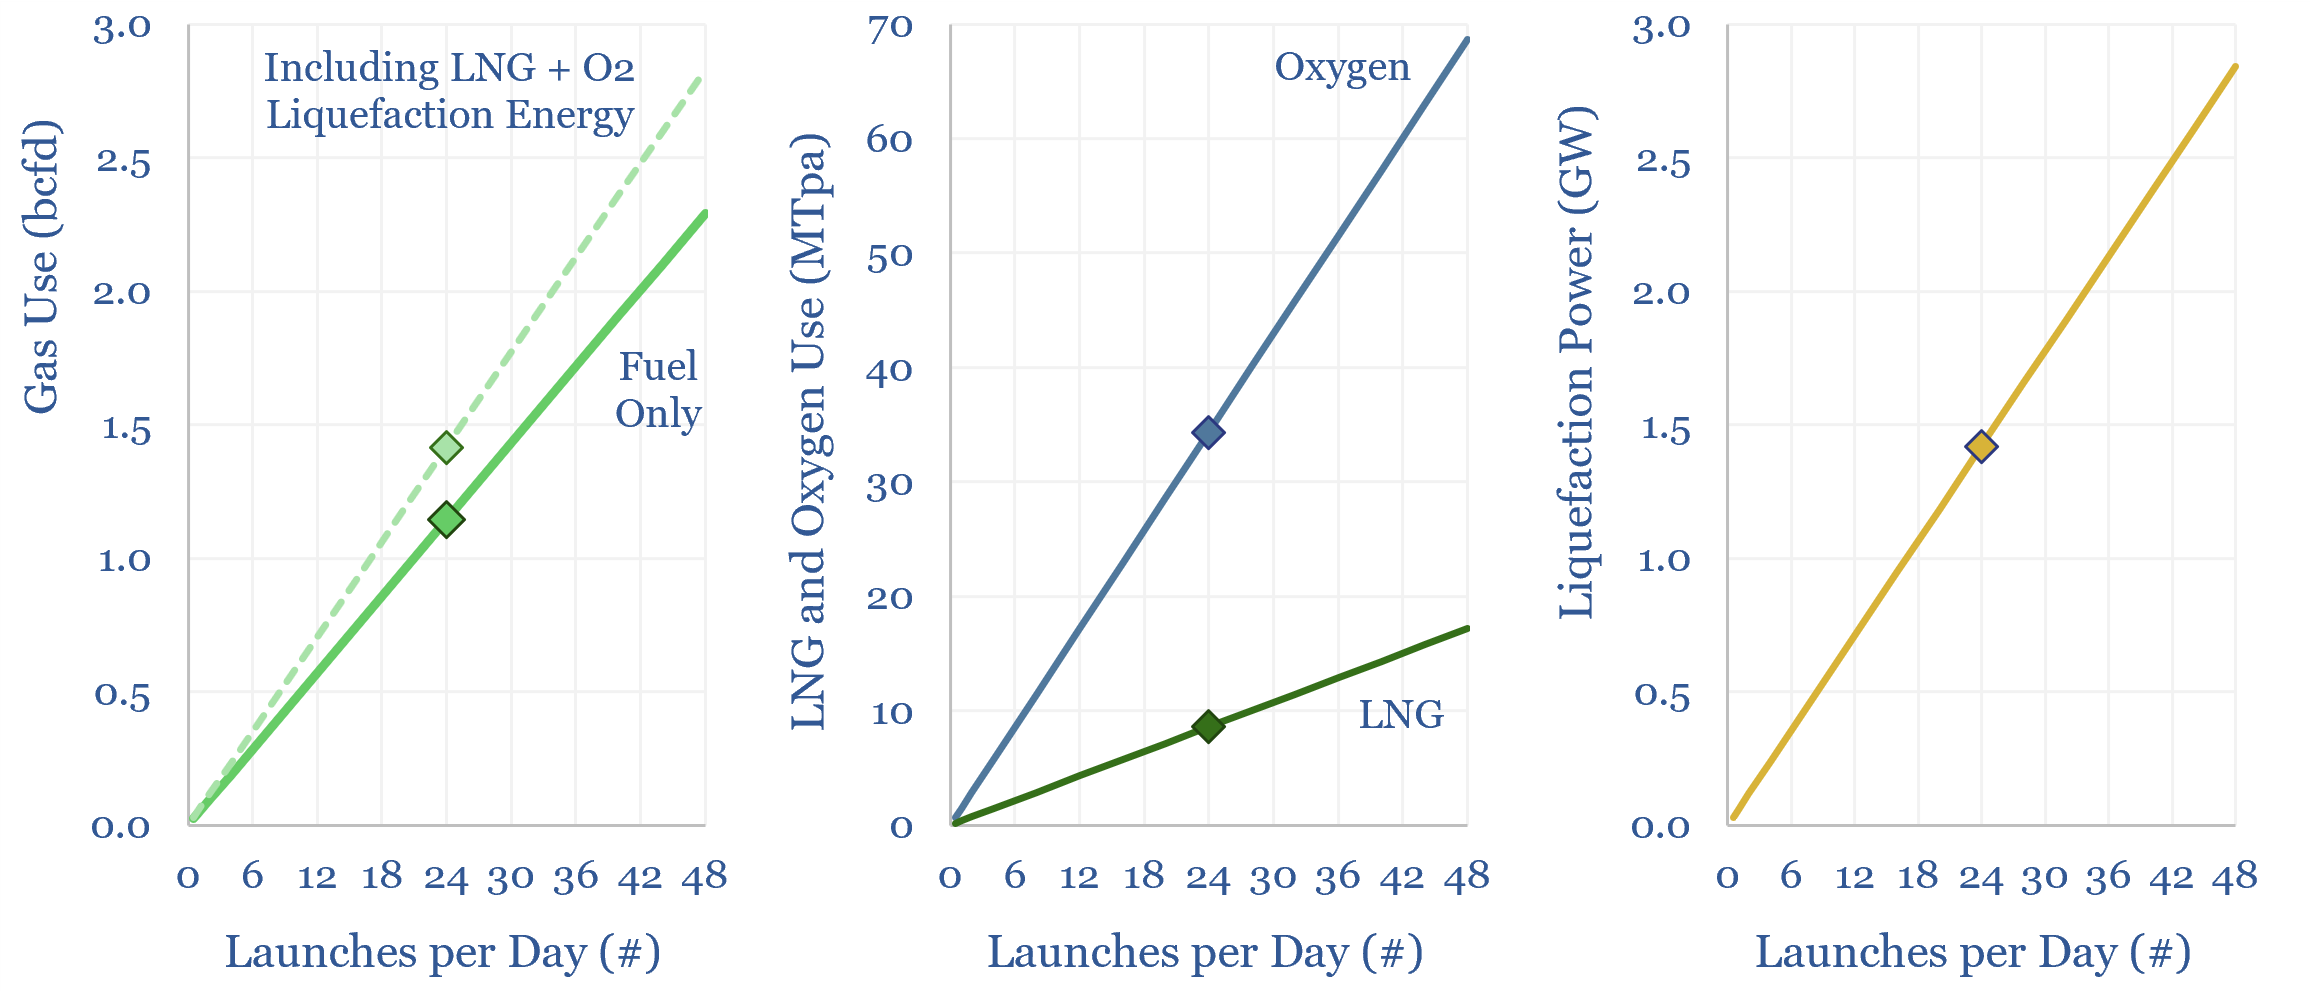
Starship space launch: energy and capital goods?

How much energy would be required to support ongoing launches of Starship spacecrafts into Low Earth Orbit? And what capital equipment would be needed to liquefy this LNG fuel and oxygen propellant? This data-file calculates hourly launches would require 1.4bcfd of gas, 9MTpa of LNG liquefaction, 34MTpa of oxygen ASUs, 1.4GW of compression power and…
-
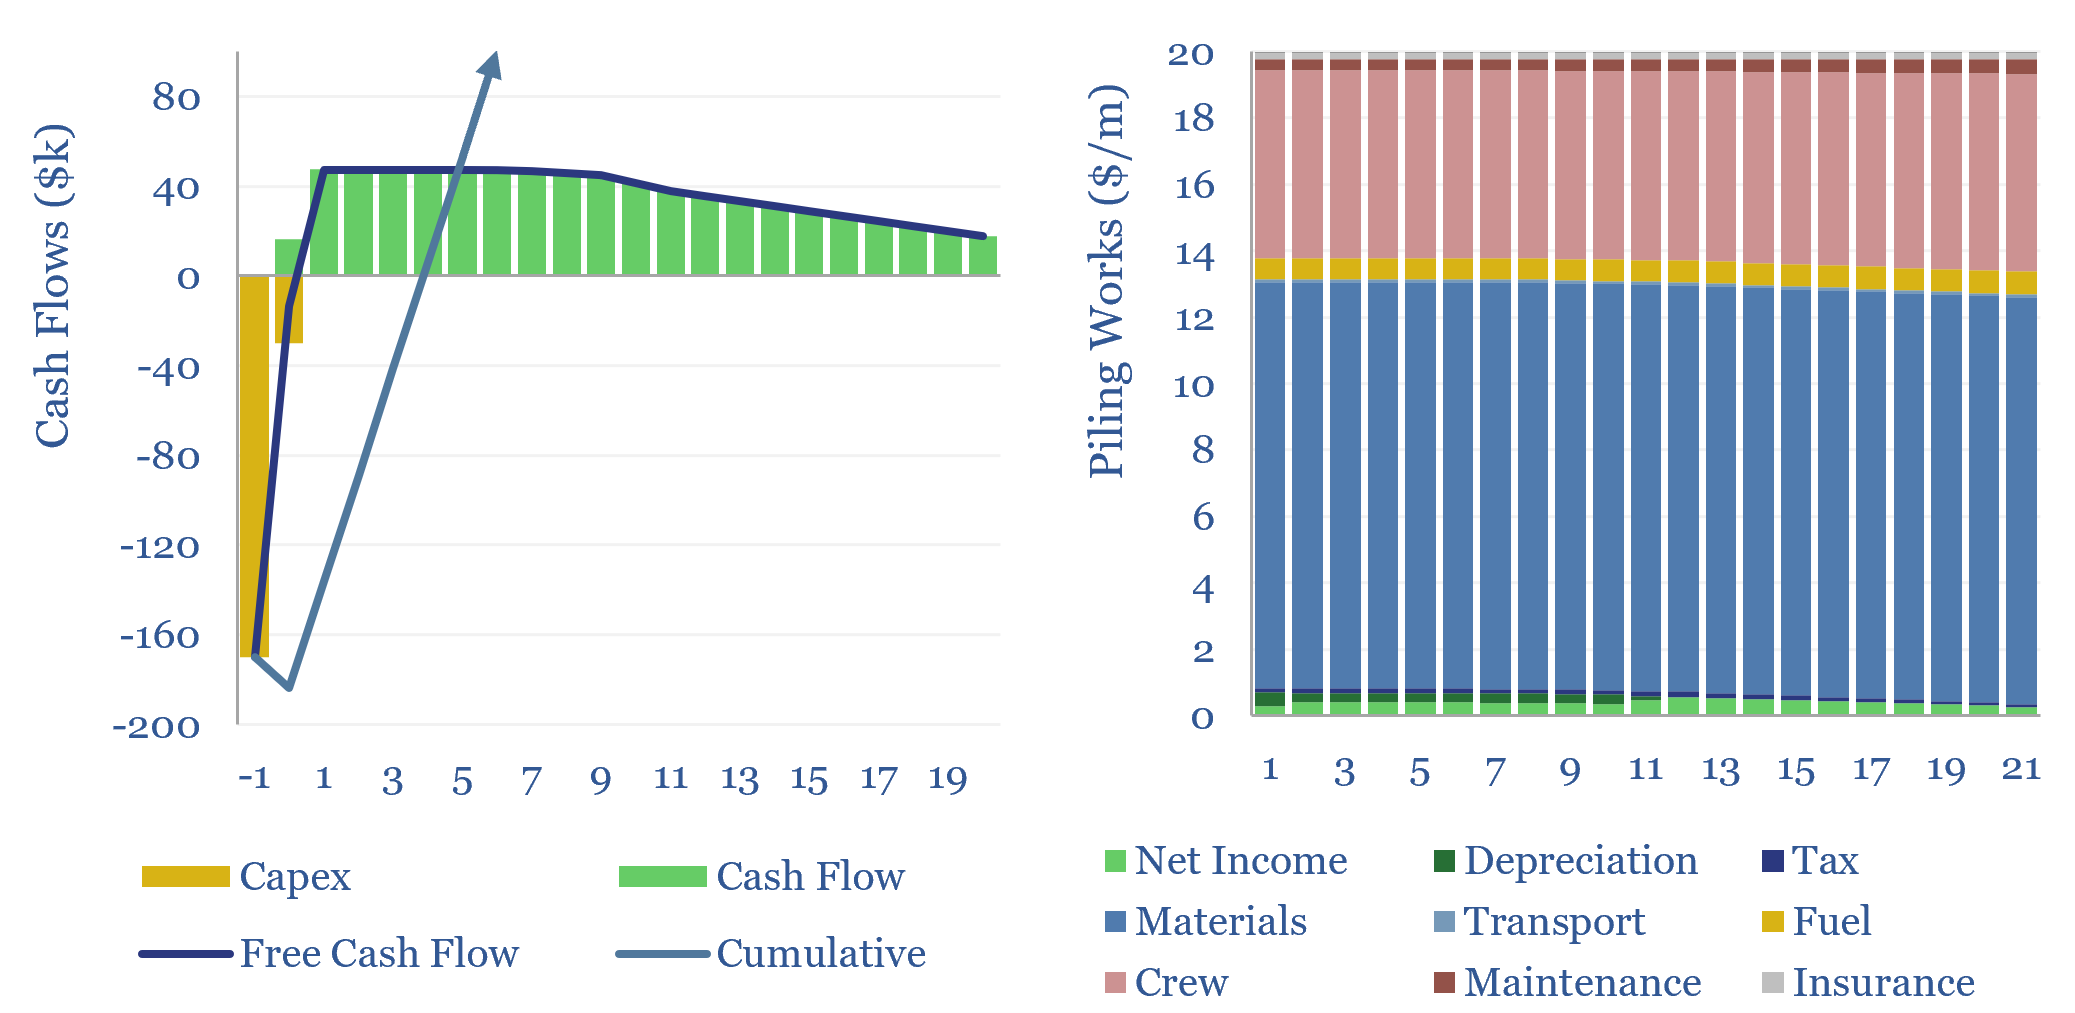
Piling works: anchoring construction costs?

Piling works involve driving long vertical shafts into the ground, which will anchor and support a structure. The costs of piling works can run to $20-200/m, as captured in this data-file, to generate a return and cover the costs of piling operations.
-
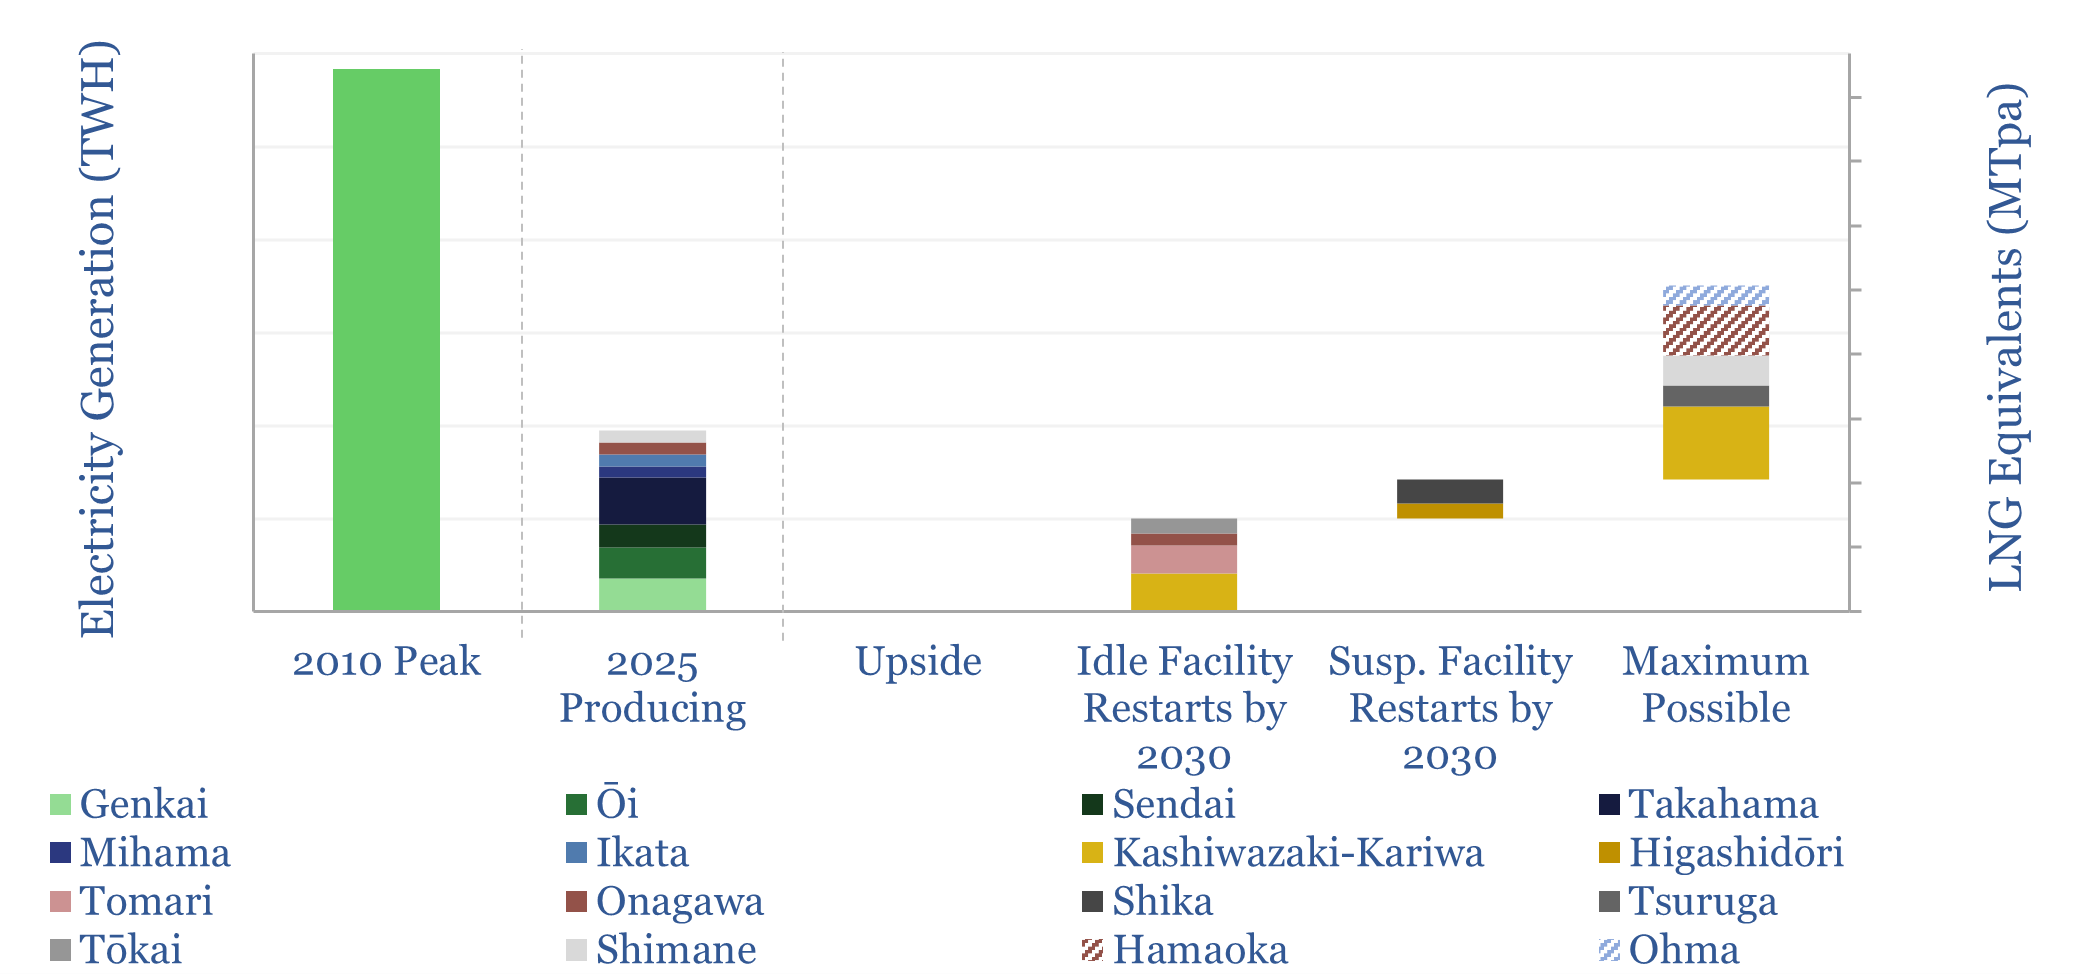
Japan: nuclear restart tracker?

This data-file looks through 17 major nuclear plants in Japan with 45GW of operable capacity, covering the key parameters and restart news on each facility. Japan’s nuclear restart had ramped output back to 97TWH pa by 2025, and may rise by a further 80 TWH by 2030, to meet targets for 20% nuclear in the…

Content by Category
- Batteries (96)
- Biofuels (44)
- Carbon Intensity (48)
- CCS (64)
- CO2 Removals (9)
- Coal (44)
- Commentary (65)
- Company Diligence (105)
- Data Models (927)
- Decarbonization (163)
- Demand (131)
- Digital (90)
- Downstream (47)
- Economic Model (222)
- Energy Efficiency (76)
- Hydrogen (63)
- Industry Data (311)
- LNG (56)
- Materials (86)
- Metals (89)
- Midstream (45)
- Natural Gas (163)
- Nature (76)
- Nuclear (28)
- Oil (178)
- Patents (39)
- Plastics (44)
- Power Grids (156)
- Renewables (153)
- Screen (138)
- Semiconductors (35)
- Shale (58)
- Solar (72)
- Supply-Demand (53)
- Vehicles (94)
- Video (24)
- Wind (46)
- Written Research (409)