Shale
-
US shale: outlook and forecasts?

This model sets out our US shale production forecasts by basin. It covers the Permian, Bakken, Eagle Ford, Marcellus/Utica and Haynesville, as a function of the rig count, drilling productivity, completion rates, well productivity and type curves. The data-file was last updated in May-2025, revising liquids growth negative in 2025-26, which in turn tightens US…
-
Canadian shale producers and E&P costs?

This data-file is a screen of Canadian upstream companies and Canadian shale producers, especially focused on the fast-growing Montney-Duvernay shale plays. Key themes are rising shale oil and gas production, low-capex wells, high well-level IRRs, performance improvements and consolidation via M&A.
-
Global shale basins: resources and production?
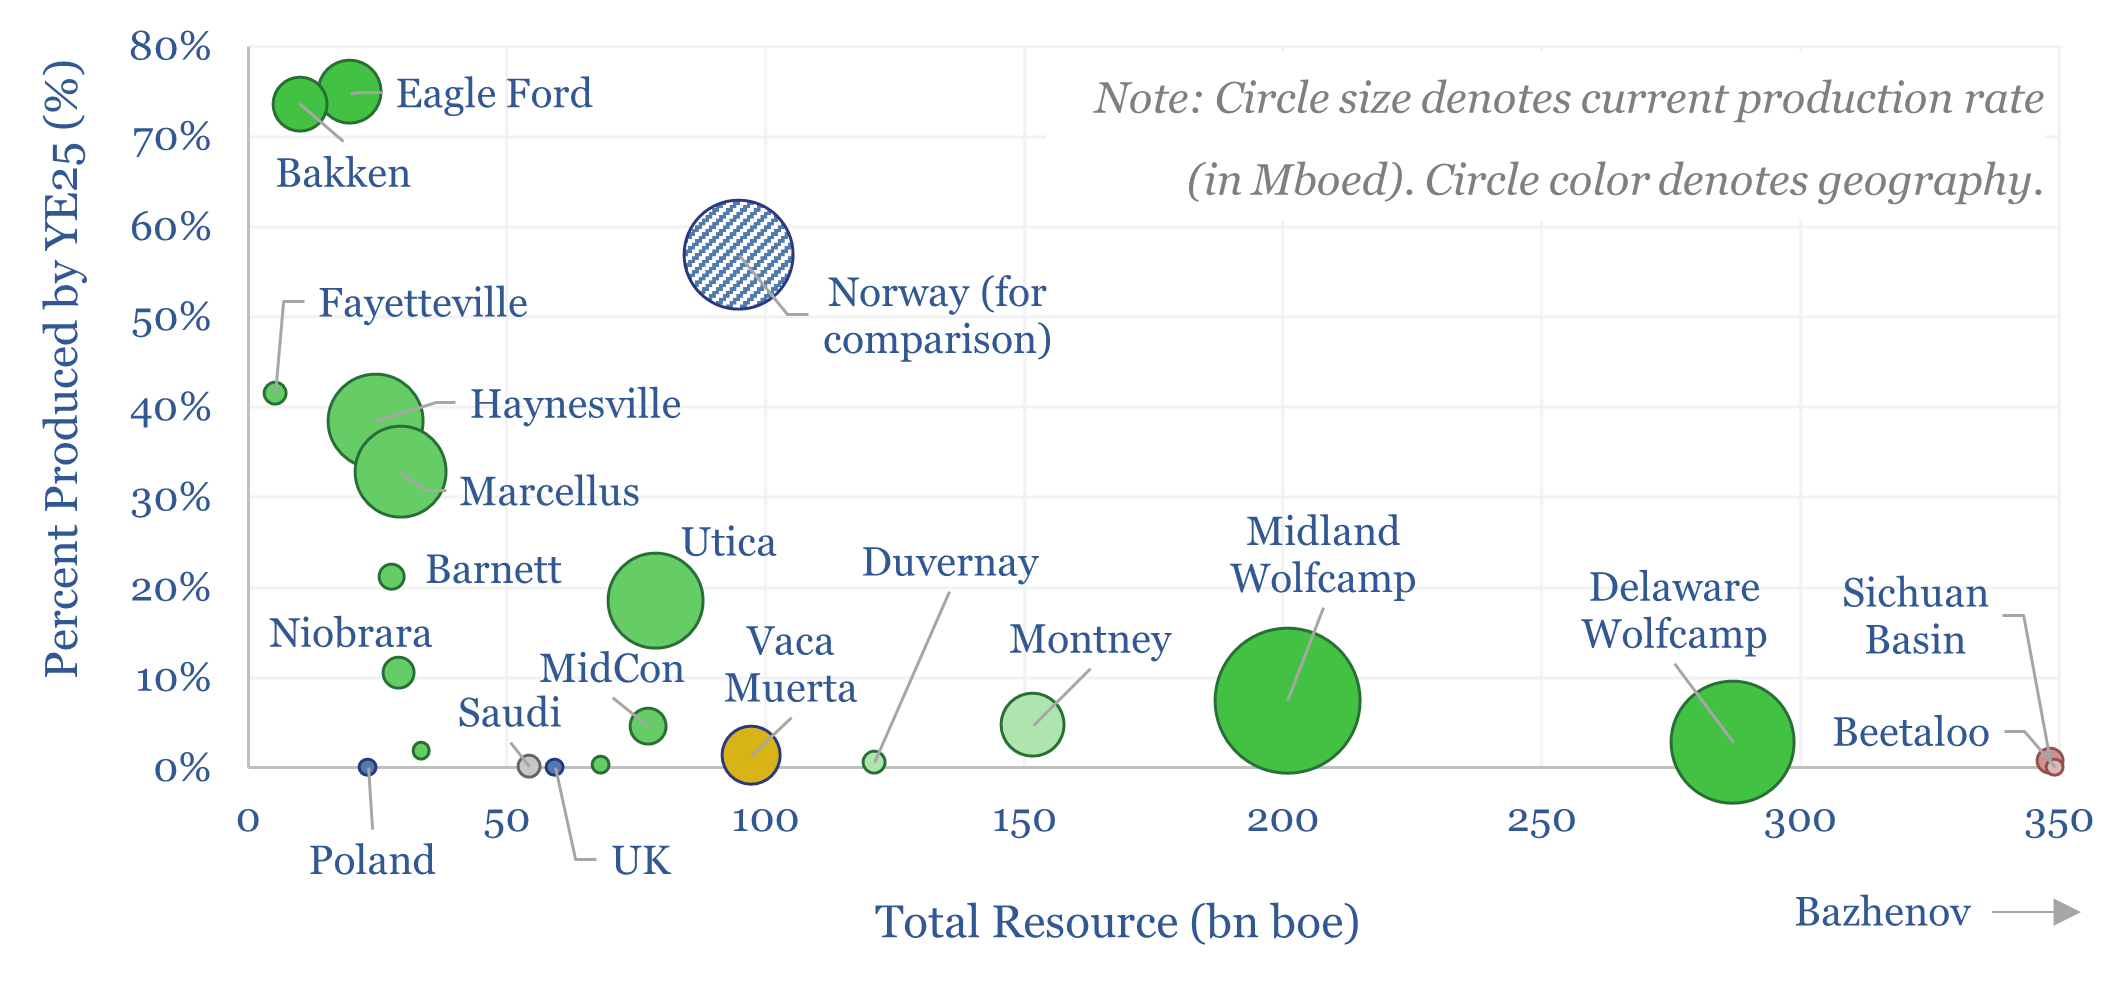
Global shale basins are currently producing 12Mbpd of liquids and 110bcfd of gas, across over 20 basins, with over 1 trn bbls of oil resources and 13,000 TCF of gas resources. 3% of all global shale resource has been produced to date. This data-file tabulates resources and production across each basin.
-
Bakken oil production by well: 2015 to 2026?
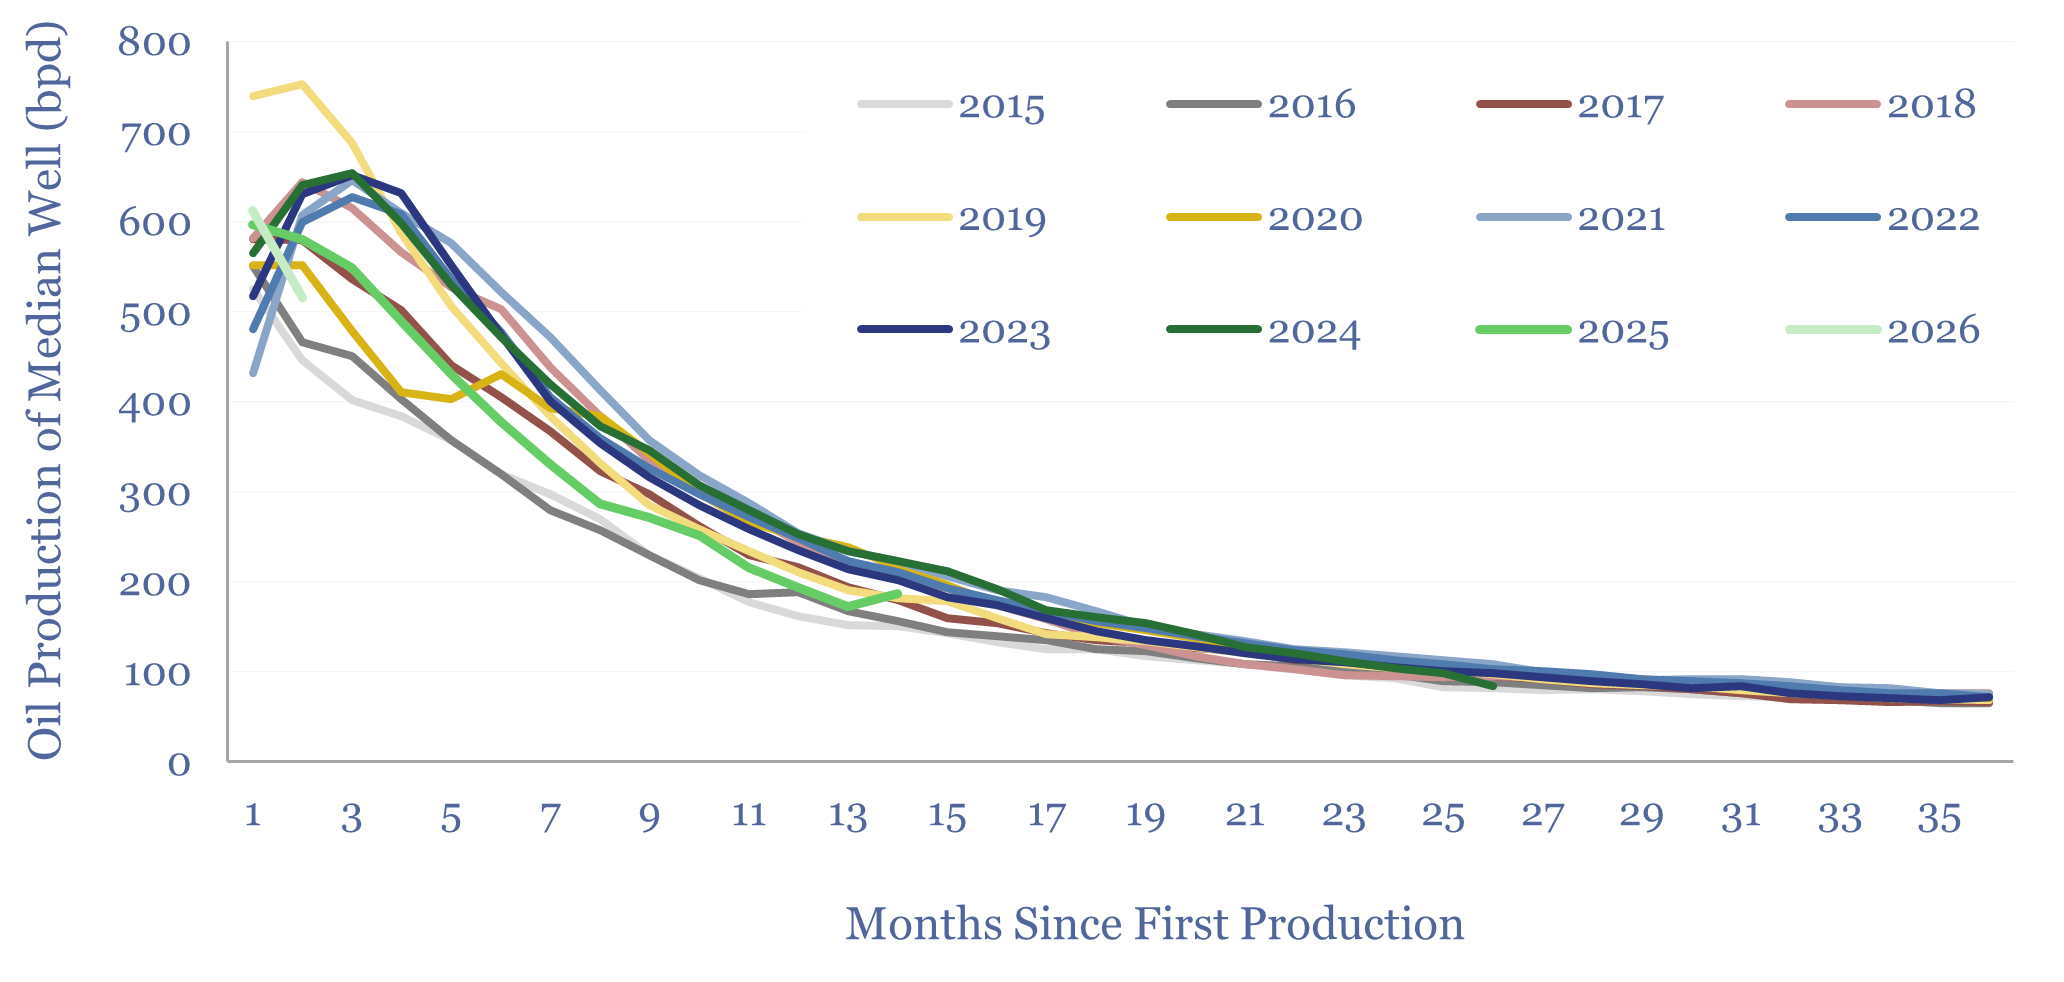
This data-file aggregates the monthly production data from 10,000 wells in the Bakken, which were drilled and completed over the past decade from 2015 to early 2026. Average Year 1 oil production quadrupled from 2006 to reach 360bpd in 2015-16, continued rising to a peak of 460bpd in 2021, flatlined at 440bpd in 2022-24 and…
-
Marcellus shale: well completion parameters?

This data-file tracks a sample of Marcellus shale well completion parameters, such as lateral length, stage count, proppant and water use and shut-in pressure. Together, these variables explain 40-50% of the variance in shale well productivity, implying the other 50-60% is down to skill and technology, from operators and service providers?
-
US shale gas: the economics?

US shale gas economics are captured in this data-file, requiring a $2.5/mcf hub-level gas price, for a 10% IRR, on a large, $17M shale gas well in a basin such as the Marcellus. The marginal cost for unlocking c3% pa production growth from key shale basins is likely in a range of $3-4/mcf, but the…
-
Schlumberger: AI and machine learning patents?
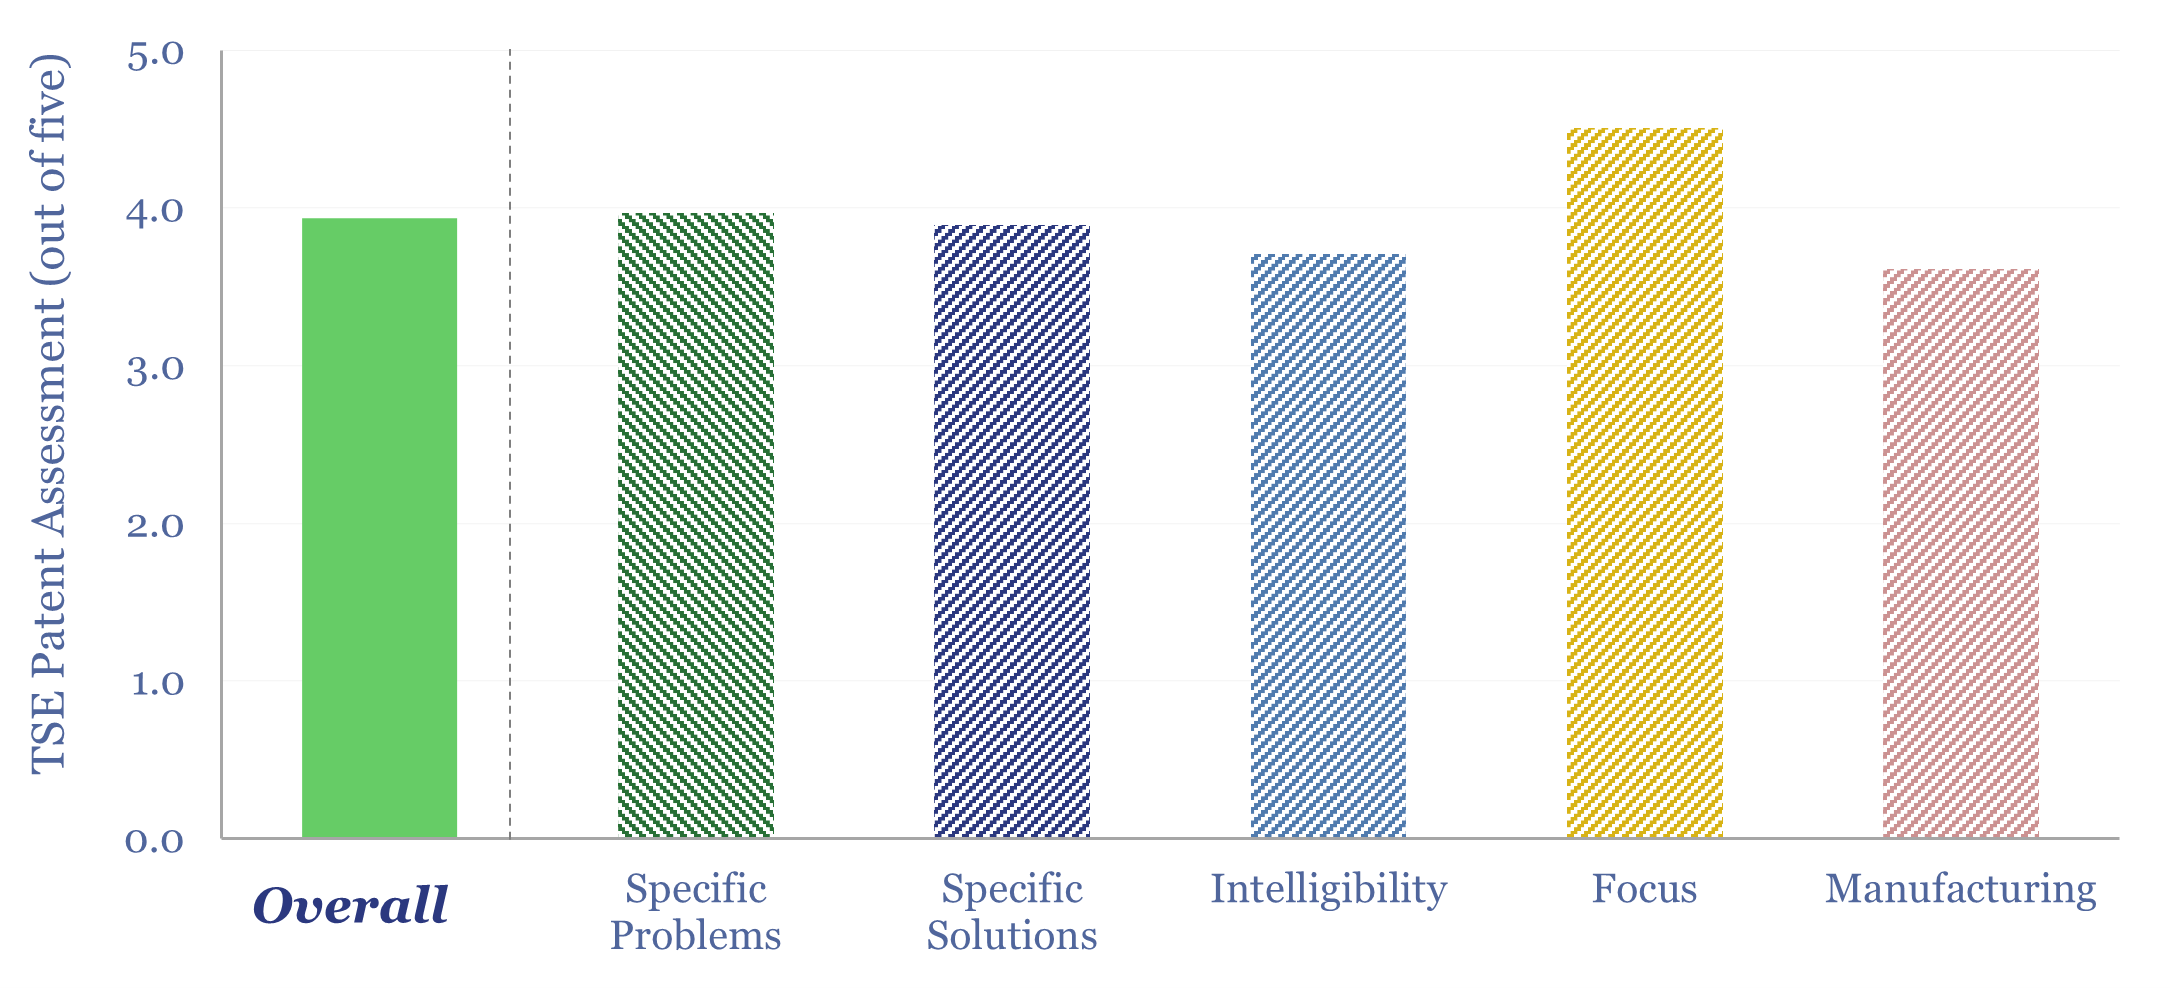
We have screened 65 Schlumberger AI and machine learning patents, filed in 2024-25. This is more than any other energy company. We expect AI to improve shale well productivity, entrench the reliance on Schlumberger tools and services, while also reducing costs, labor, time and net energy use in oil and gas.
-
Marcellus shale: well by well production database?

This data-file tracks Marcellus shale well productivity, by tabulating the monthly output from 13,000 wells across the Pennsylvania Marcellus, from 2015 to mid-2024. Average IP rates across the basin have risen at a 12% pa CAGR, from around 5 mmcfd in 2015 to 18 mmcfd in 2025. However, activity and productivity differ starkly by operator.
-
What if the US had never ramped shale?
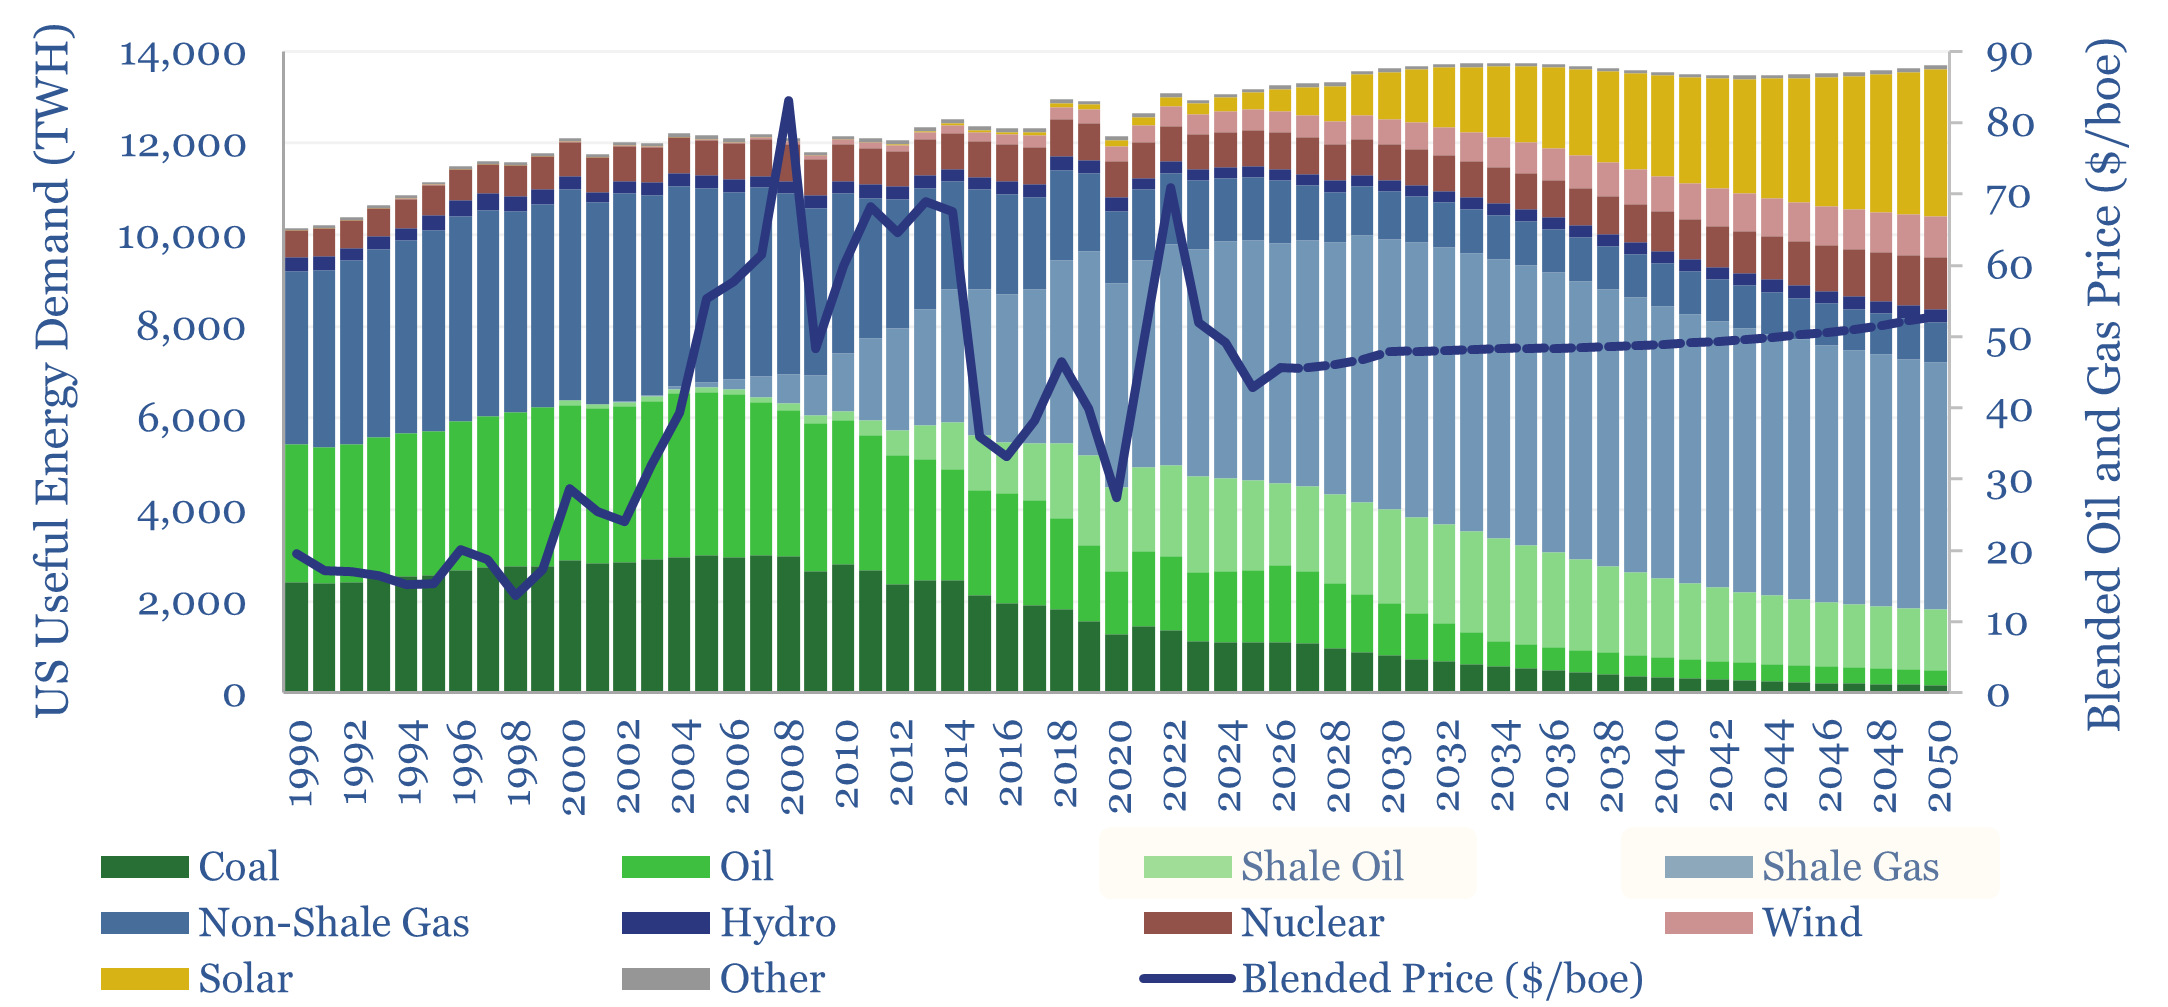
If the US had not ramped 12Mbpd of shale oil and 90bcfd of shale gas, over the past 10-15 years, we estimate US CPI would have run +0.7% pa higher, due to expansionist monetary policy, and other environmental policies. Hence this 13-page report explores whether the end of shale deflation now points to higher US…
-
US shale oil: the economics?

Shale oil production costs are captured in this data-file. In our base case, a $60/bbl oil price unlocks a 30% well-level IRR at a Permian-type well in 2025, costing $10M in capex, IP-ing at 1kbpd, with other costs based on technical papers and the reporting from leading US E&Ps. Shale oil economics can be stress-tested…
Content by Category
- Batteries (96)
- Biofuels (44)
- Carbon Intensity (48)
- CCS (64)
- CO2 Removals (9)
- Coal (44)
- Commentary (65)
- Company Diligence (105)
- Data Models (930)
- Decarbonization (163)
- Demand (132)
- Digital (92)
- Downstream (47)
- Economic Model (223)
- Energy Efficiency (76)
- Hydrogen (63)
- Industry Data (311)
- LNG (56)
- Materials (86)
- Metals (90)
- Midstream (45)
- Natural Gas (163)
- Nature (76)
- Nuclear (28)
- Oil (179)
- Patents (39)
- Plastics (44)
- Power Grids (157)
- Renewables (153)
- Screen (139)
- Semiconductors (36)
- Shale (58)
- Solar (73)
- Supply-Demand (53)
- Vehicles (94)
- Video (24)
- Wind (46)
- Written Research (411)