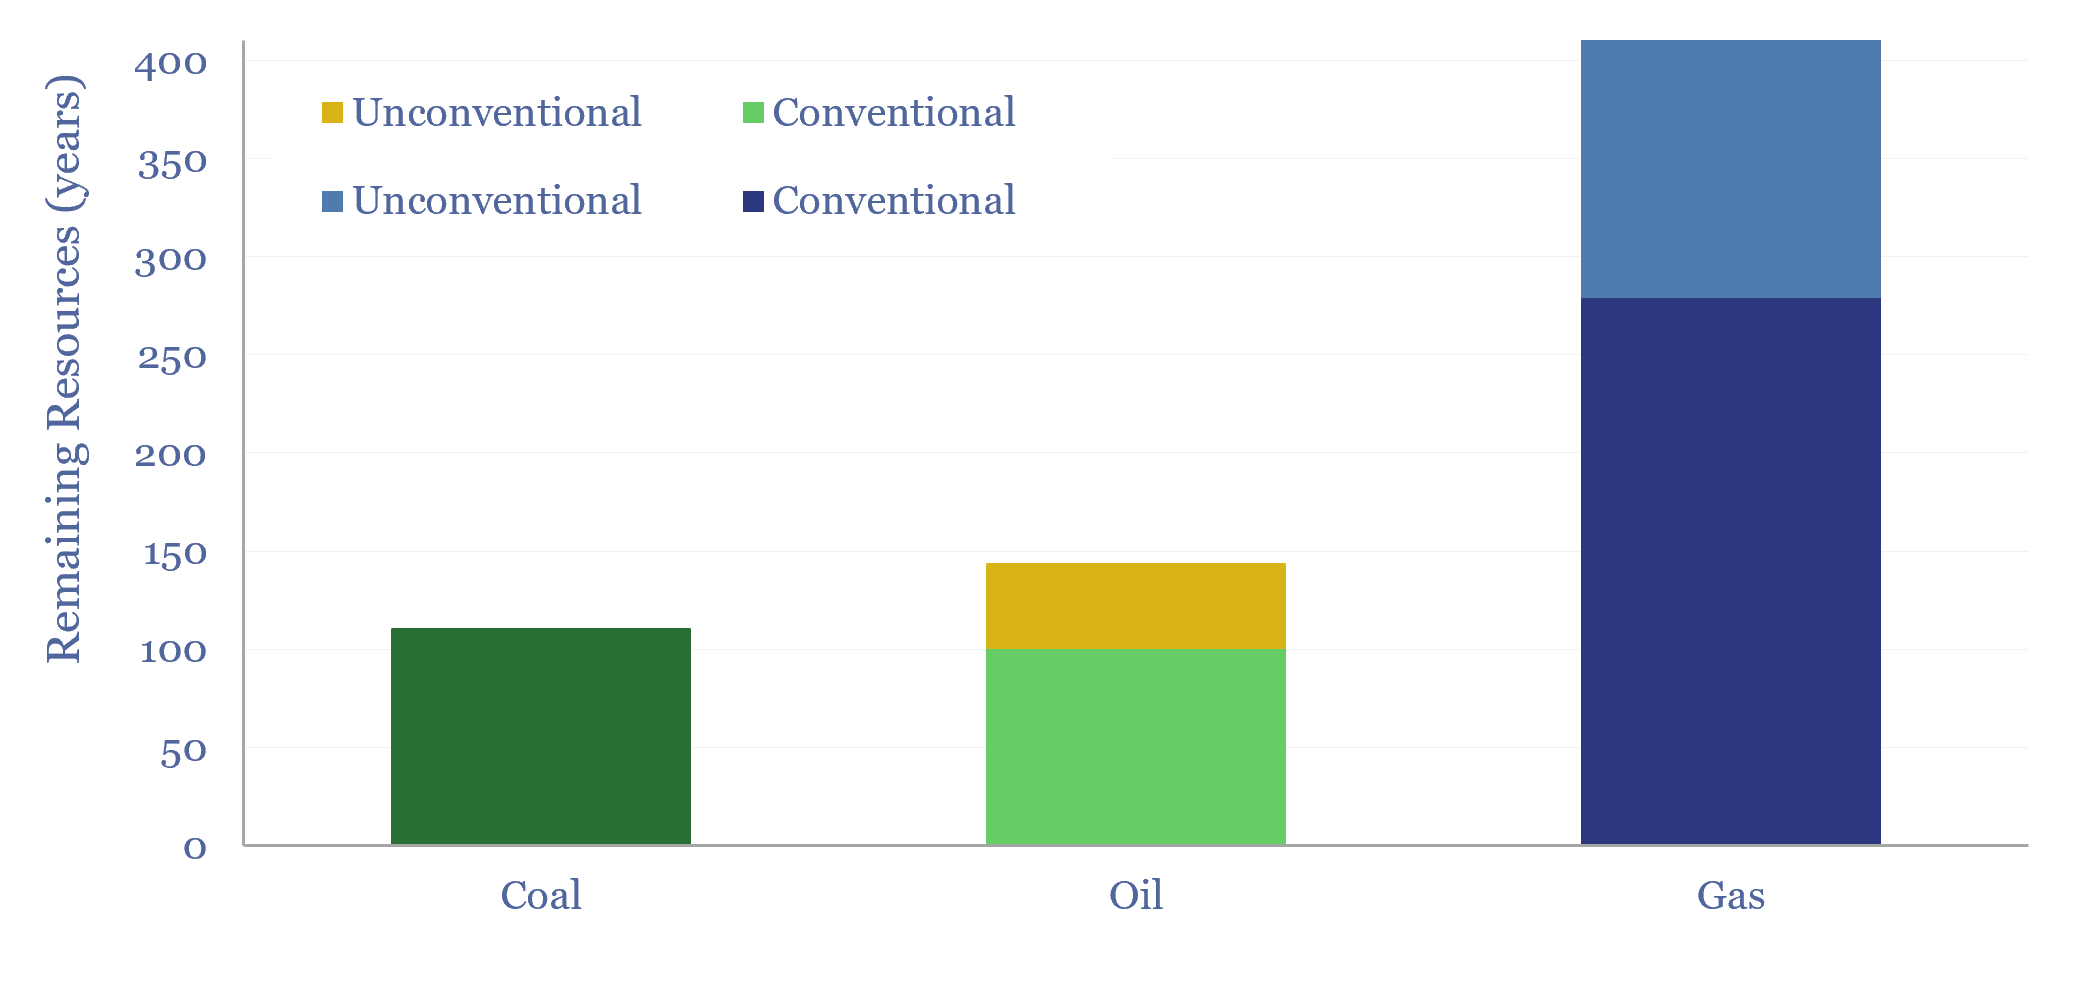
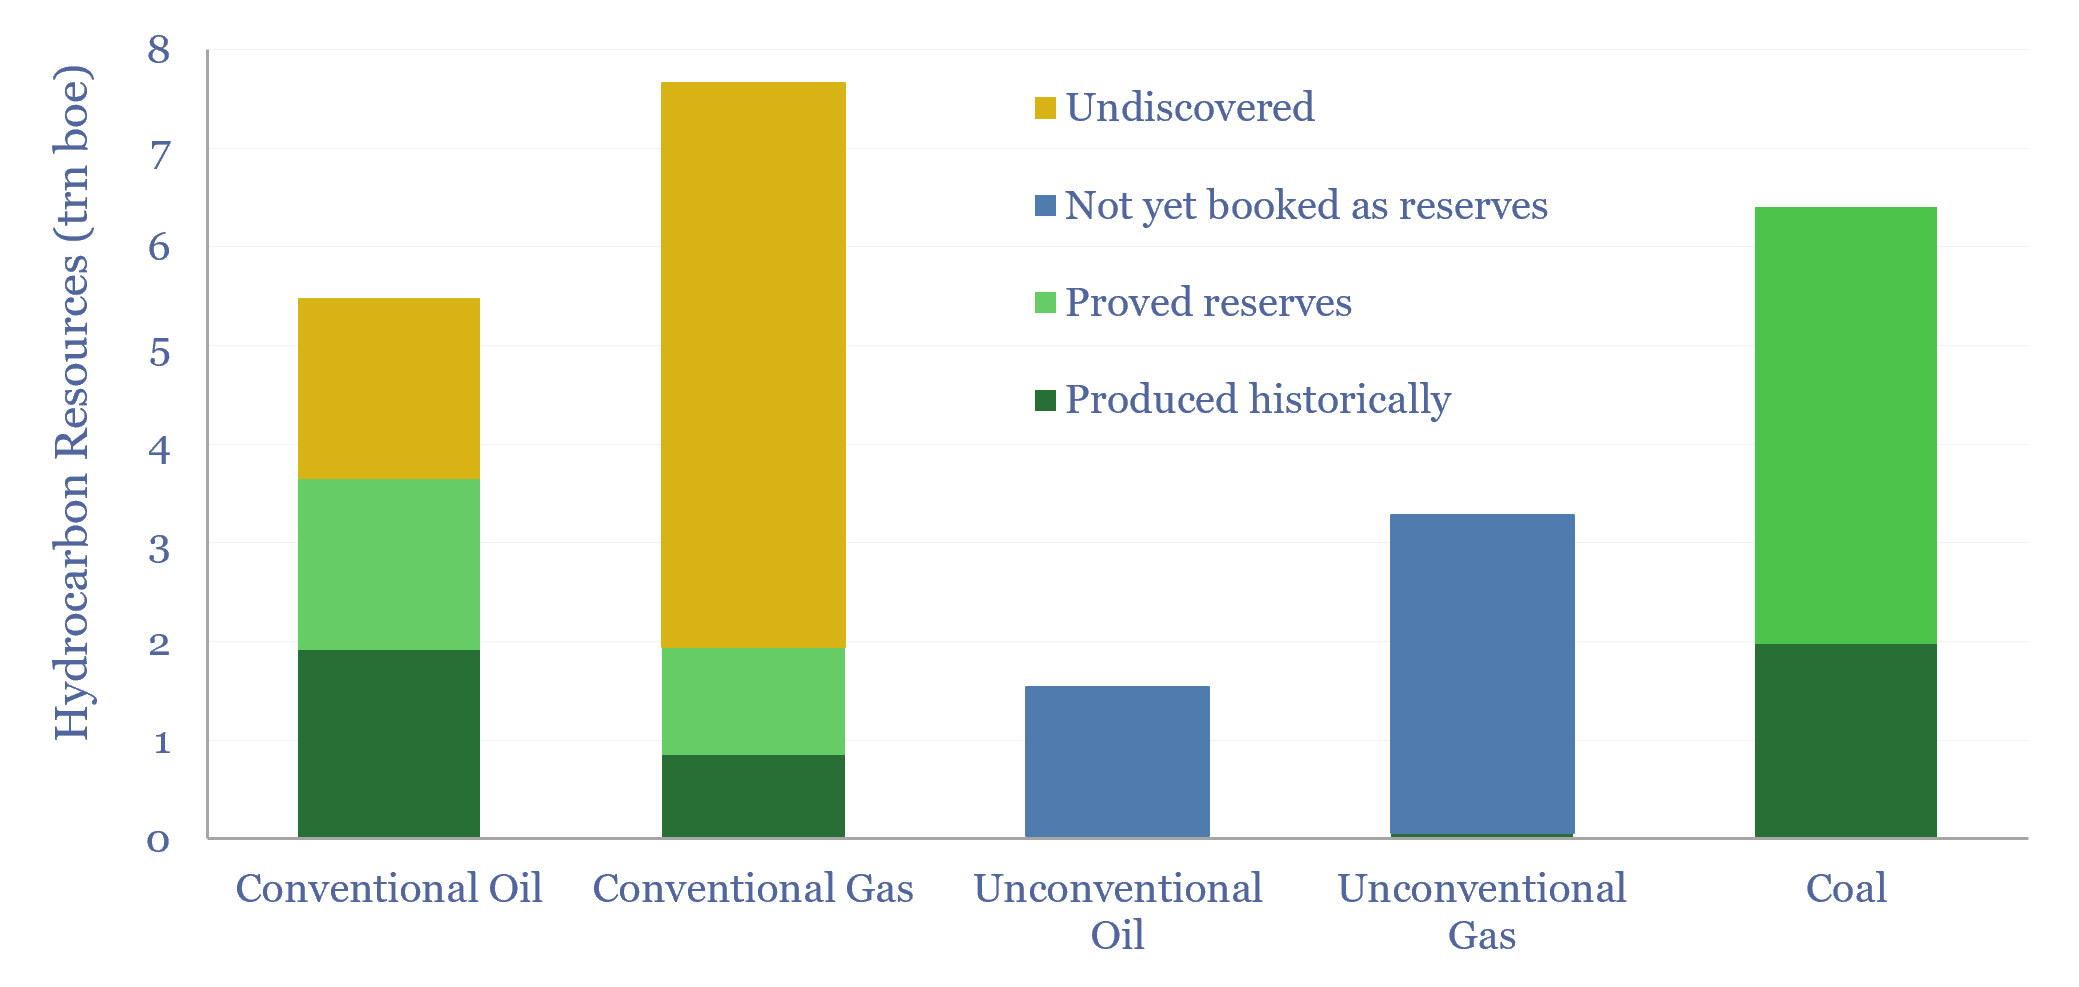
We have quantified global hydrocarbon resources, from first principles, in this 15-page report. We estimate how much oil, gas and coal ever formed across the total history of the world. And more importantly, we estimate how much is left. Our numbers support an energy transition from coal to gas.
Read the Report?
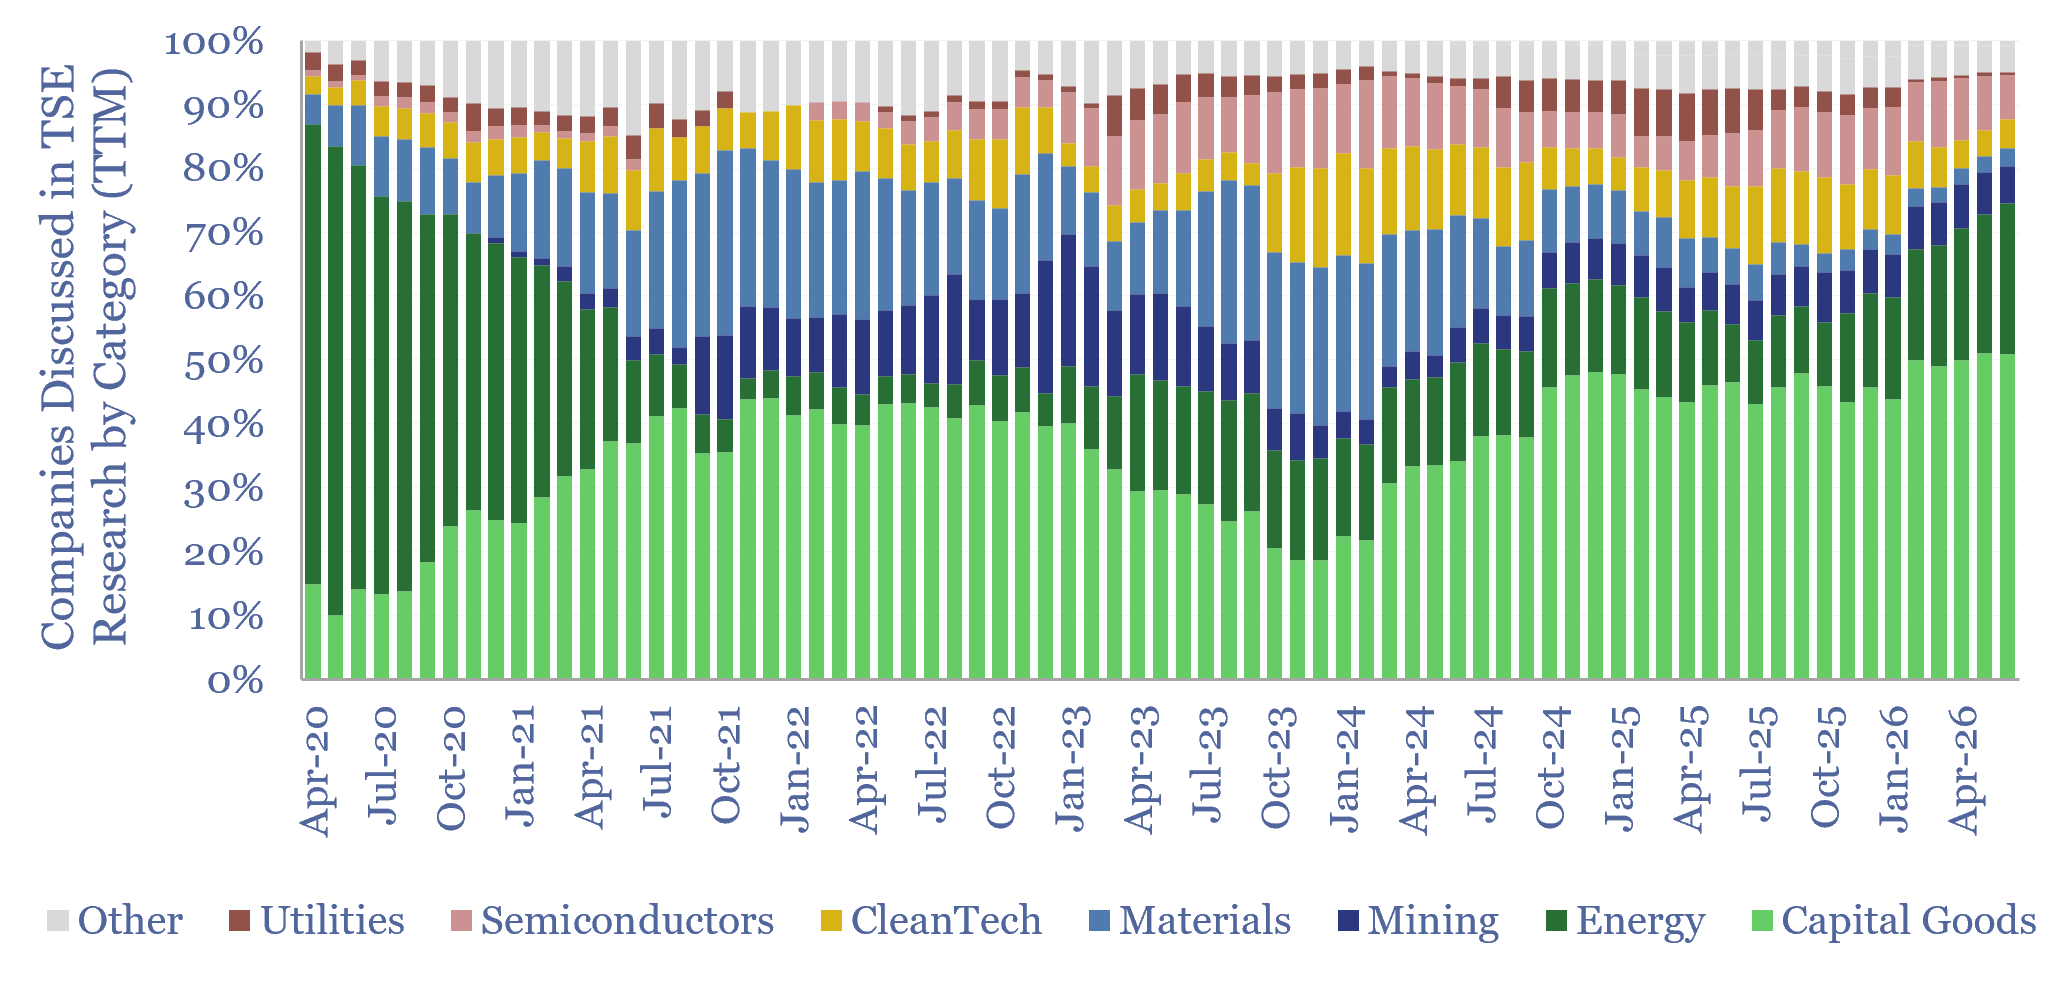
This 12-page report looks back at all of our research from the past year, to draw out our top ten conclusions in energy, industrials and materials. Energy volatility buoys solar and batteries. The ‘AI energy transition’ boosts the physical AI ecosystem more than the data center ecosystem?
Read the Report?
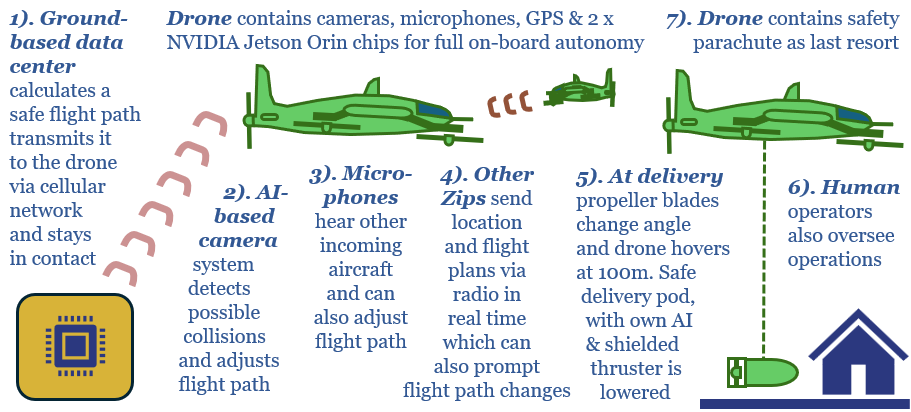
Delivery drones are finally taking off? Pilot projects in the US are achieving strong safety records, exciting consumers and raising the prospect of sub-$1 deliveries within 10-minutes. This 13-page report explores the future impacts of delivery drones in energy, materials and capital goods.
Read the Report?
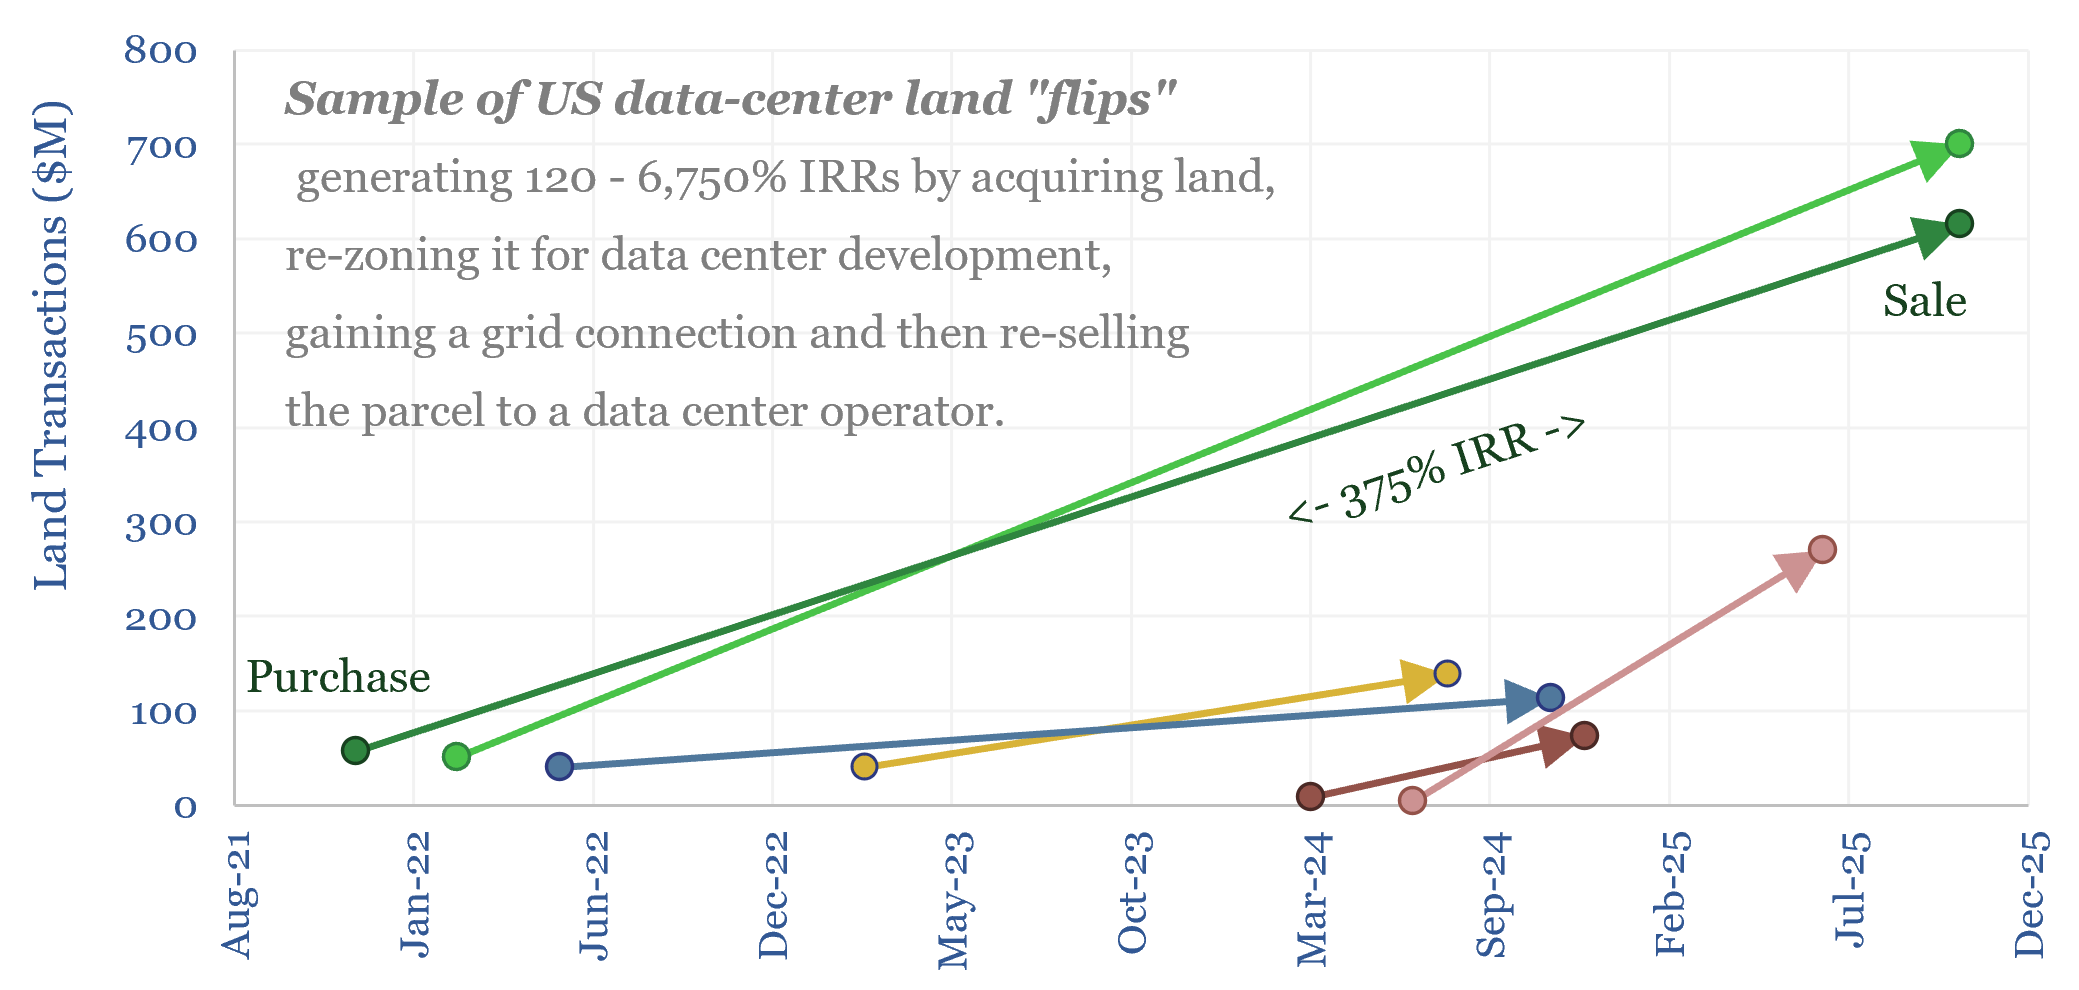
Are speculative data center projects, 80% of which will never get built, inflating future load growth forecasts? This 18-page report reviews evidence from land developer returns, recent PUC deliberations and evolving terms in Electrical Service Agreements (ESAs).
Read the Report?
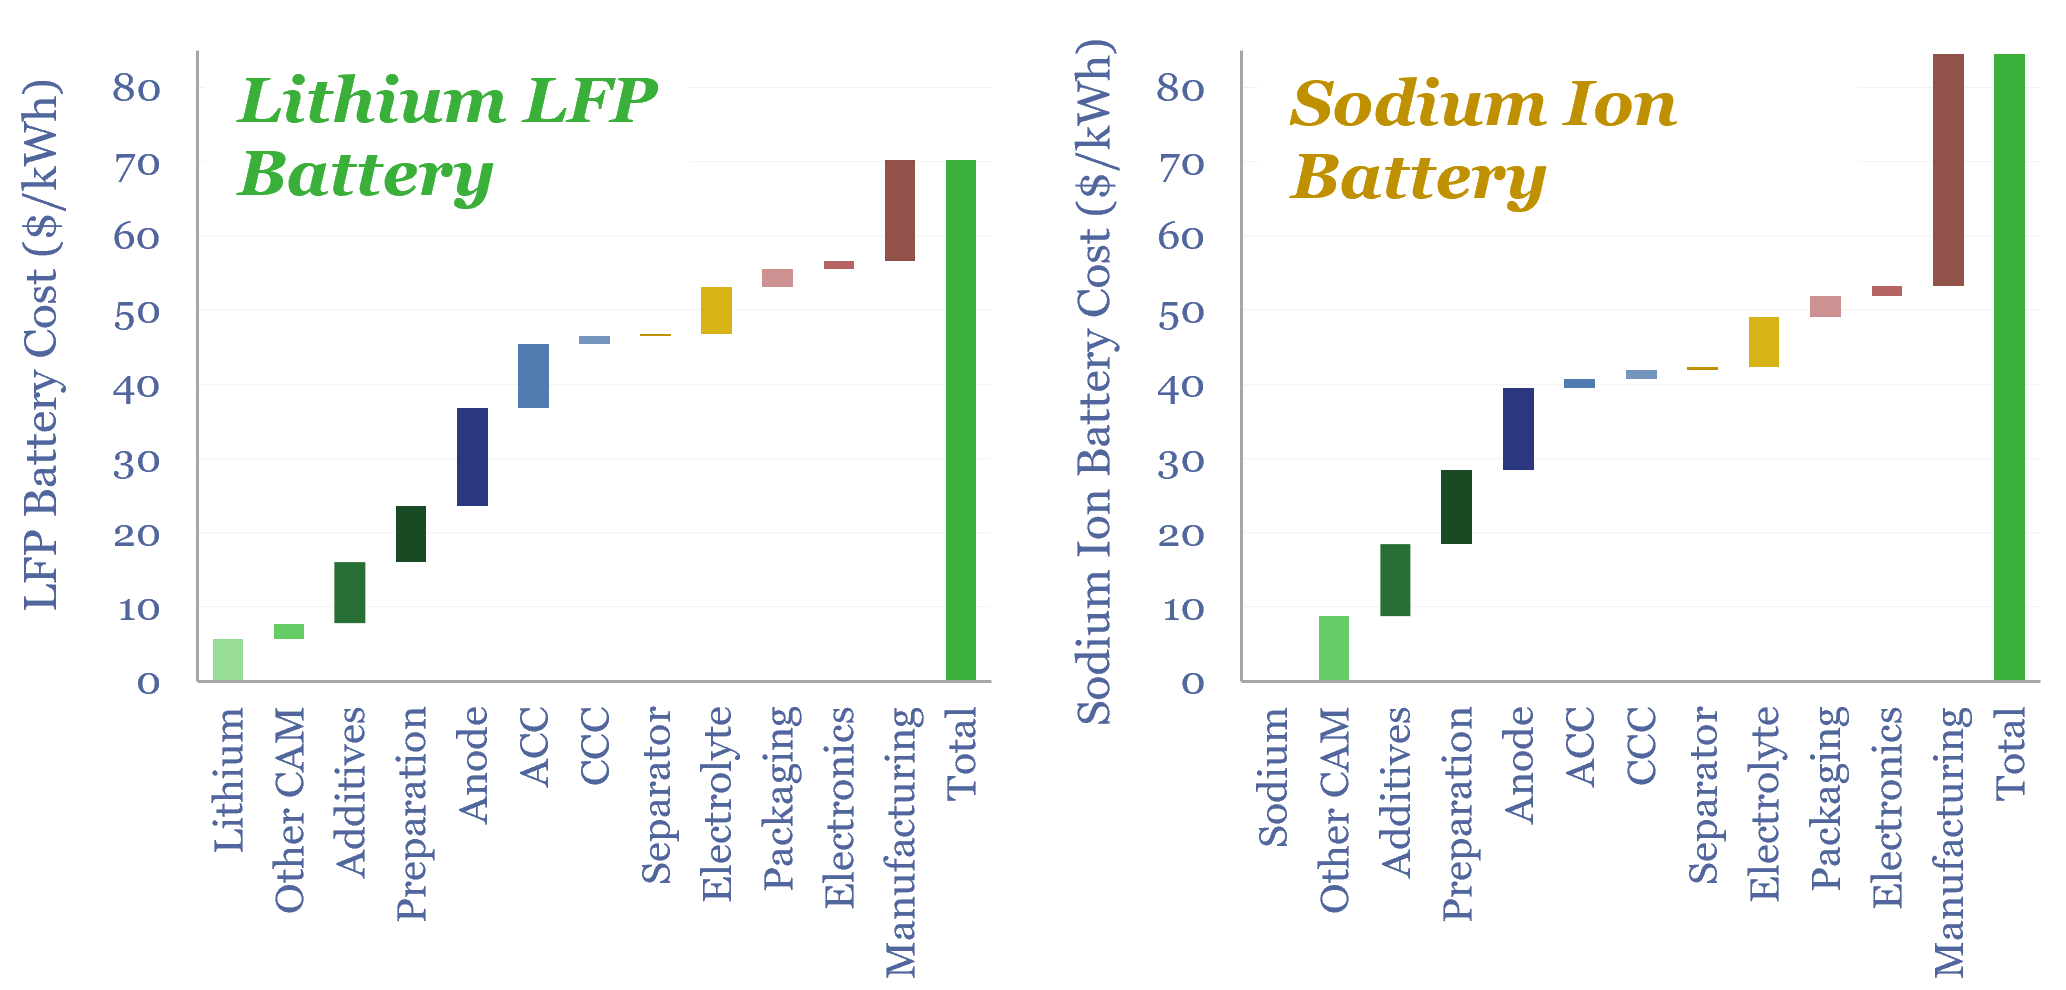
Sodium is 1,000x more abundant than lithium in the Earth’s crust and 99% cheaper. So will sodium ion batteries disrupt lithium ion batteries? Not until lithium carbonate prices treble to $40/kg. Or novel SIB electrode materials emerge. This 16-page SIB deep-dive de-risks our lithium market outlook.
Read the Report?
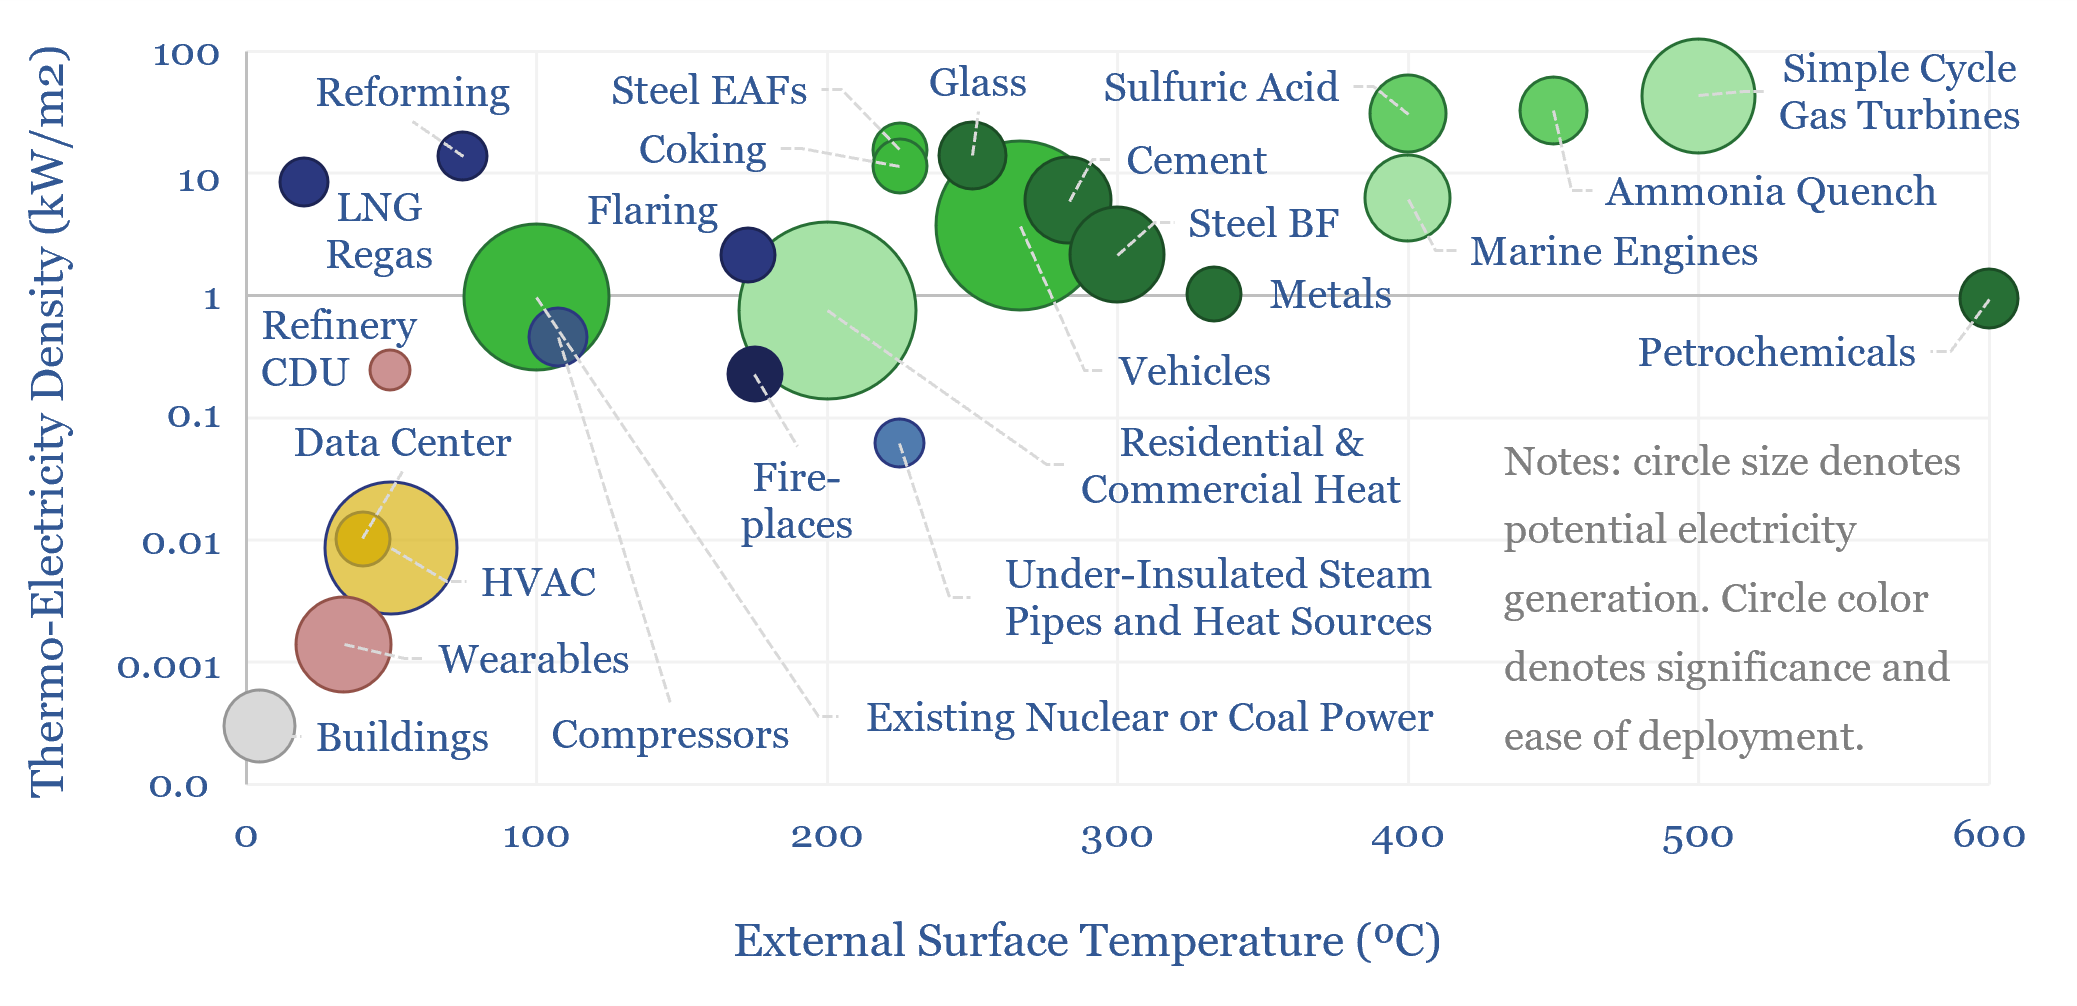
Next-generation thermoelectrics, if discovered by AI, could be a world-changer, converting heat to electricity at 10-50% efficiency, costing $500/kWe. 10,000 TWH of incremental electricity could be generated, worth $500-1,000bn pa. This 17-page report outlines our ‘top ten’ use cases for thermoelectrics.
Read the Report?
Residential heat is 13% of global energy. So what if AI could optimize residential electric heating? This 16-page report finds that load-shifting hot water tanks can unlock 1.5-8.5% additional flexibility in grids and make air source heat pumps the lowest cost option for heat in Europe, eclipsing gas-combi boilers, saving $300 per household per year?
Read the Report?
Great industrial leaps often occur when technologies collide. Hence this 20-page report explores how AI, solar, batteries and robotics might all collide together. This is transformative for the world. It represents the next “energy transition”. Hence this also becomes our new roadmap for the evolution of the global energy system.
Read the Report?
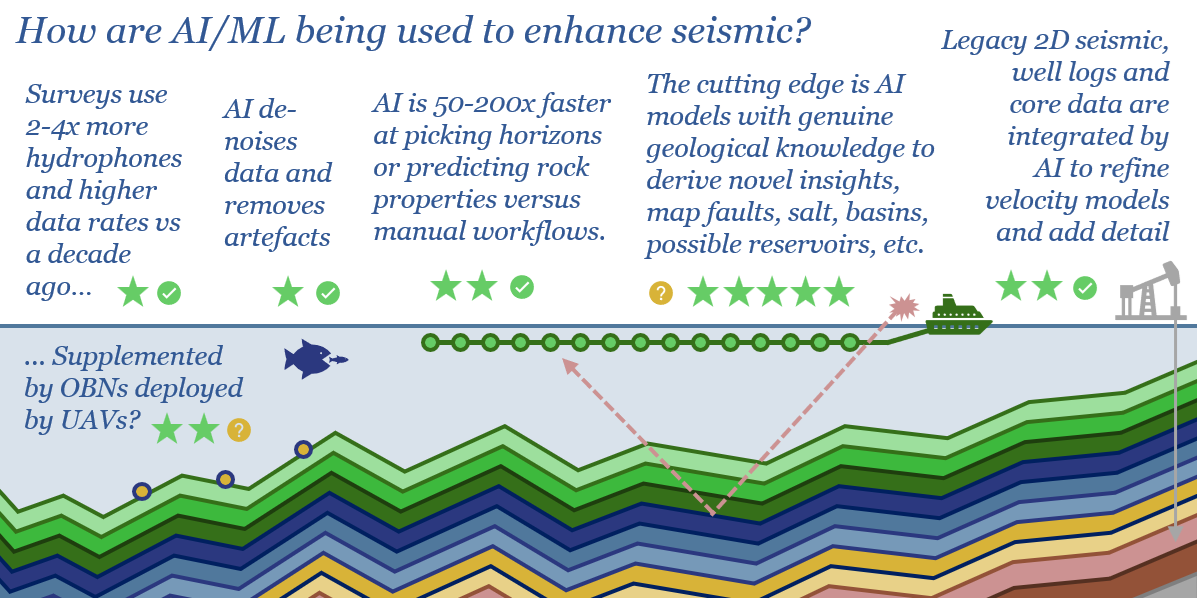
The global seismic industry is worth $10bn pa. But an additional $10bn pa of value could be unlocked by AI. This 19-page report finds promising progress with AI in seismic, uplifting the value of seismic hardware and multi-client libraries. But the theme is still in early innings. Who benefits?
Read the Report?
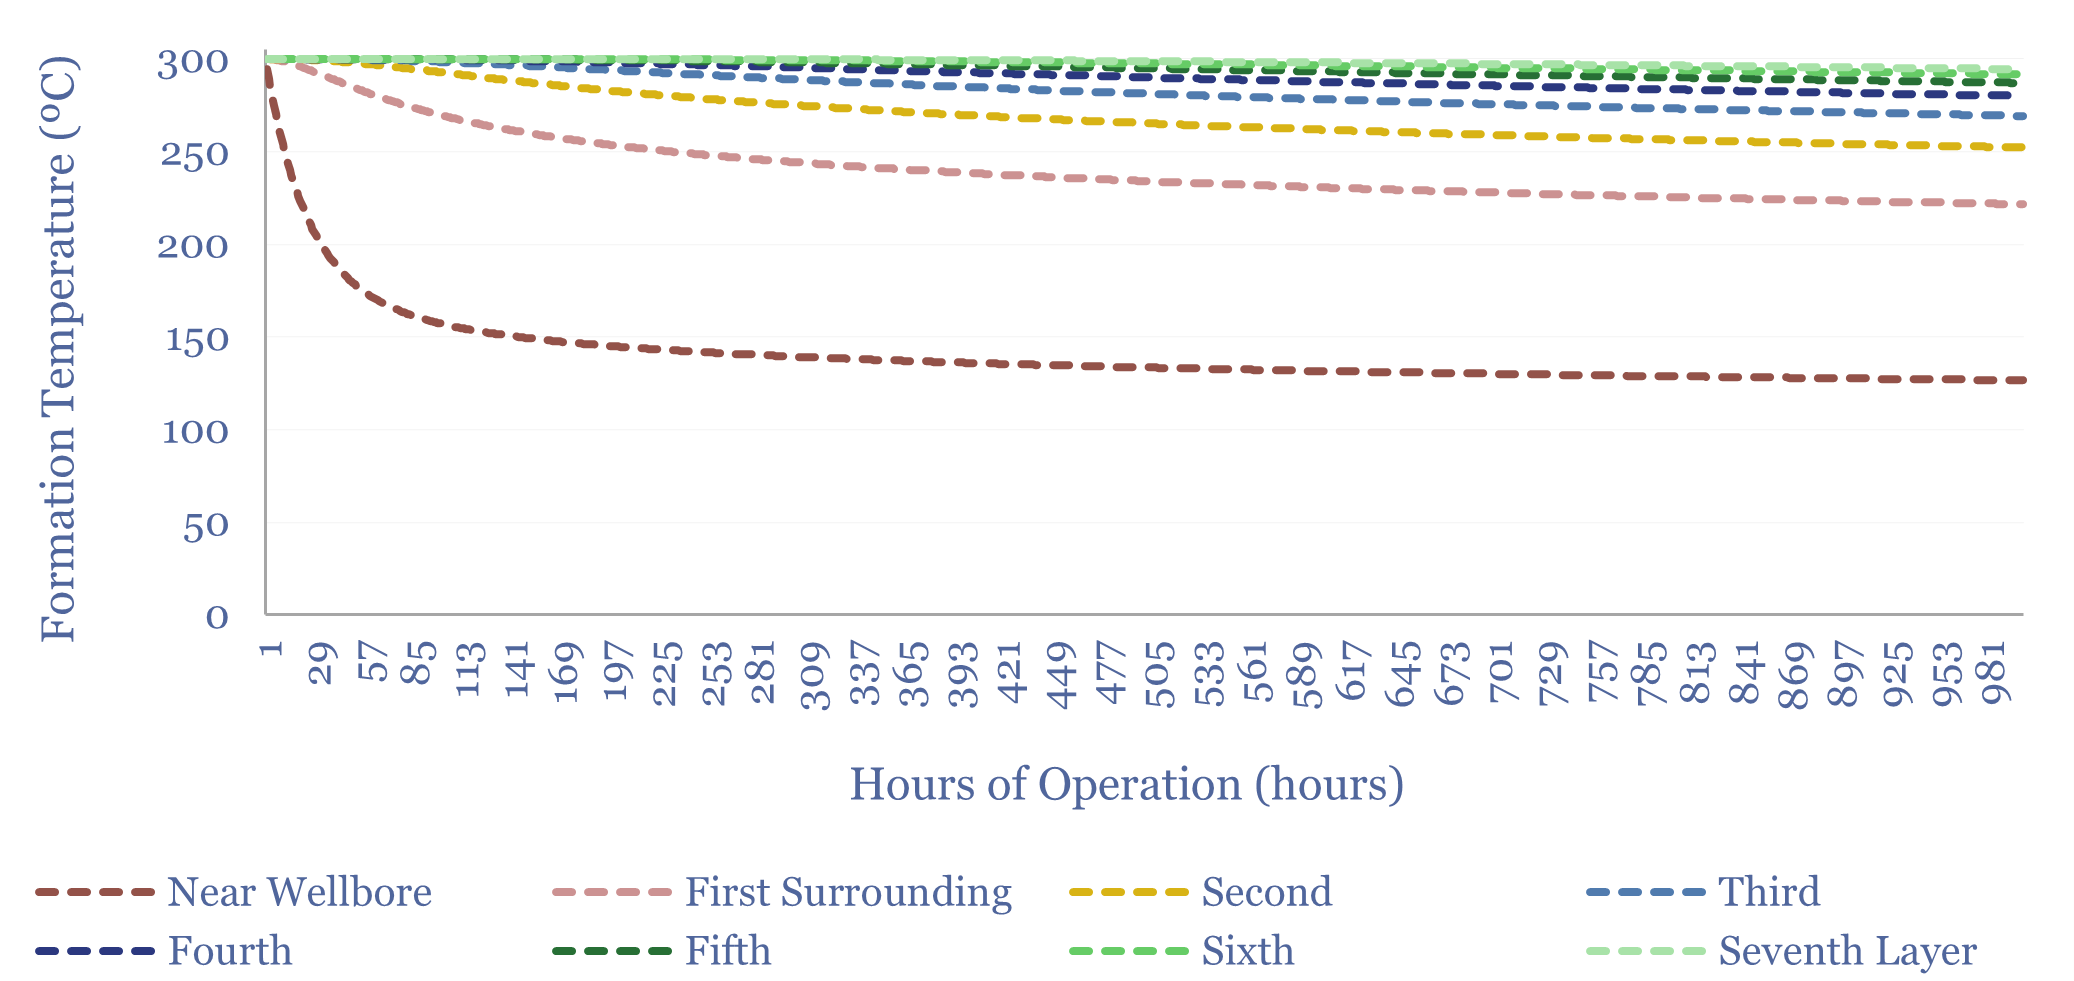
How long does a geothermal well have to be to avoid thermal depletion? To answer this question, we built our own reservoir model, which is outlined in this 12-page report. Advanced Geothermal would require 10-100km laterals, which is cost prohibitive. Enhanced Geothermal or geothermal for ‘winter heating’ may fare better.
Read the Report?
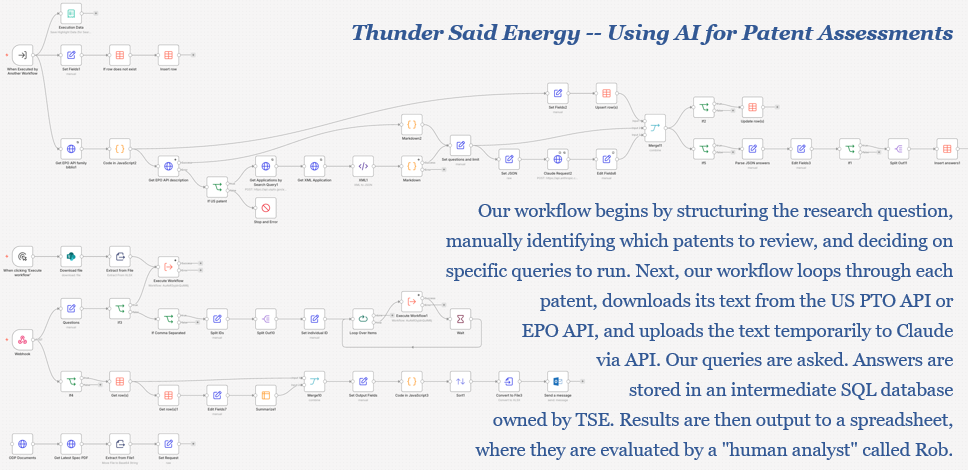
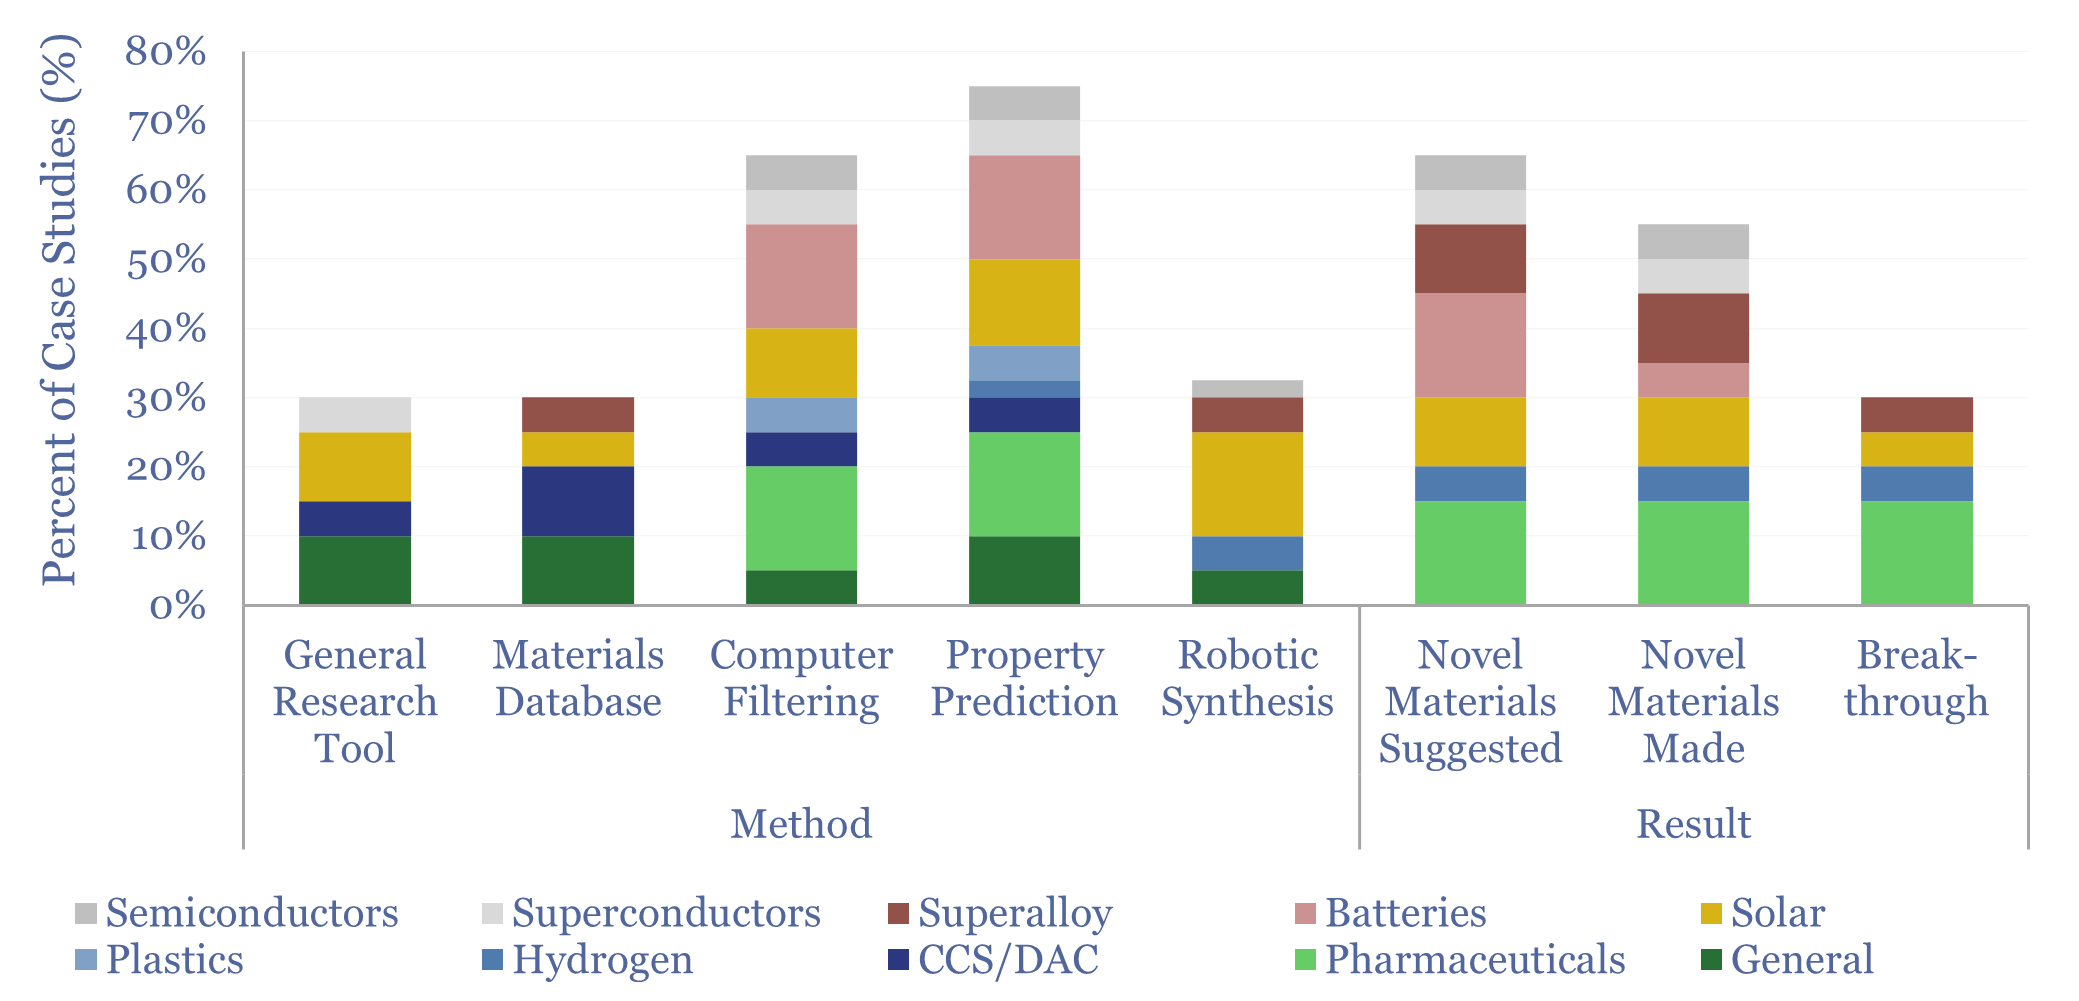
We have developed a new methodology to cover 4x more ground, and create novel data-sets, by using AI to enhance our analysis of patents. So how will this help us appraise energy technologies? This 11-page report covers our approach, data usage rights, energy use, and some of our favorite examples so far.
Read the Report?
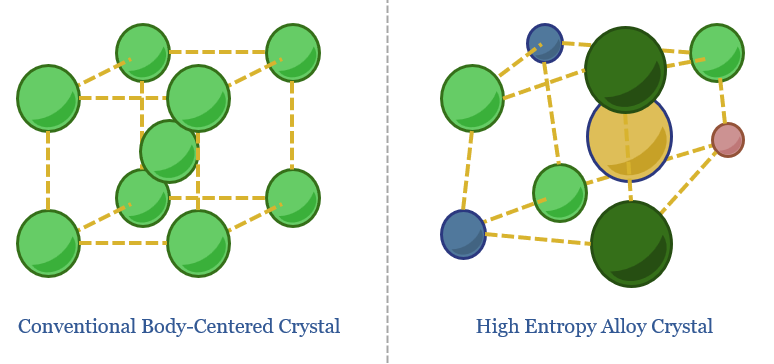
High Entropy Alloys are an emerging class of materials, composed of five or more elements, forming fascinating/novel lattice structures. This 18-page report reviews 100 recent HEA patents, and predicts generative AI will unlock transformational catalysts and materials in the next decade.
Read the Report?
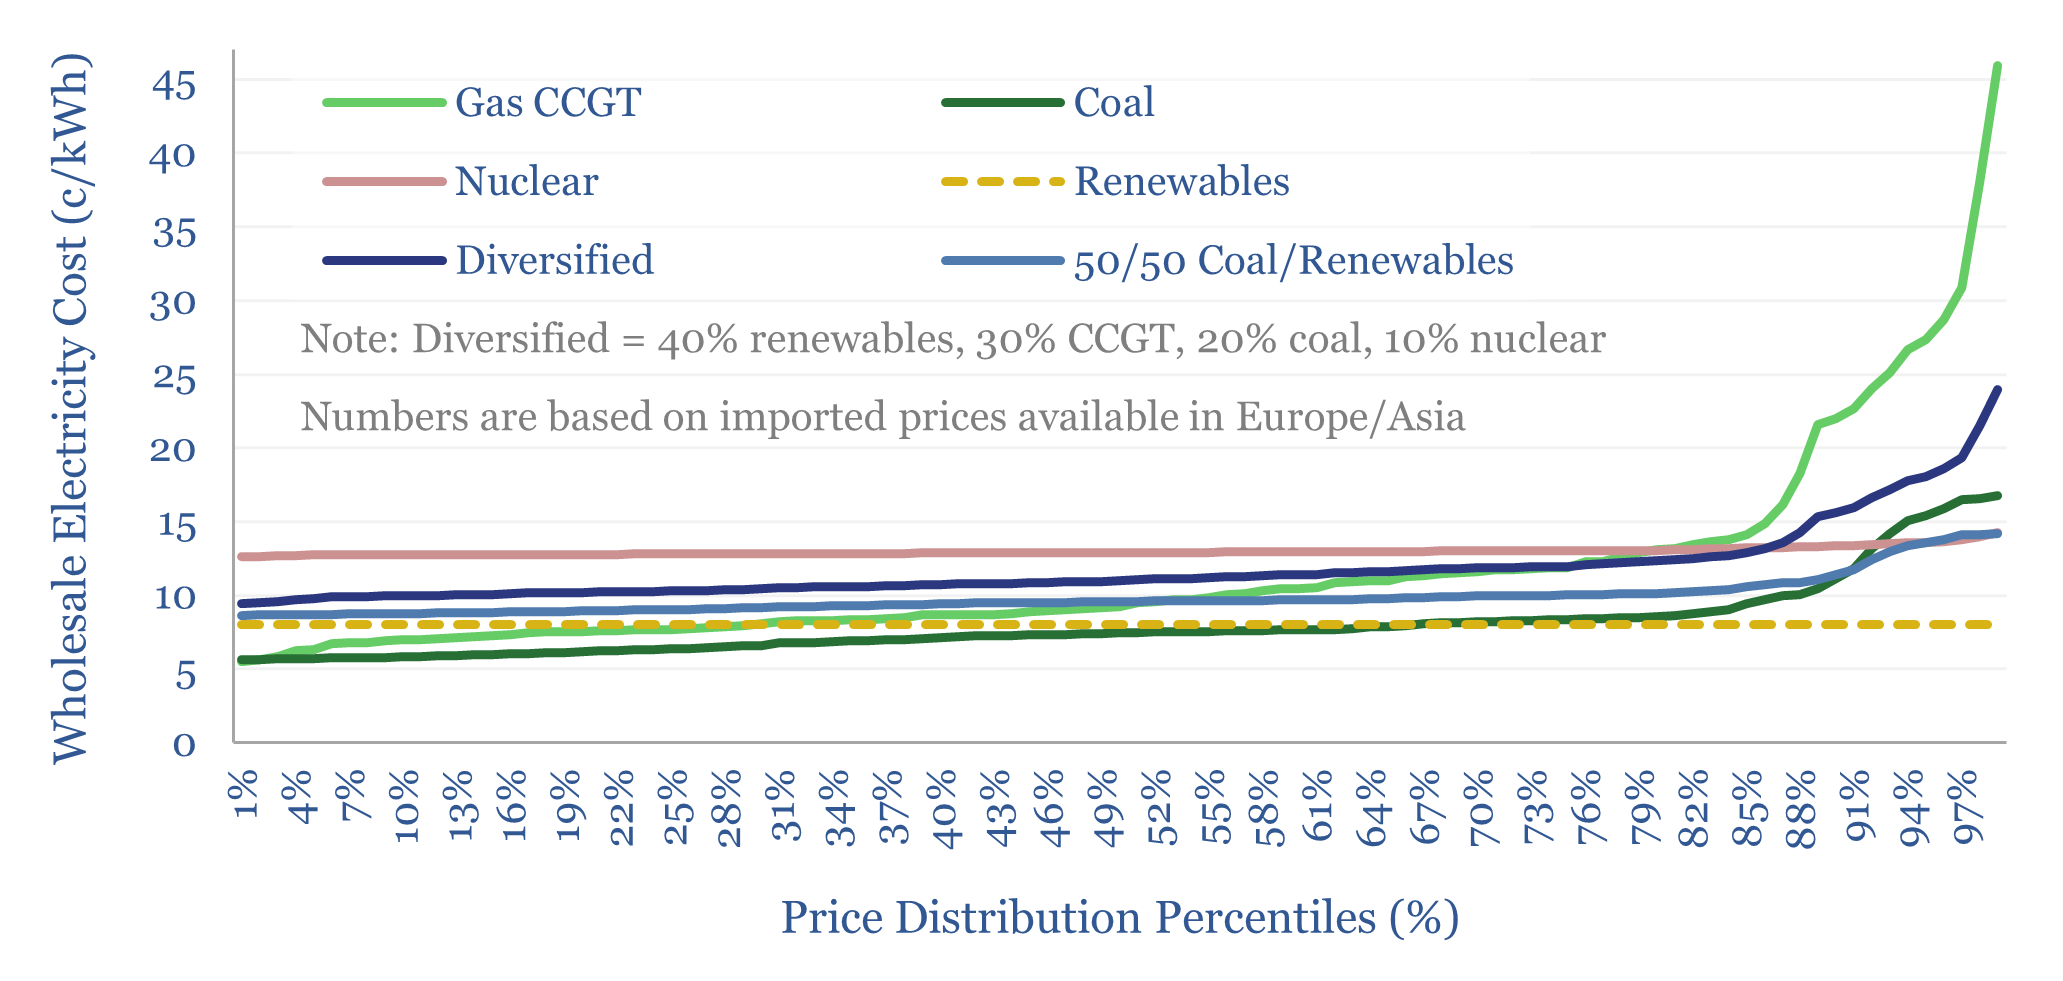
Energy importing countries value stable electricity prices. Hence this 18-page report evaluates the optimal grid mix, after taking stability into account? Recent gas price volatility will encourage further diversification for developed world importers, while coal+solar could dominate emerging world growth. Our forecasts are revised.
Read the Report?
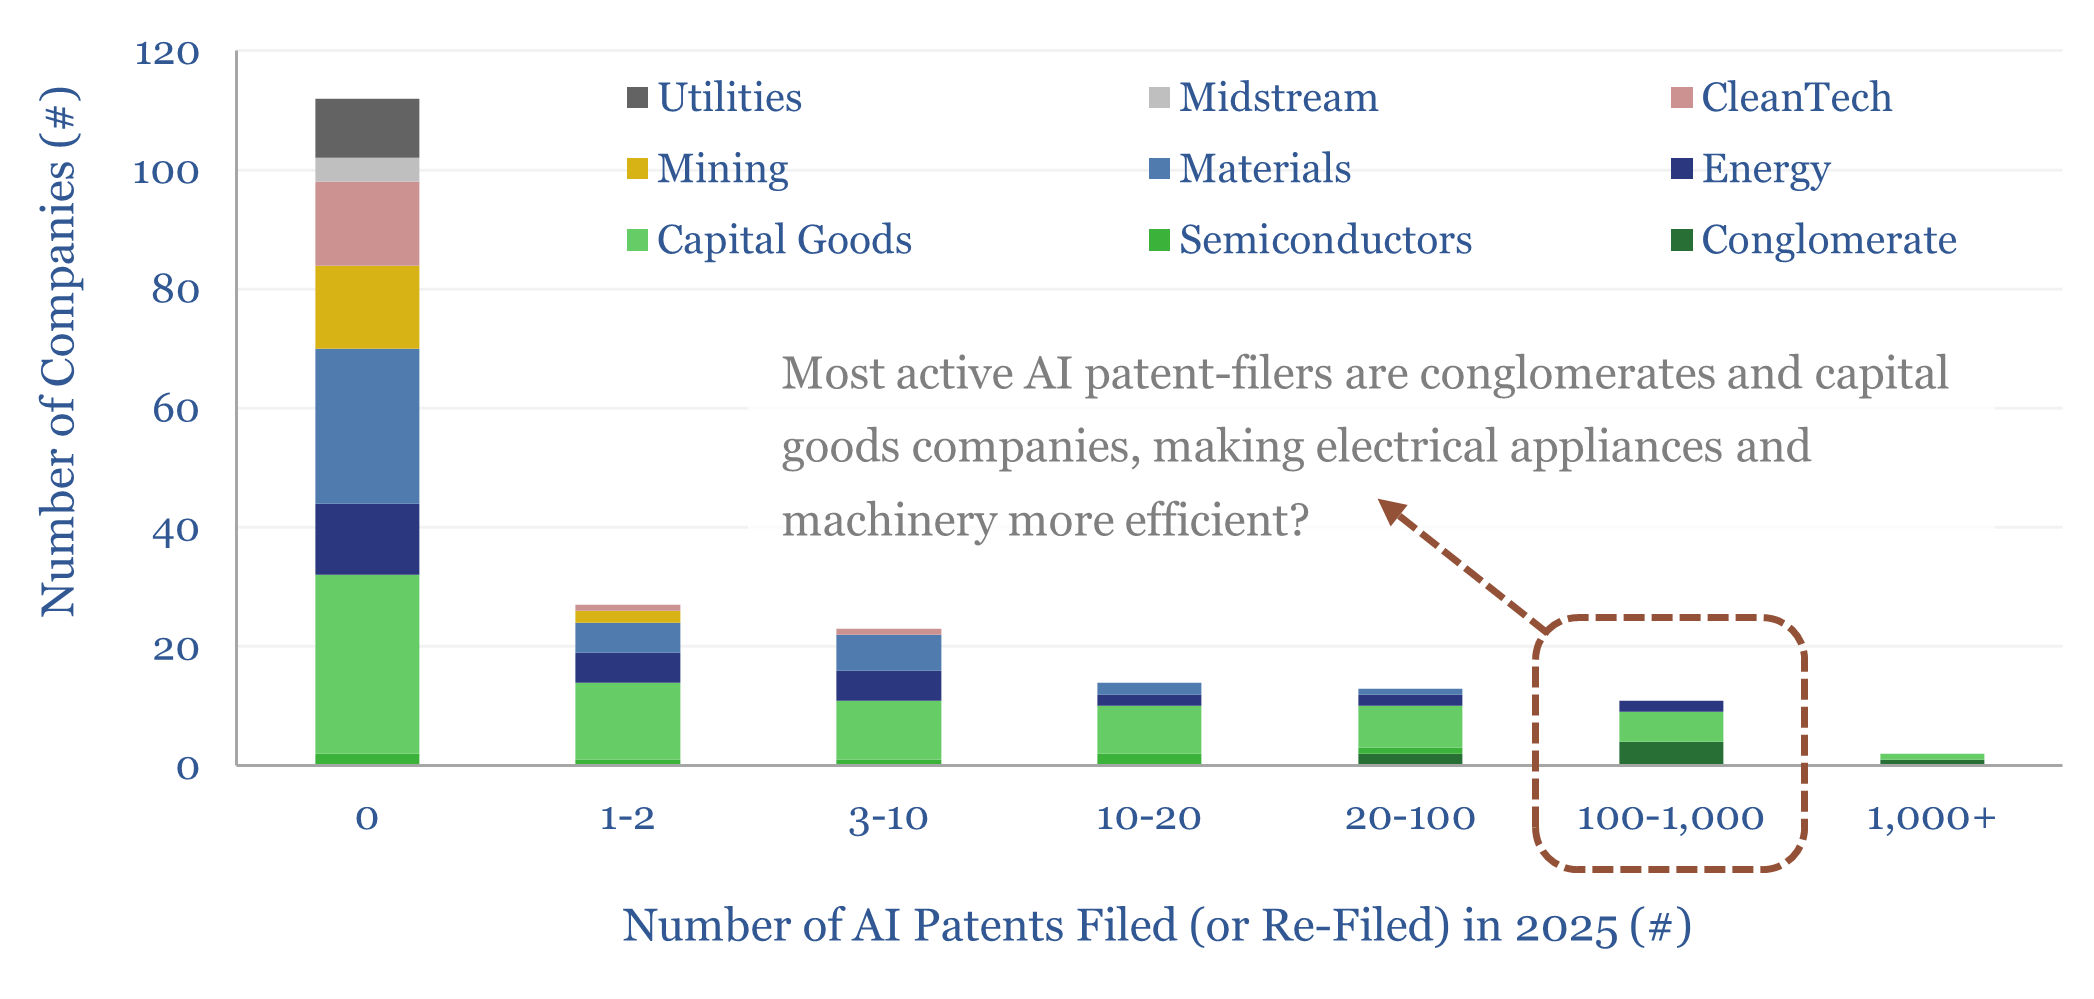
500,000 AI-related patents were filed in 2025. But electrical appliance manufacturers were particularly active. Hence we used AI ourselves, in this 14-page report, to home in on 50 key patents, which will improve efficiency and flexibility of electrical appliances using AI – in HVAC, lighting, refrigerators, TVs, etc. – which make up 50% of the grid.
Read the Report?
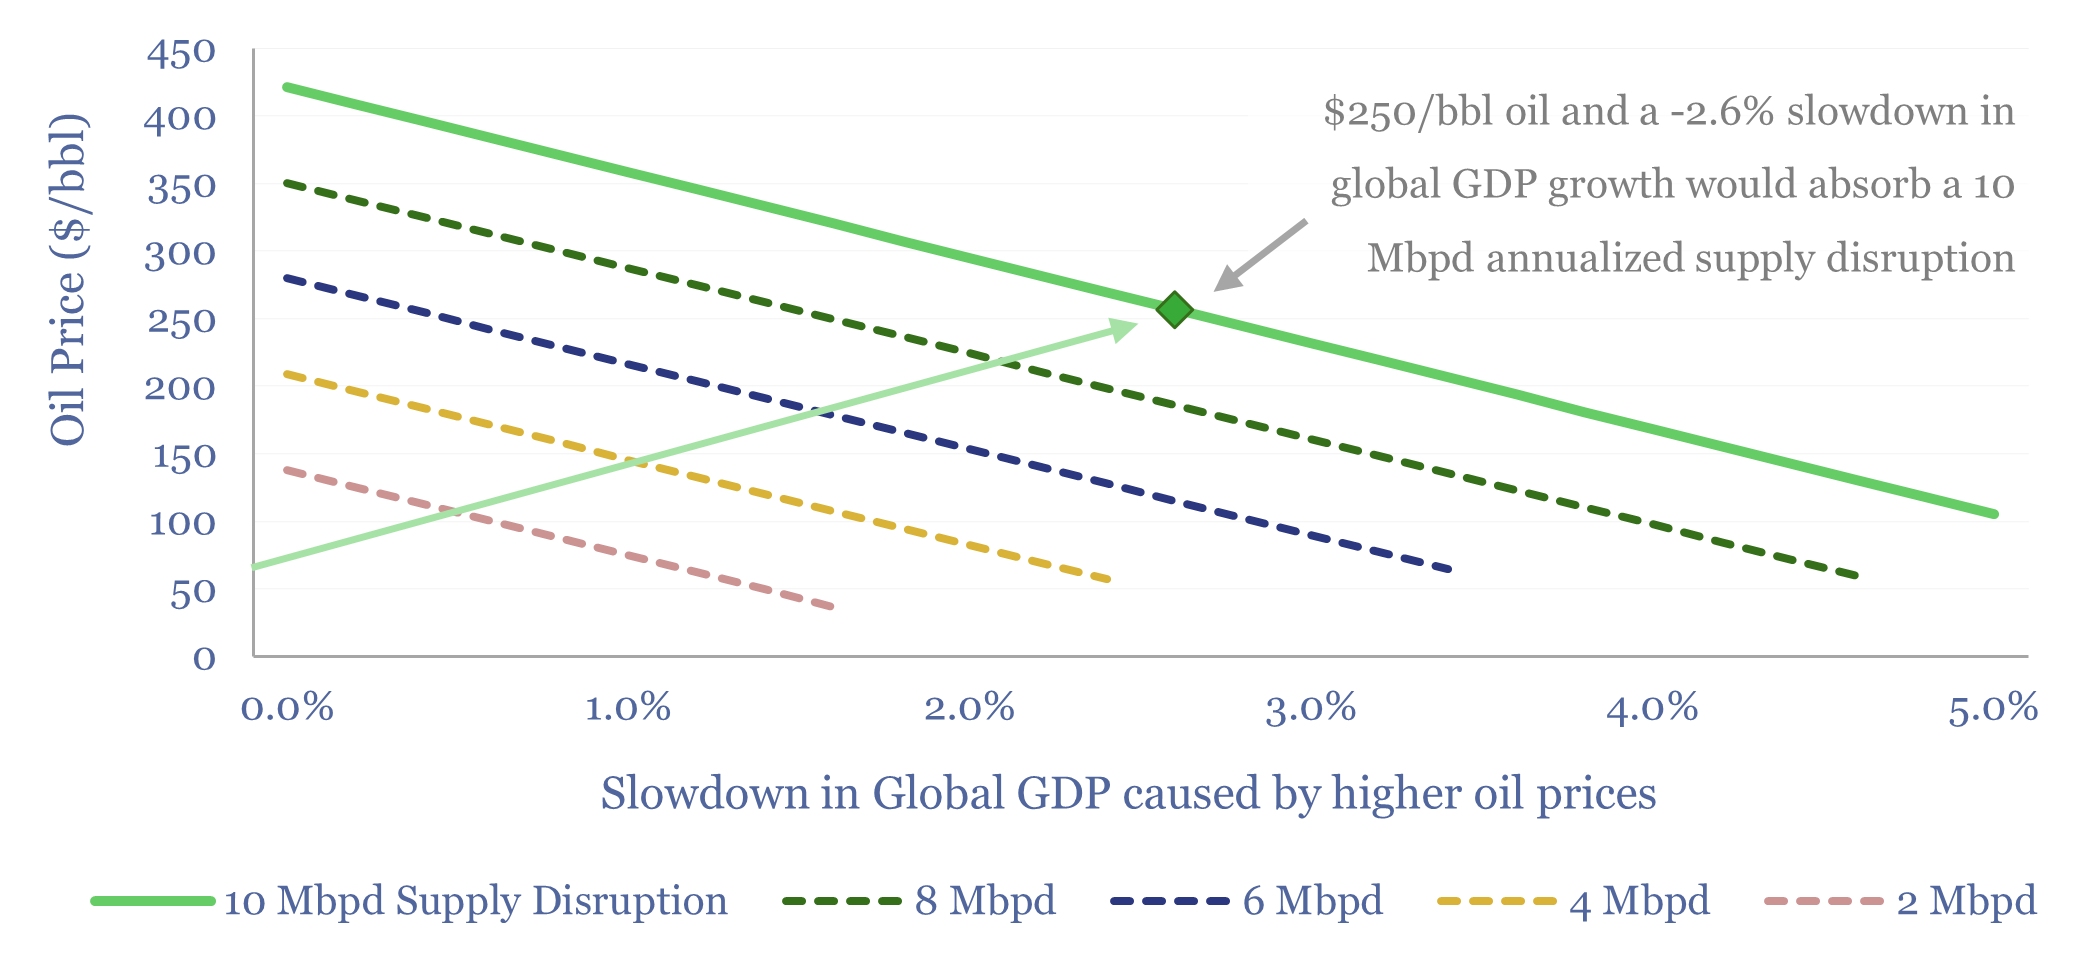
What is the price elasticity of oil demand — globally, by region, and by product? This 11-page report argues that a supply disruption of 10-20Mbpd magnitude, lasting for 6-12 months, pushes oil above $250/bbl, and also zeroes global GDP growth. Rationing and solar/EV substitution may cushion the impact.
Read the Report?
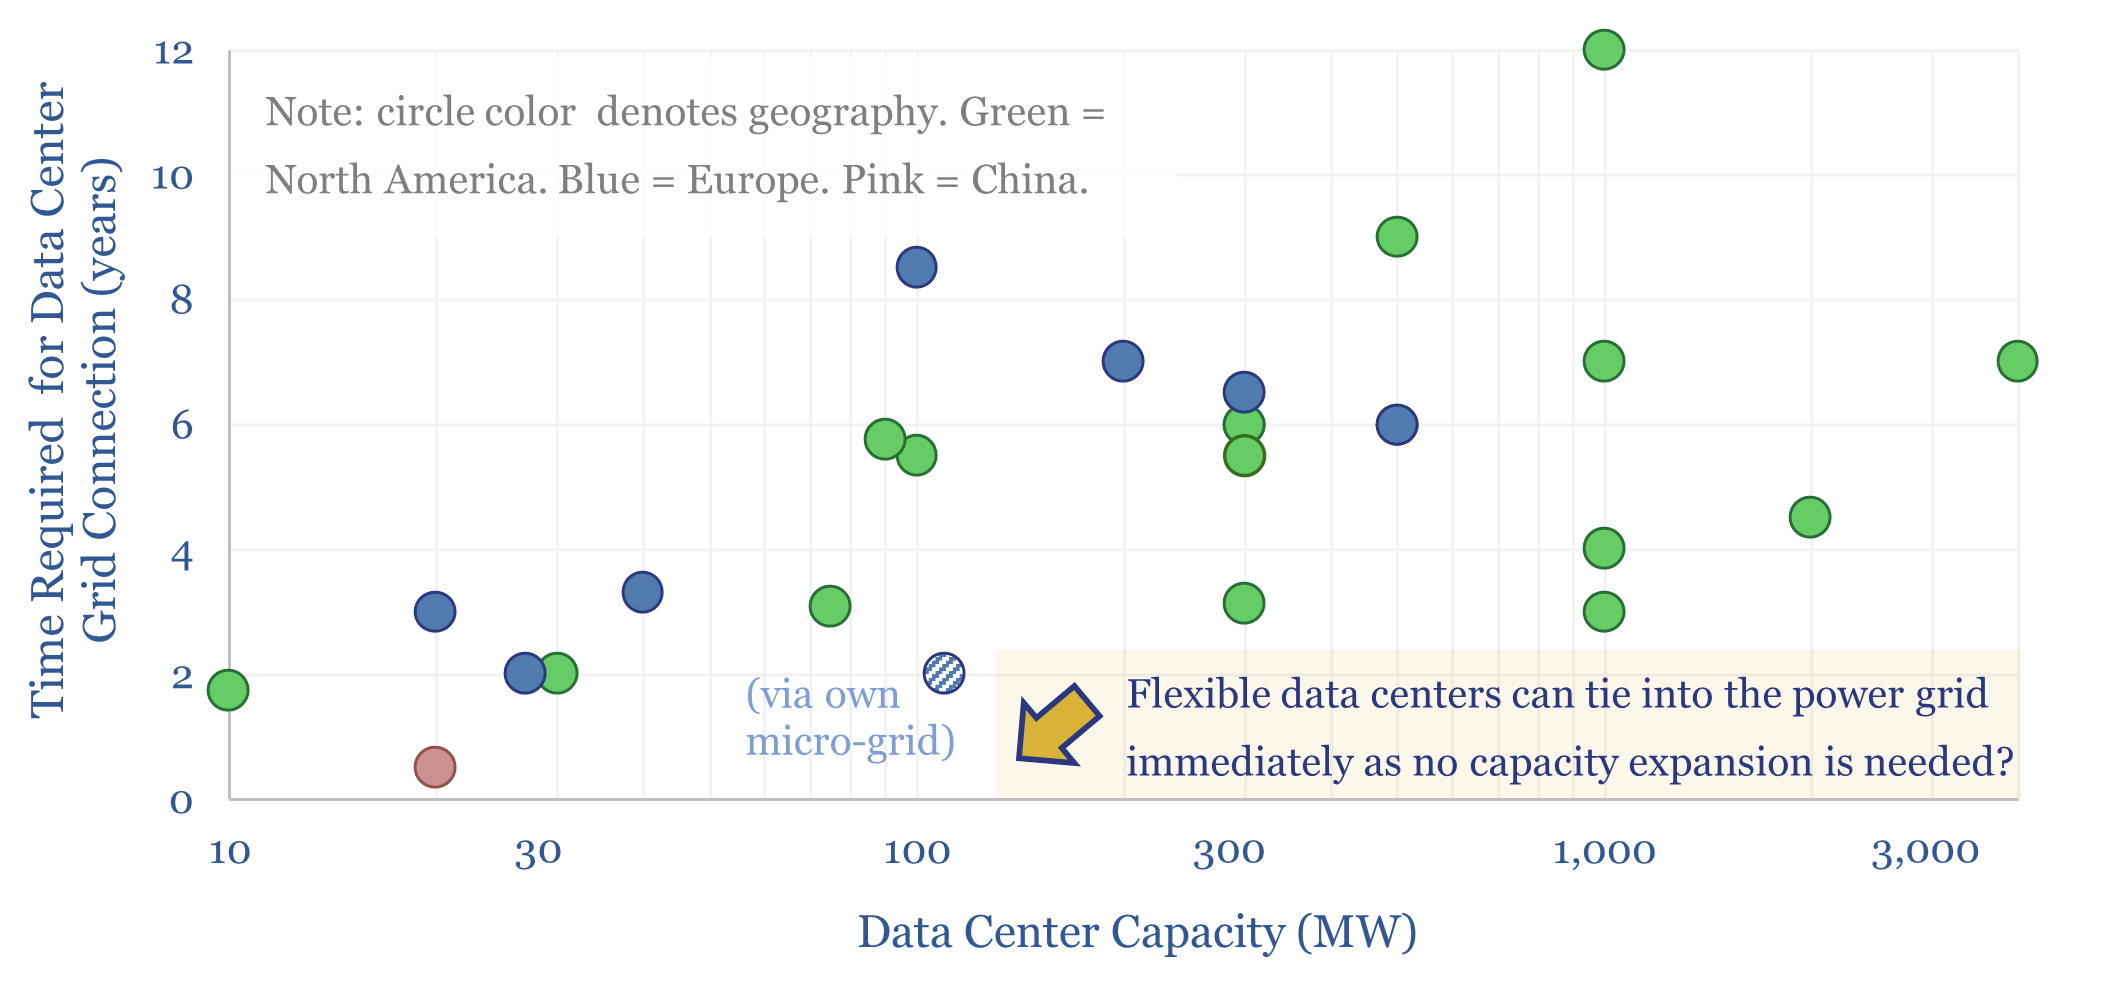
It can take 4-12 years to expand the grid and accommodate large new AI data centers. But what if more flexible data centers could be energized mostly via the pre-existing grid? This 15-page report shows how flexible AI data centers, which engage in demand shifting, are technically feasible, economically justified, and accelerating?
Read the Report?
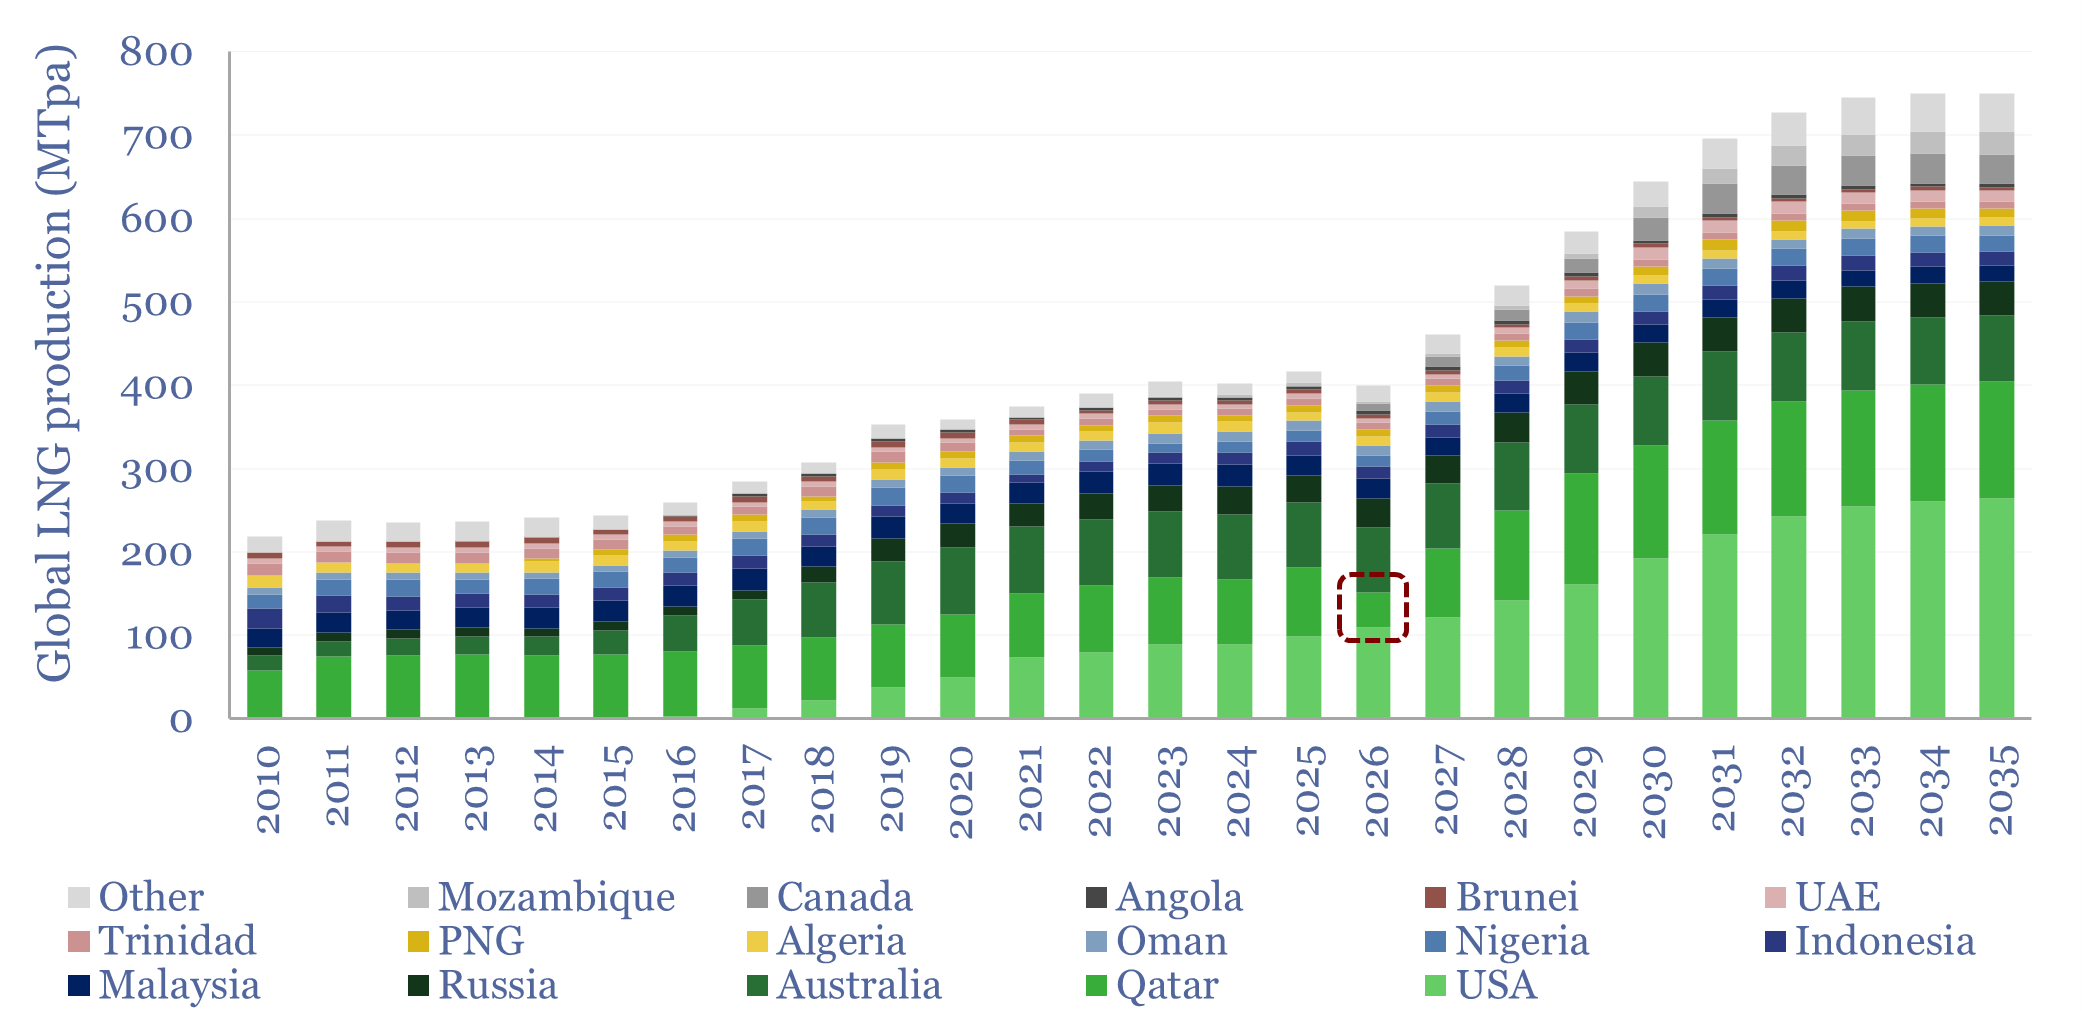
What if Qatar’s LNG output falls by -50% YoY in 2026, i.e., by -40MTpa, which is equivalent to a -0.4% reduction in useful global energy supplies? This 11-page report revisits all of our regional energy models, predicts how each Qatari LNG customer will fill the shortfall, and the implications for global energy markets.
Read the Report?
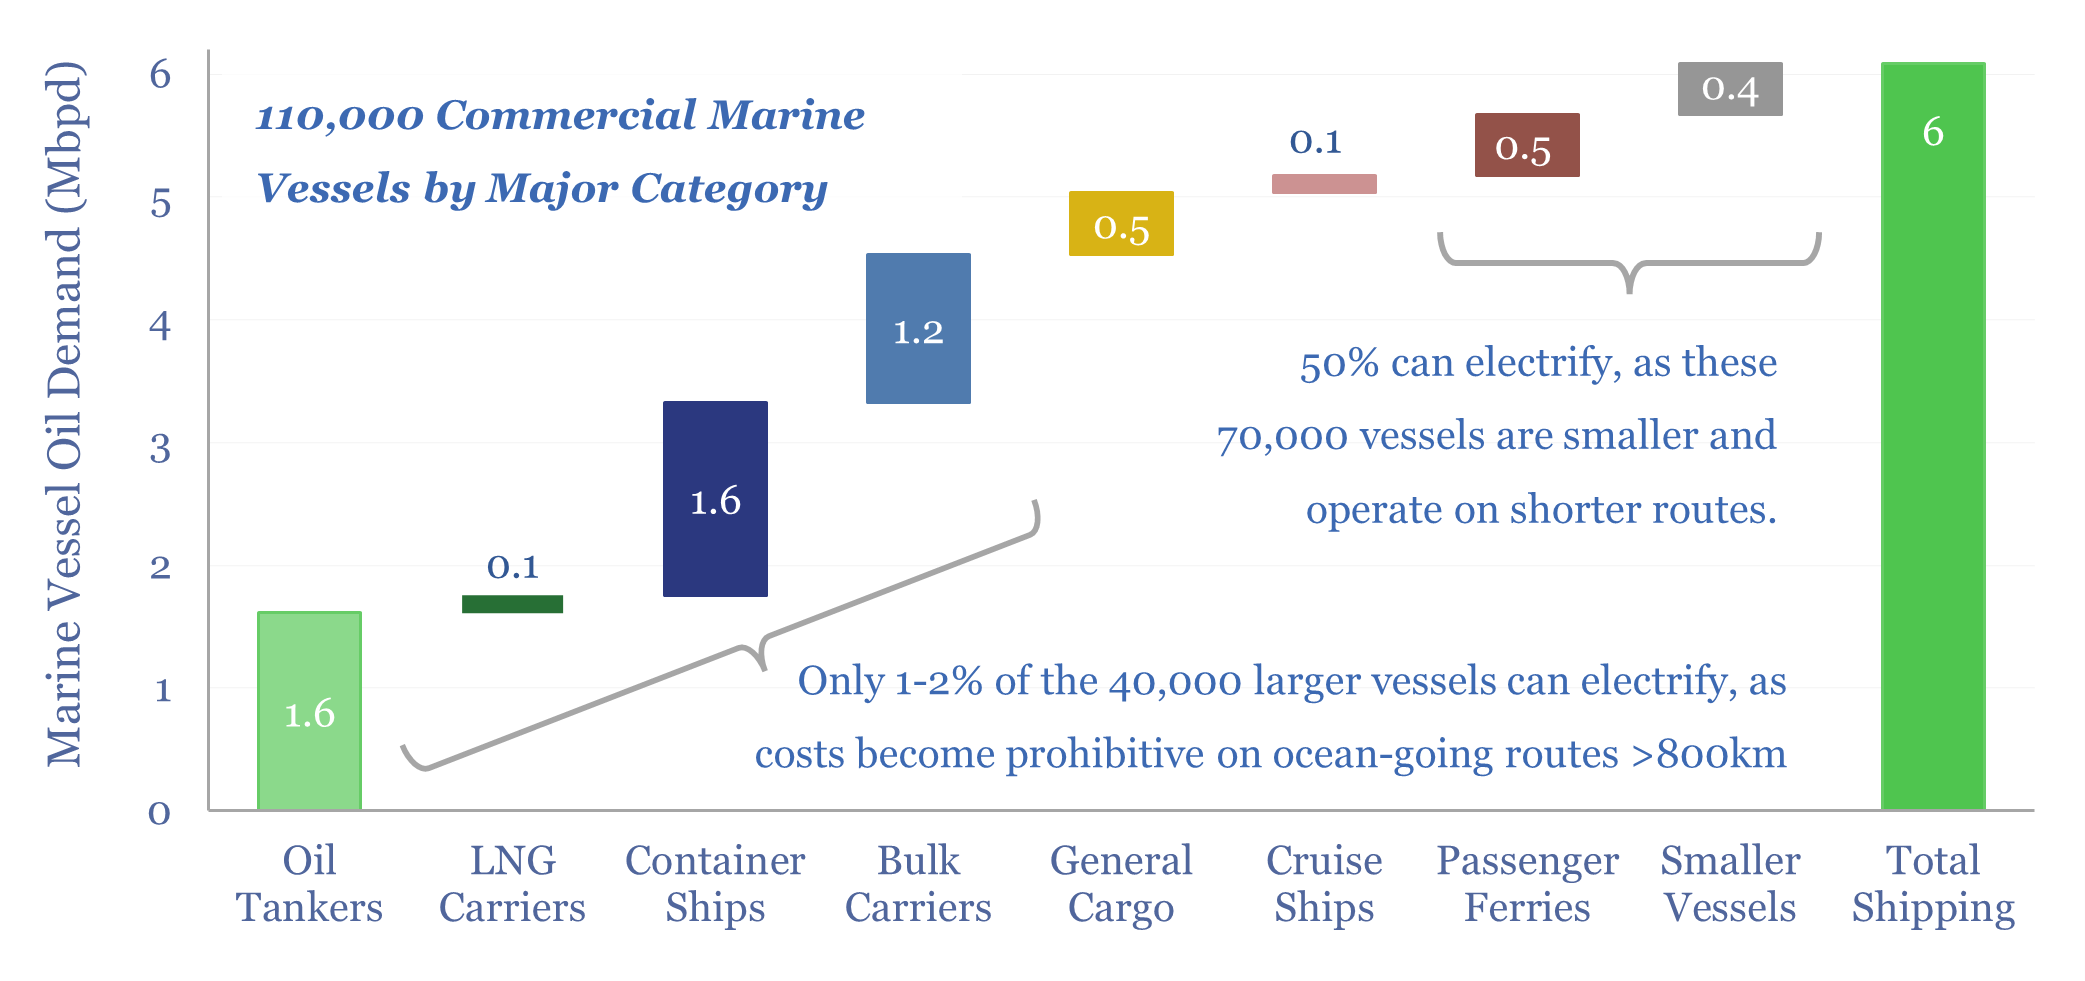
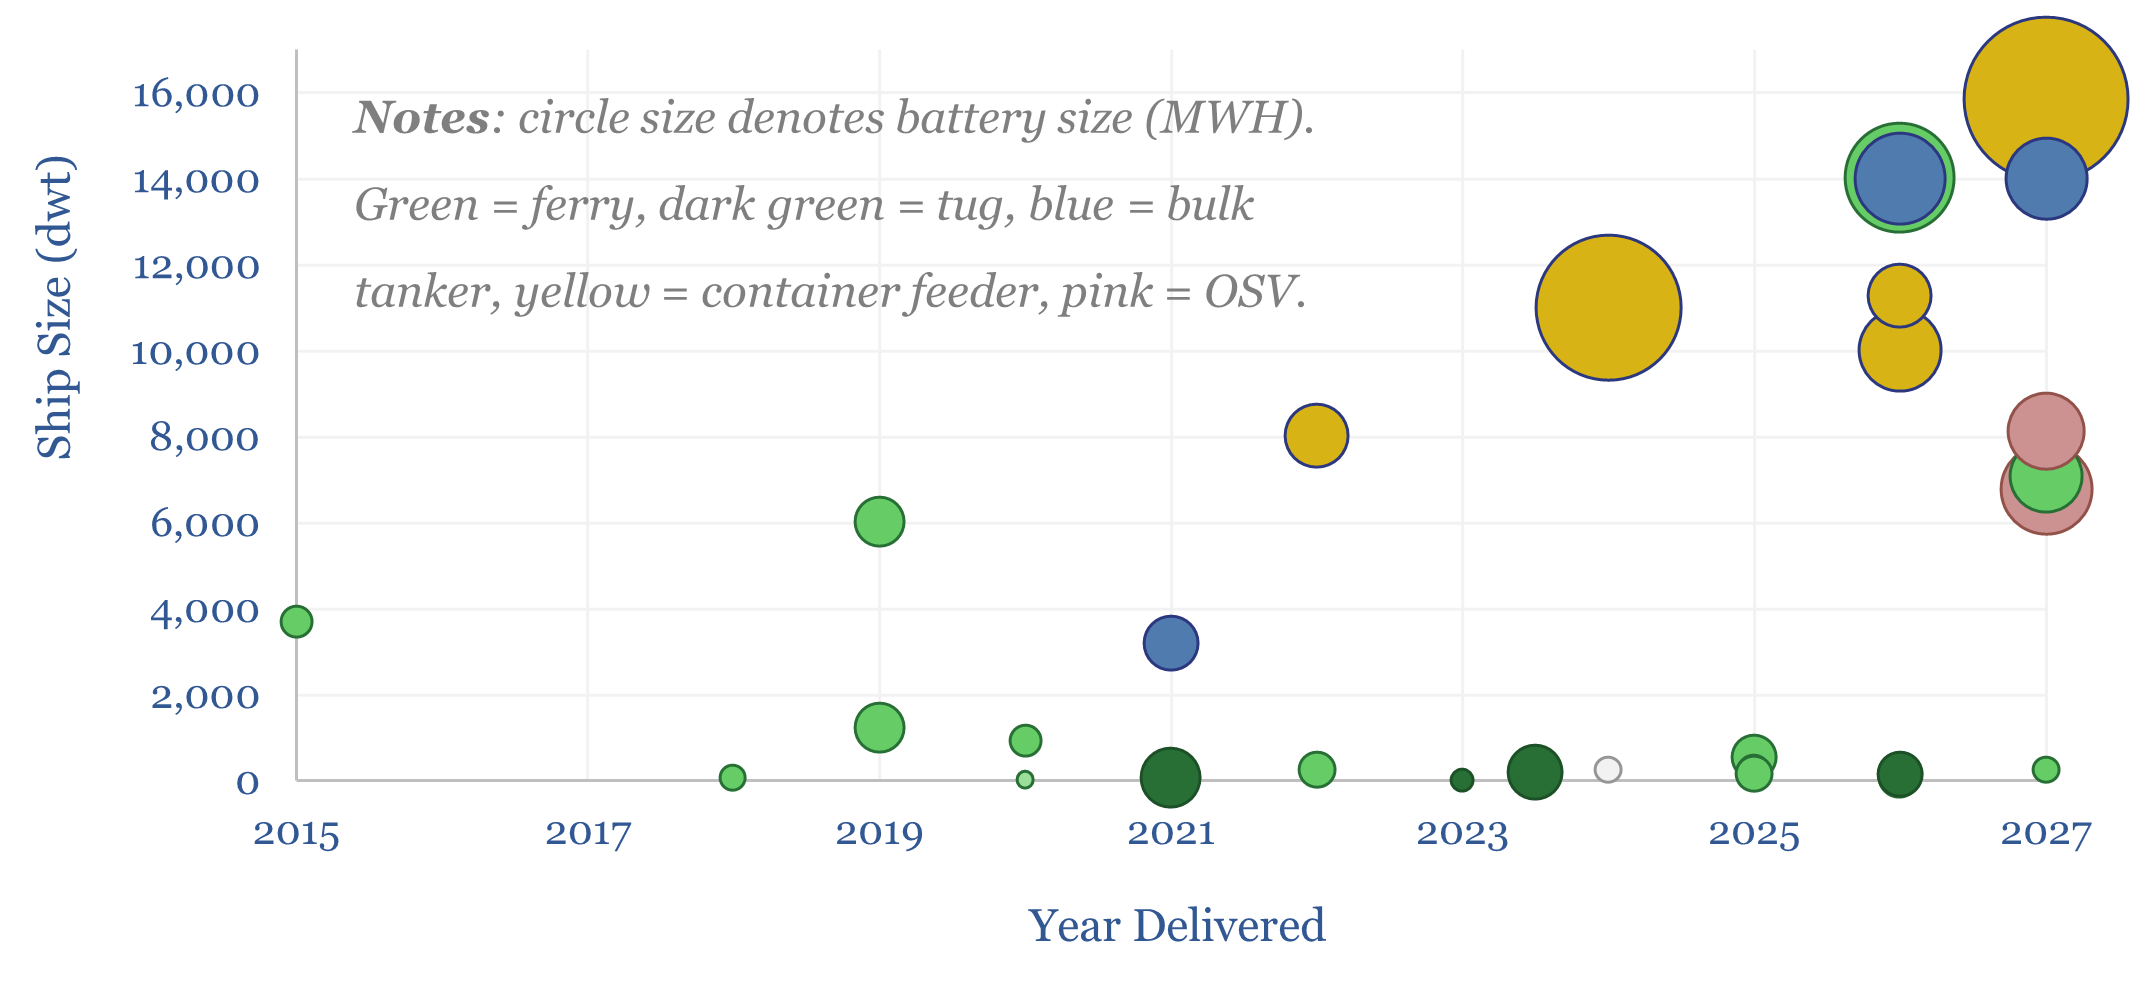
Over 15% of the world’s marine vessels could electrify in the next decade, accelerated by higher oil prices, and as Europe/Asia seek self-sufficiency. This 16-page report explores leading concepts, 30 flagship deployments to-date, the economics, and the implications for companies/commodity markets.
Read the Report?
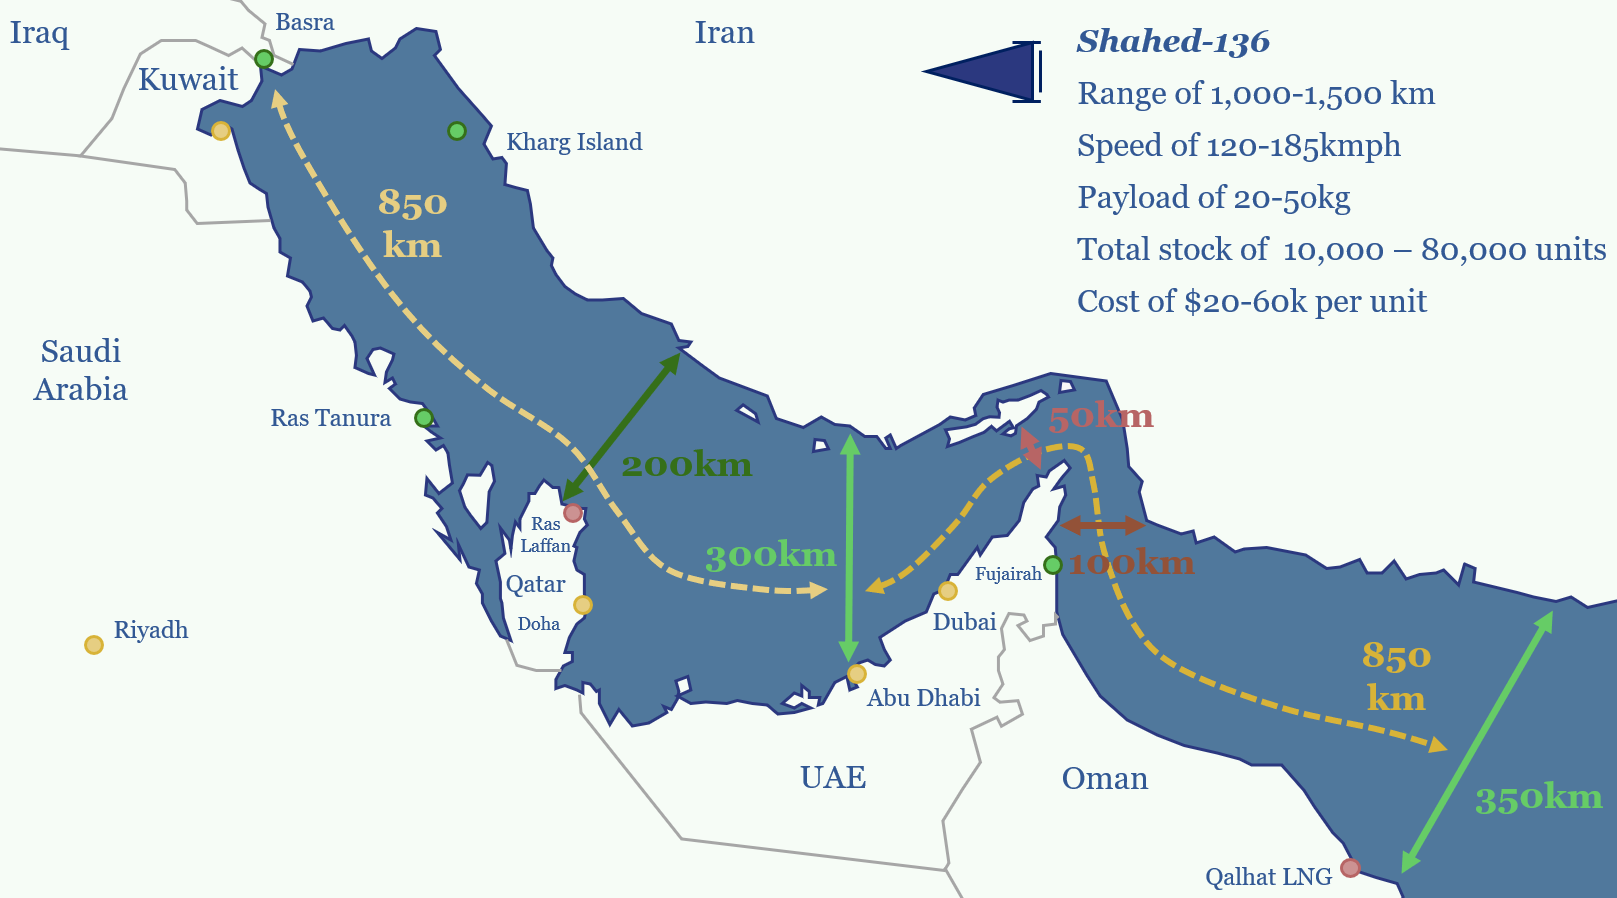
Is it possible to re-open shipping in the Strait of Hormuz, and protect broader Persian Gulf energy infrastructure, from thousands of Iranian Shahed drones? Today’s 9-page report reviews Shahed drones, counter-Unmanned Aerial Systems (cUAS), and implications across global energy markets.
Read the Report?
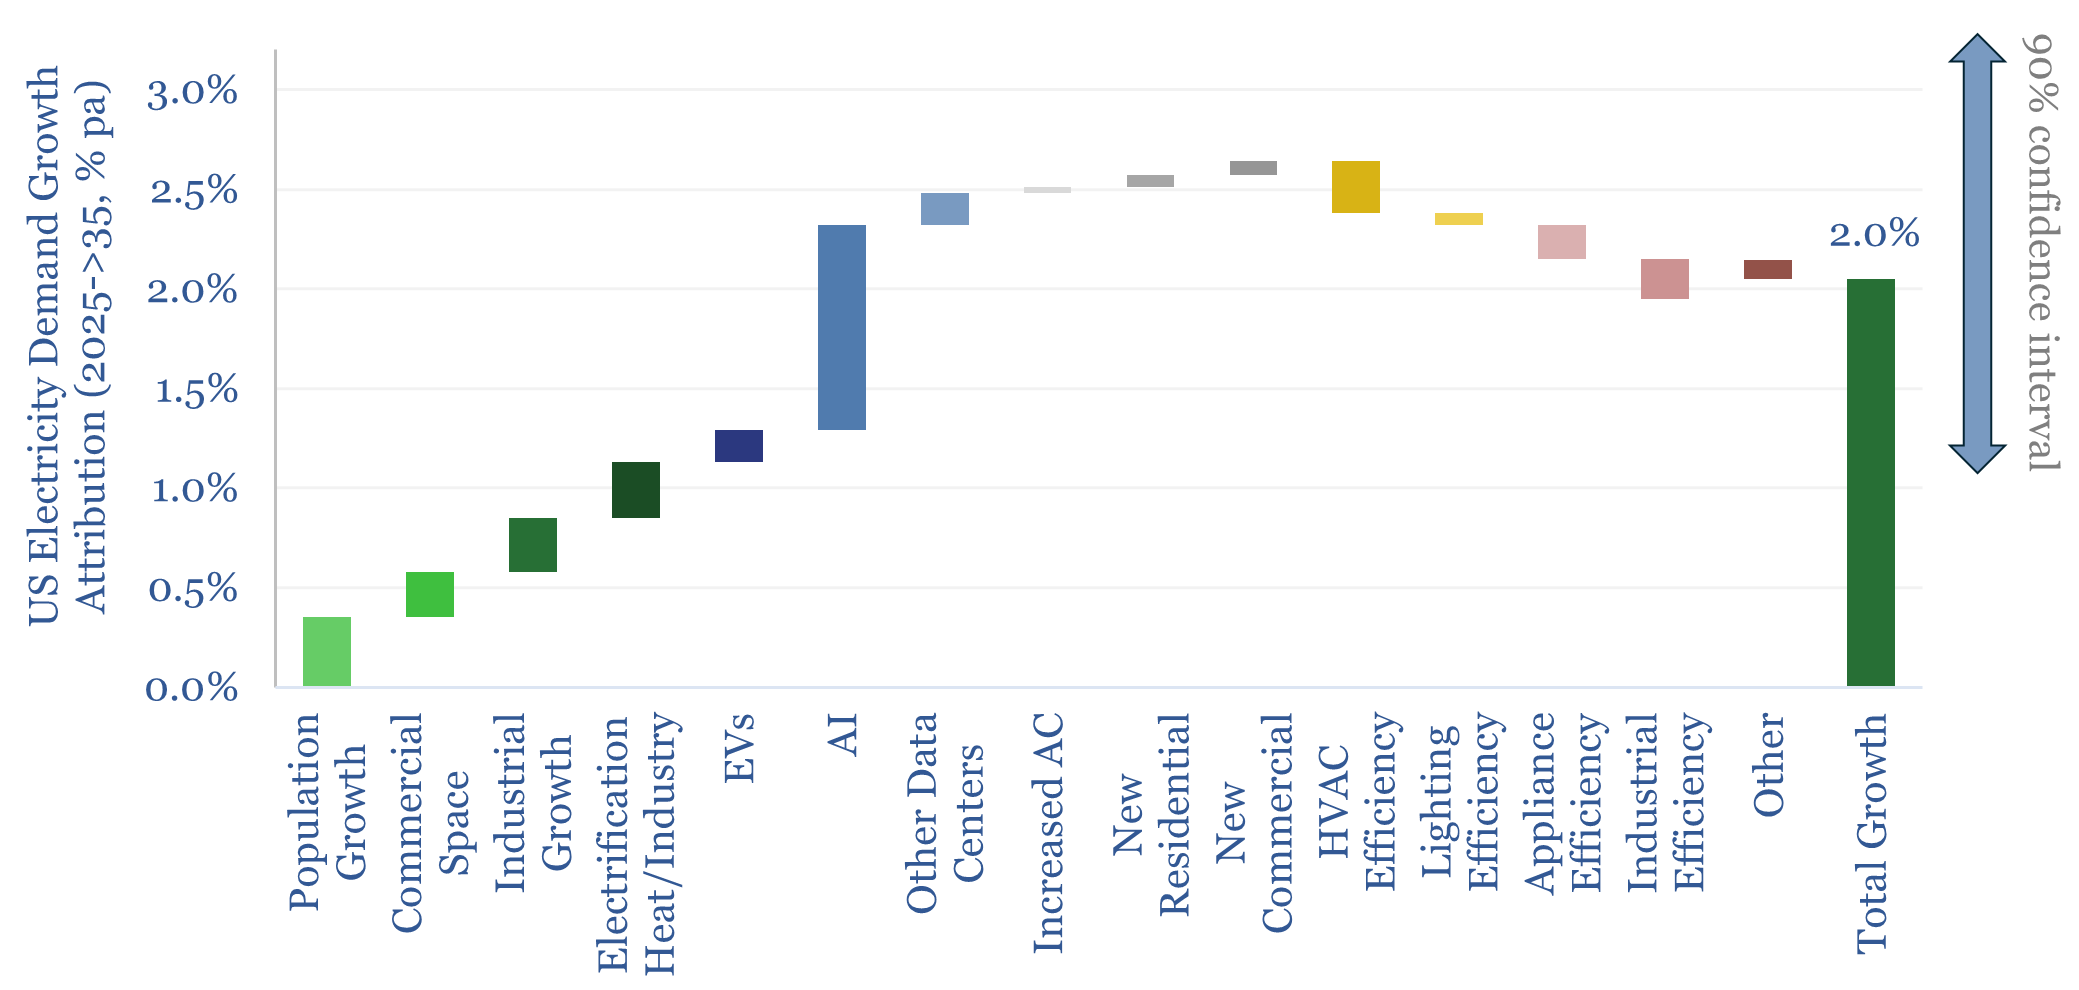
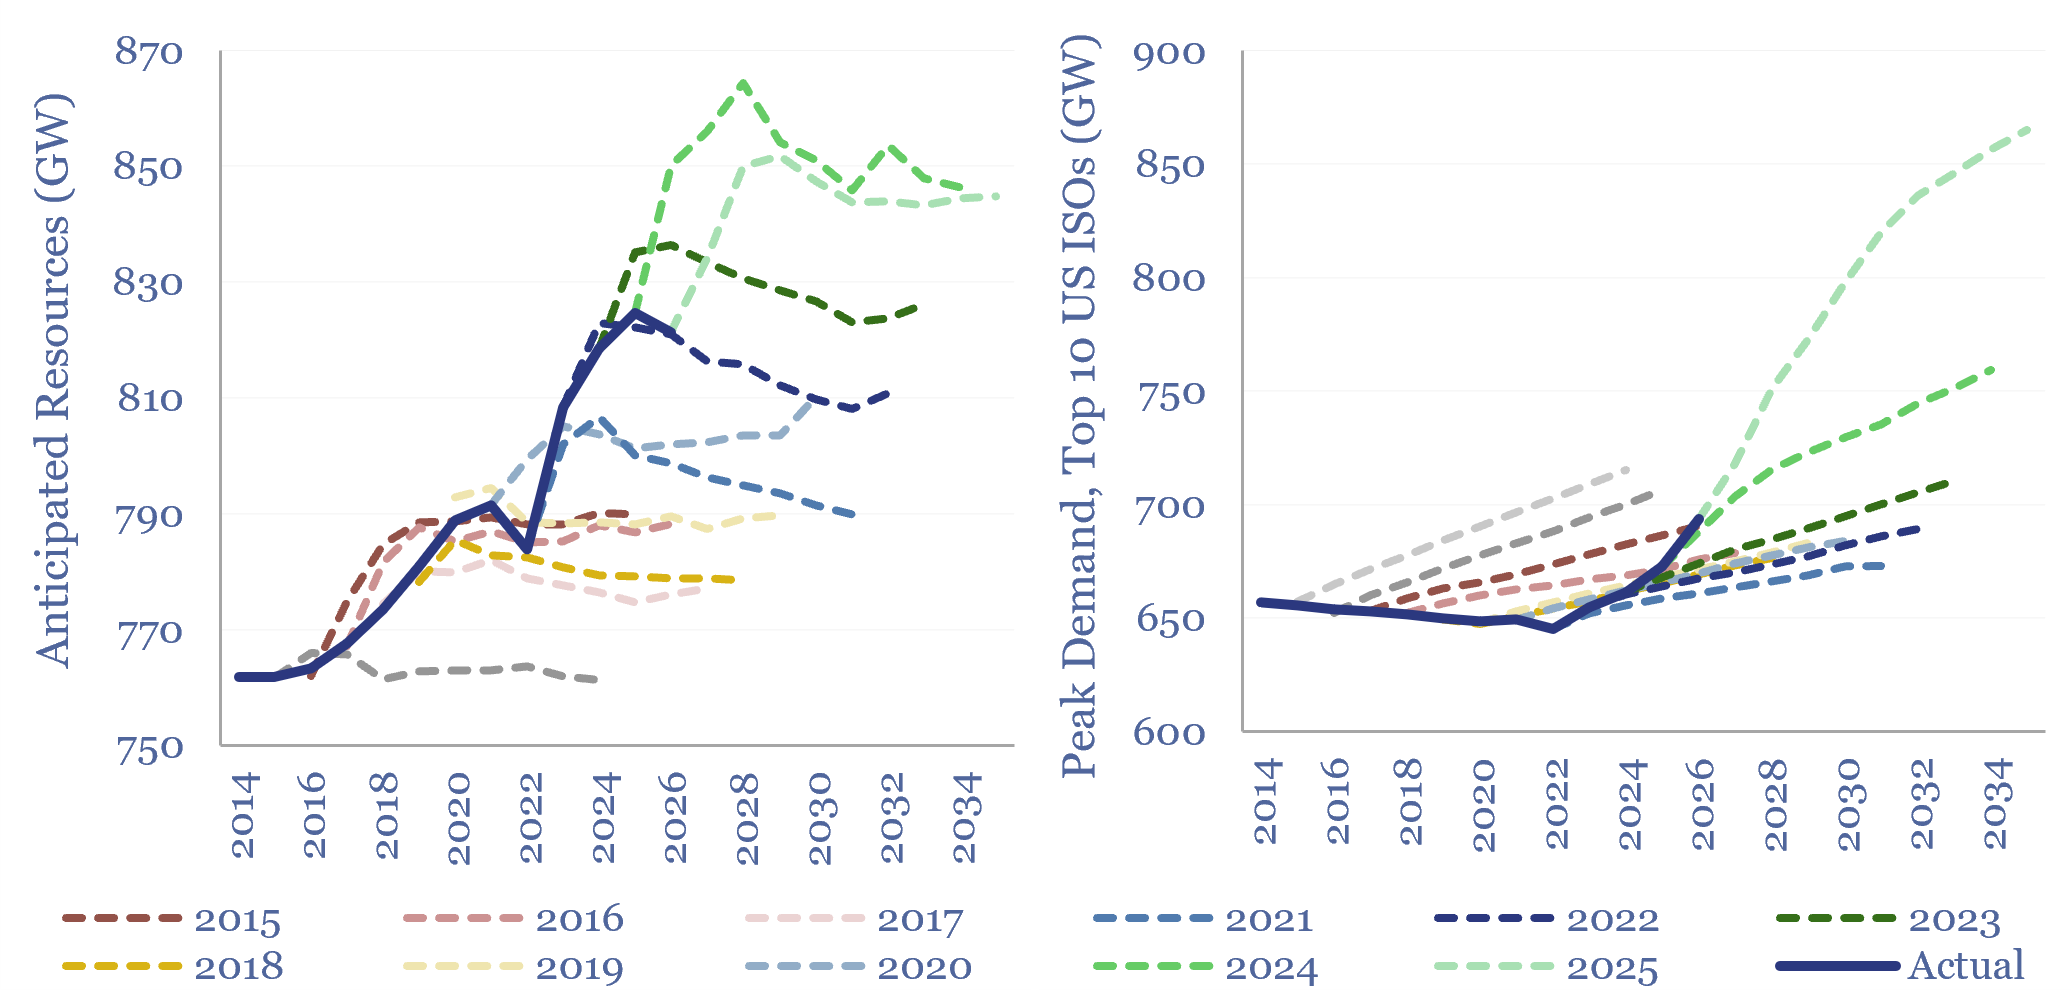
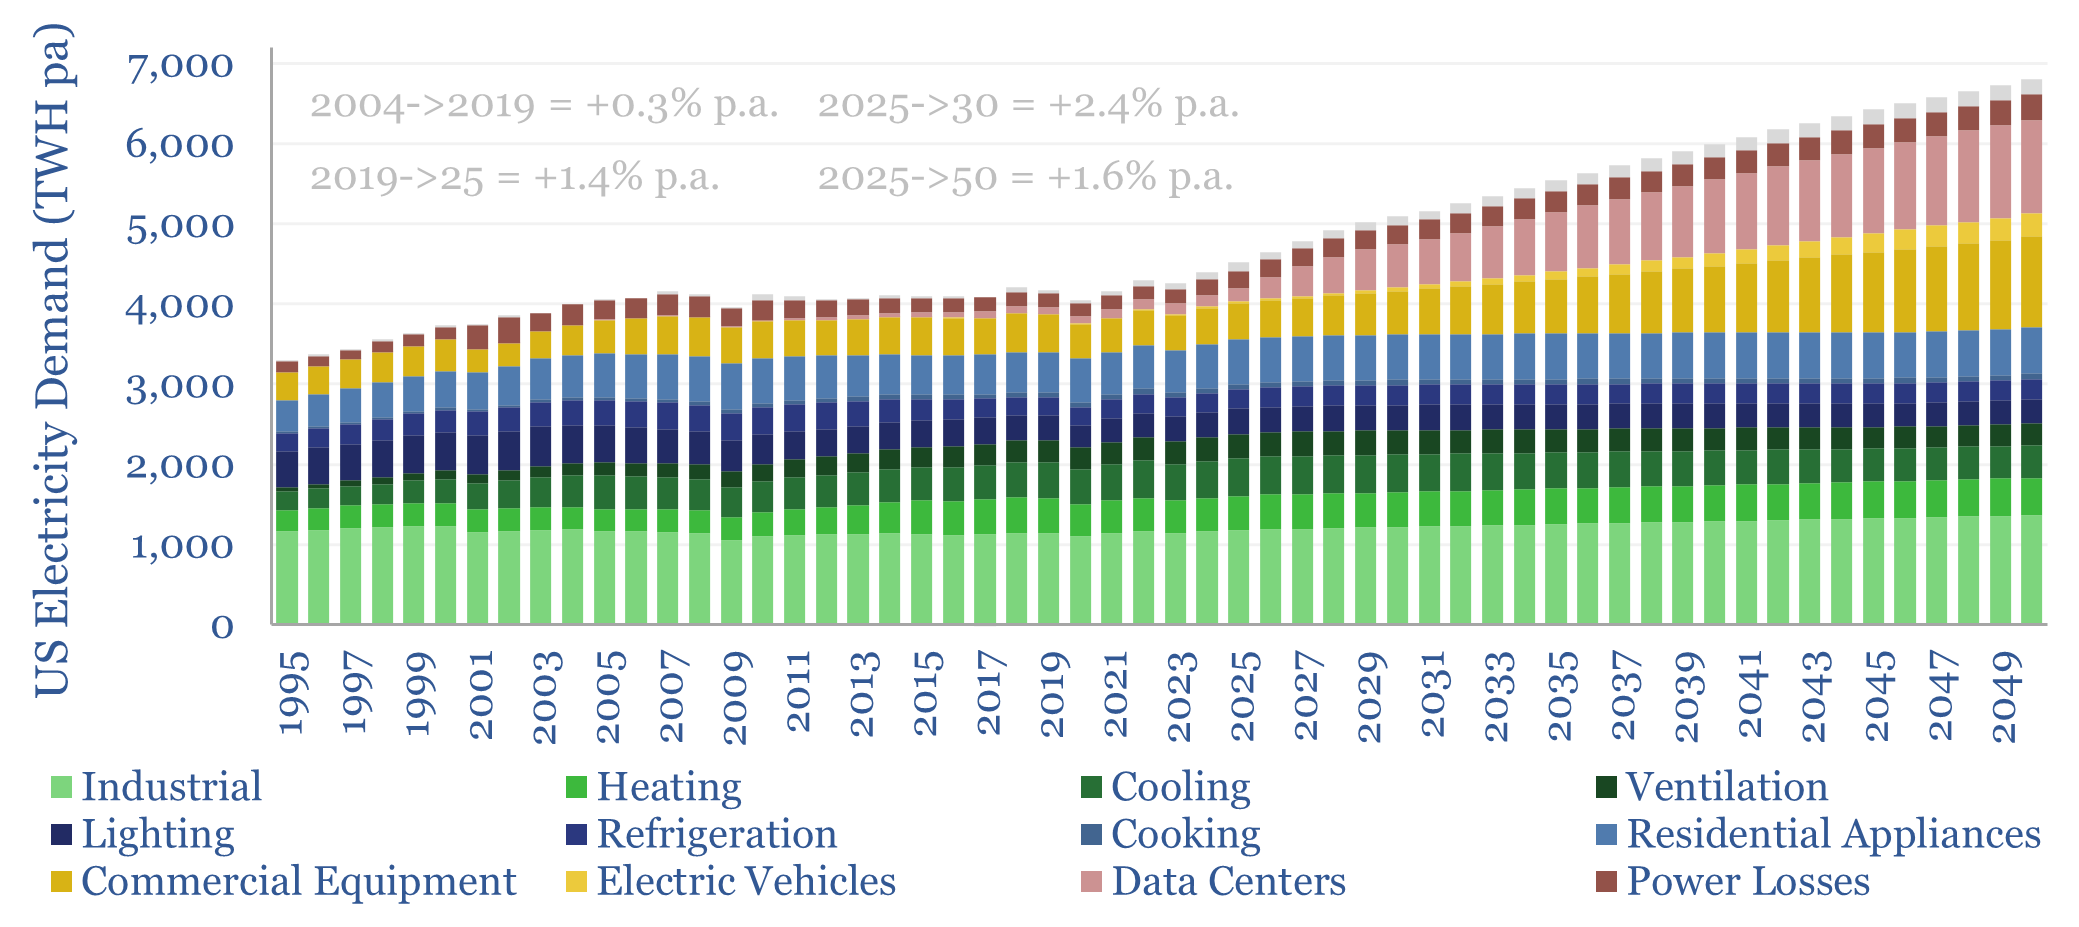
US electricity demand growth is a crucial debate. It affects everything. To bound the uncertainty, we assessed twenty input variables, and ran a Monte Carlo, in this 16-page report. Our new base case sees +2.0% pa demand growth to 2035. Our 90% confidence interval is 1-3% pa. What implications for gas and power?
Read the Report?
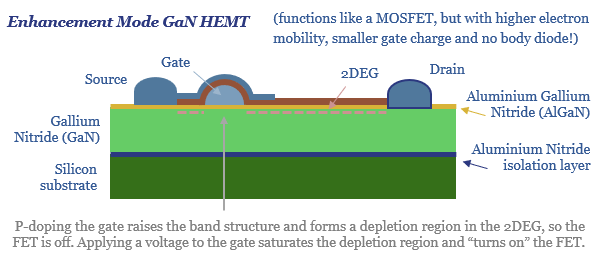
Gallium Nitride (GaN) is a remarkable semiconductor. GaN forms a 2-Dimension Electron Gas (2DEG), with exceptional electron mobility, which supports high switching frequency, improved power quality, 50-70% lower losses and 50-70% smaller devices. It is thus a crucial enabler for large AI racks. This 13-page report reviews the technology, device costs, and future market drivers.
Read the Report?
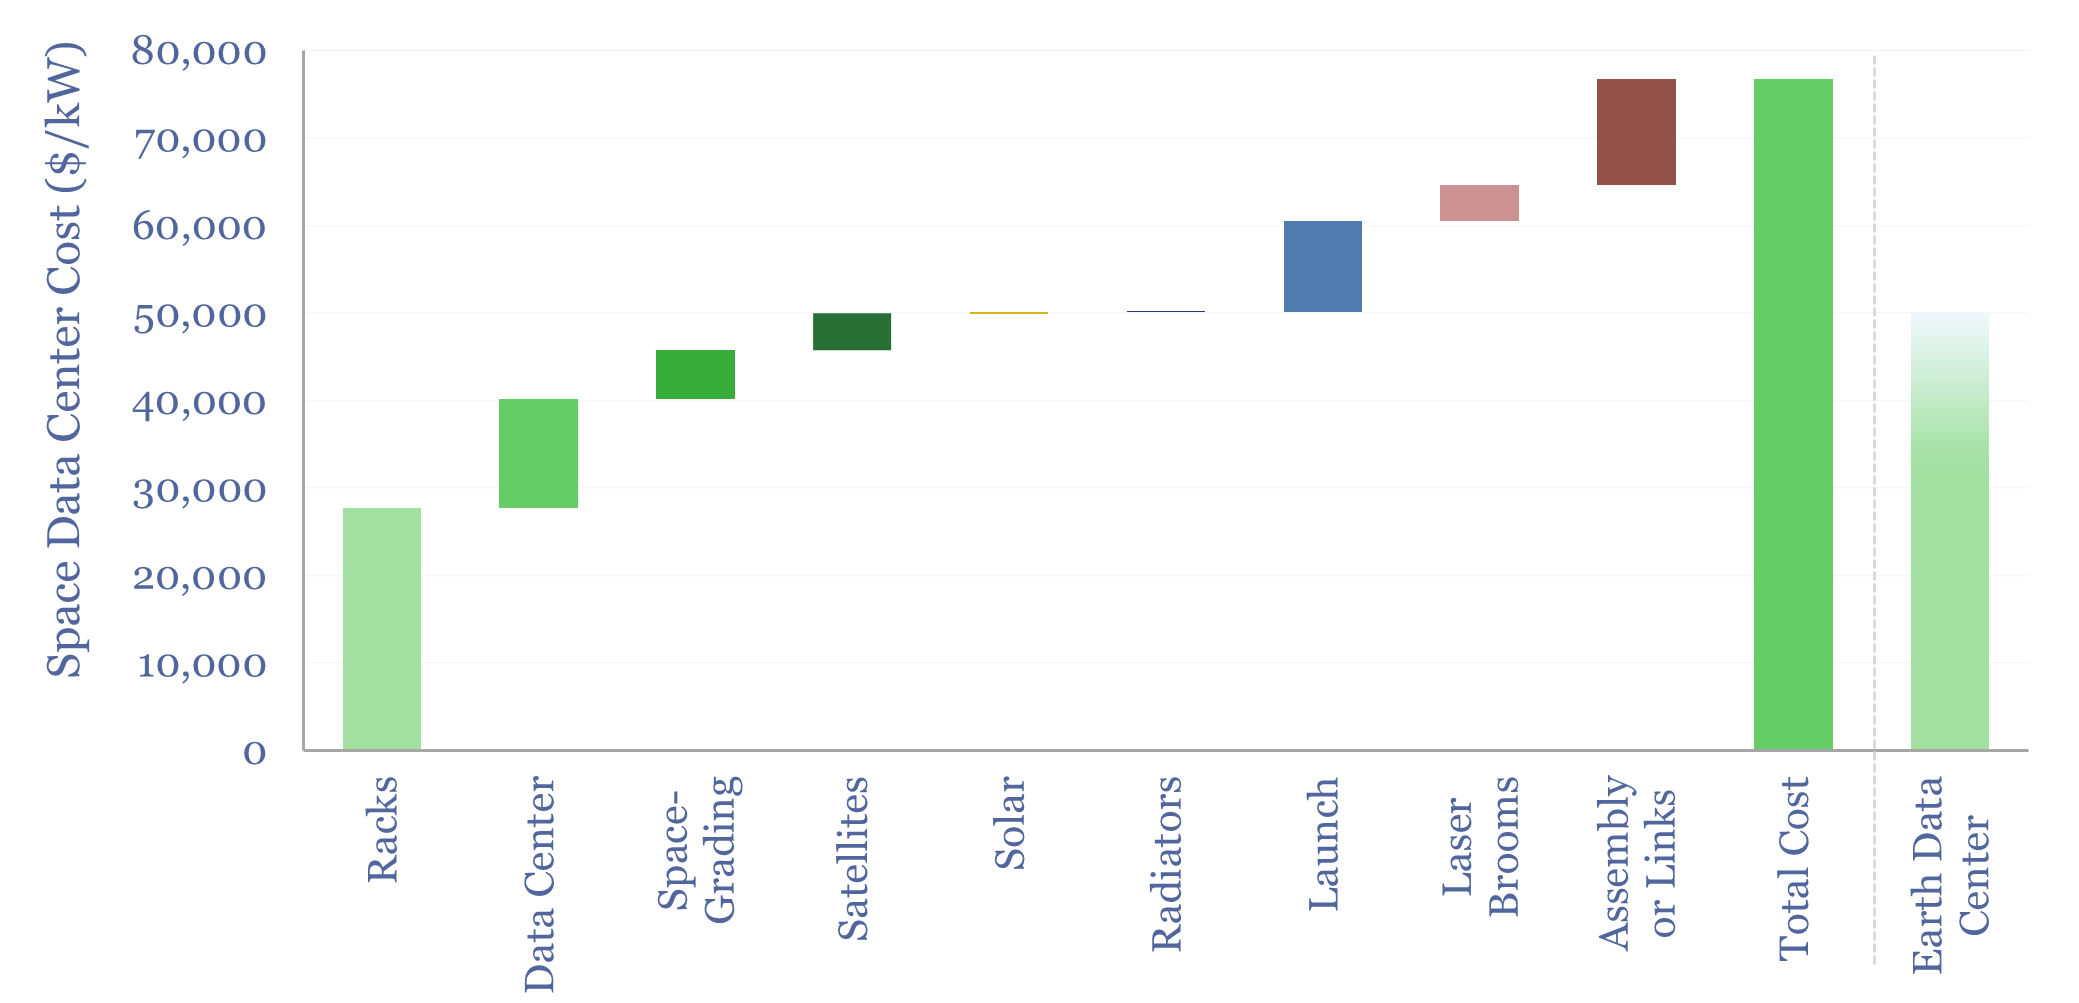
Data centers in space are a cool science fiction concept. This 17-page report explores how they would work. We think the costs will be 2x higher than Earth-based AI data centers. Amidst many logistical challenges, the biggest potential show-stopper is space debris, given the size of the structures, especially their solar arrays.
Read the Report?
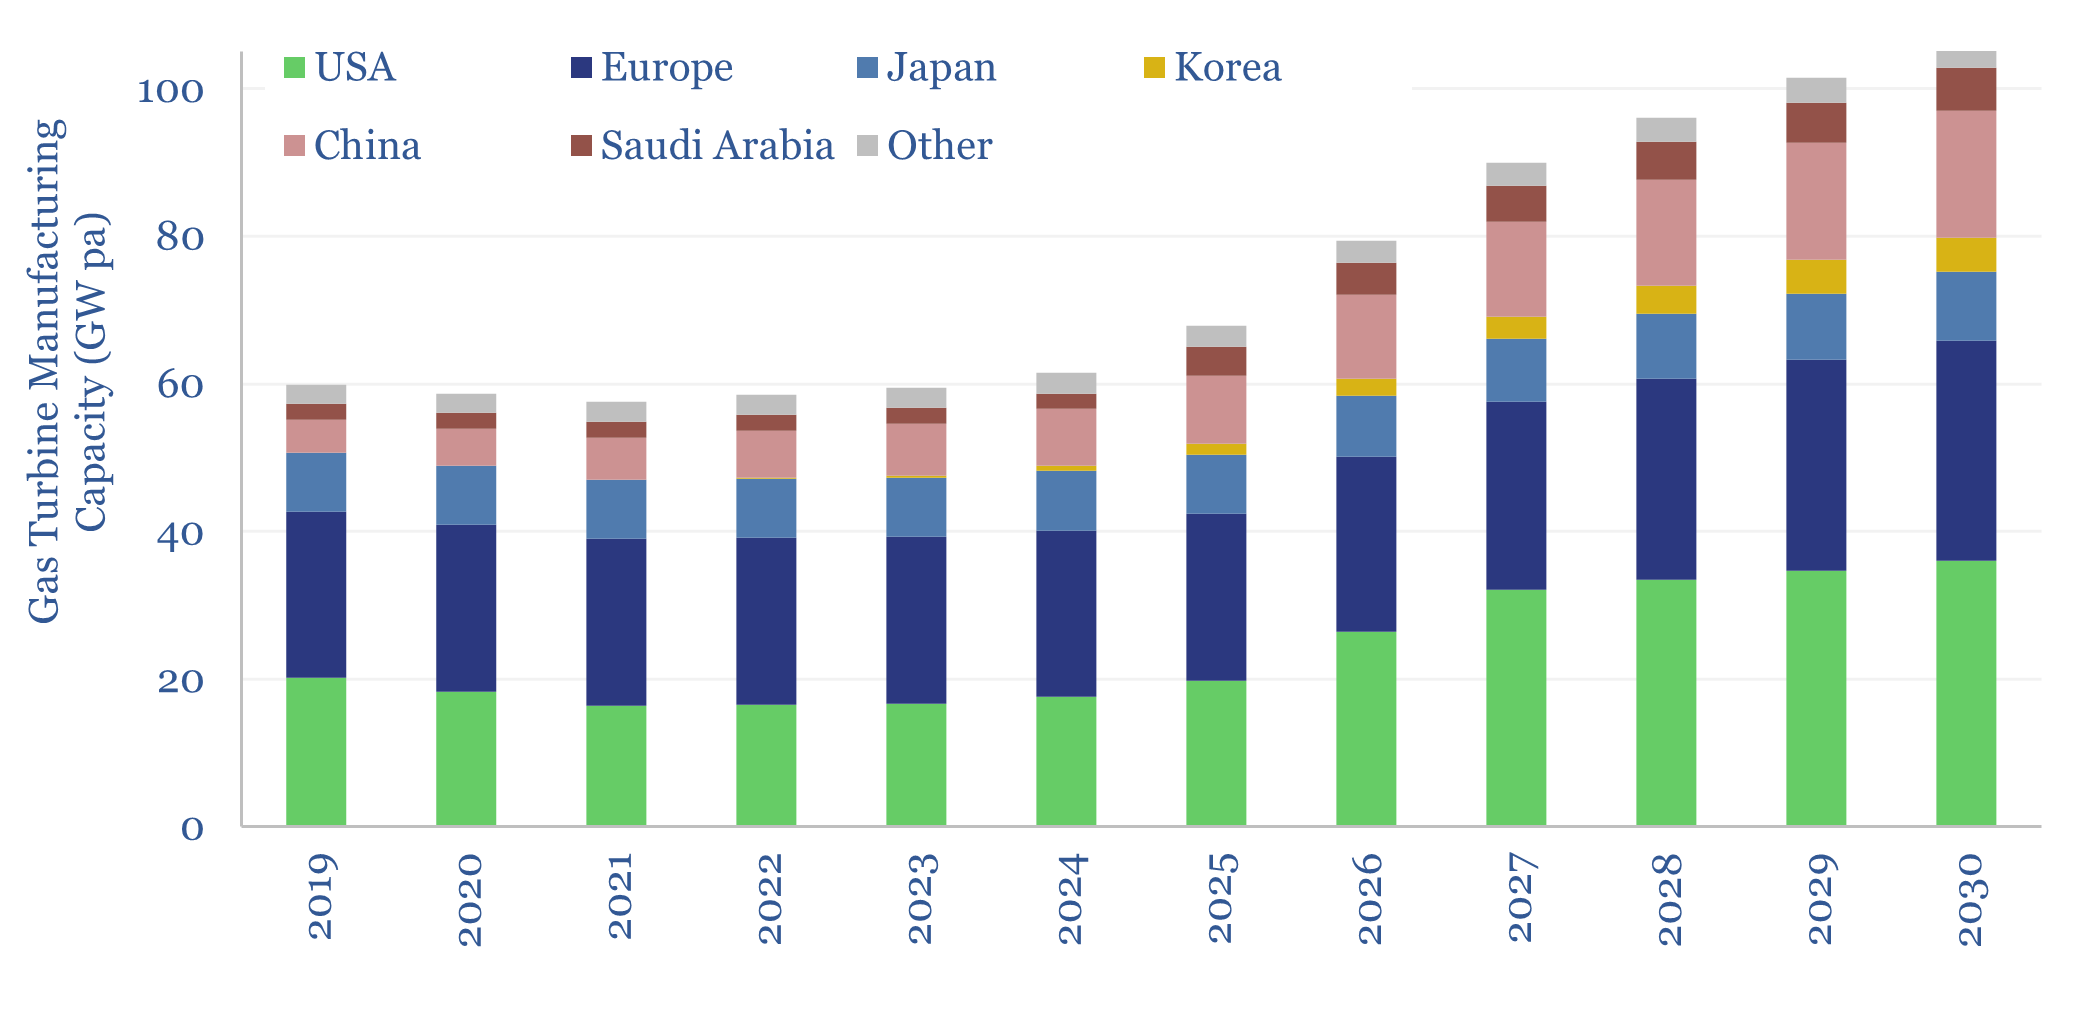
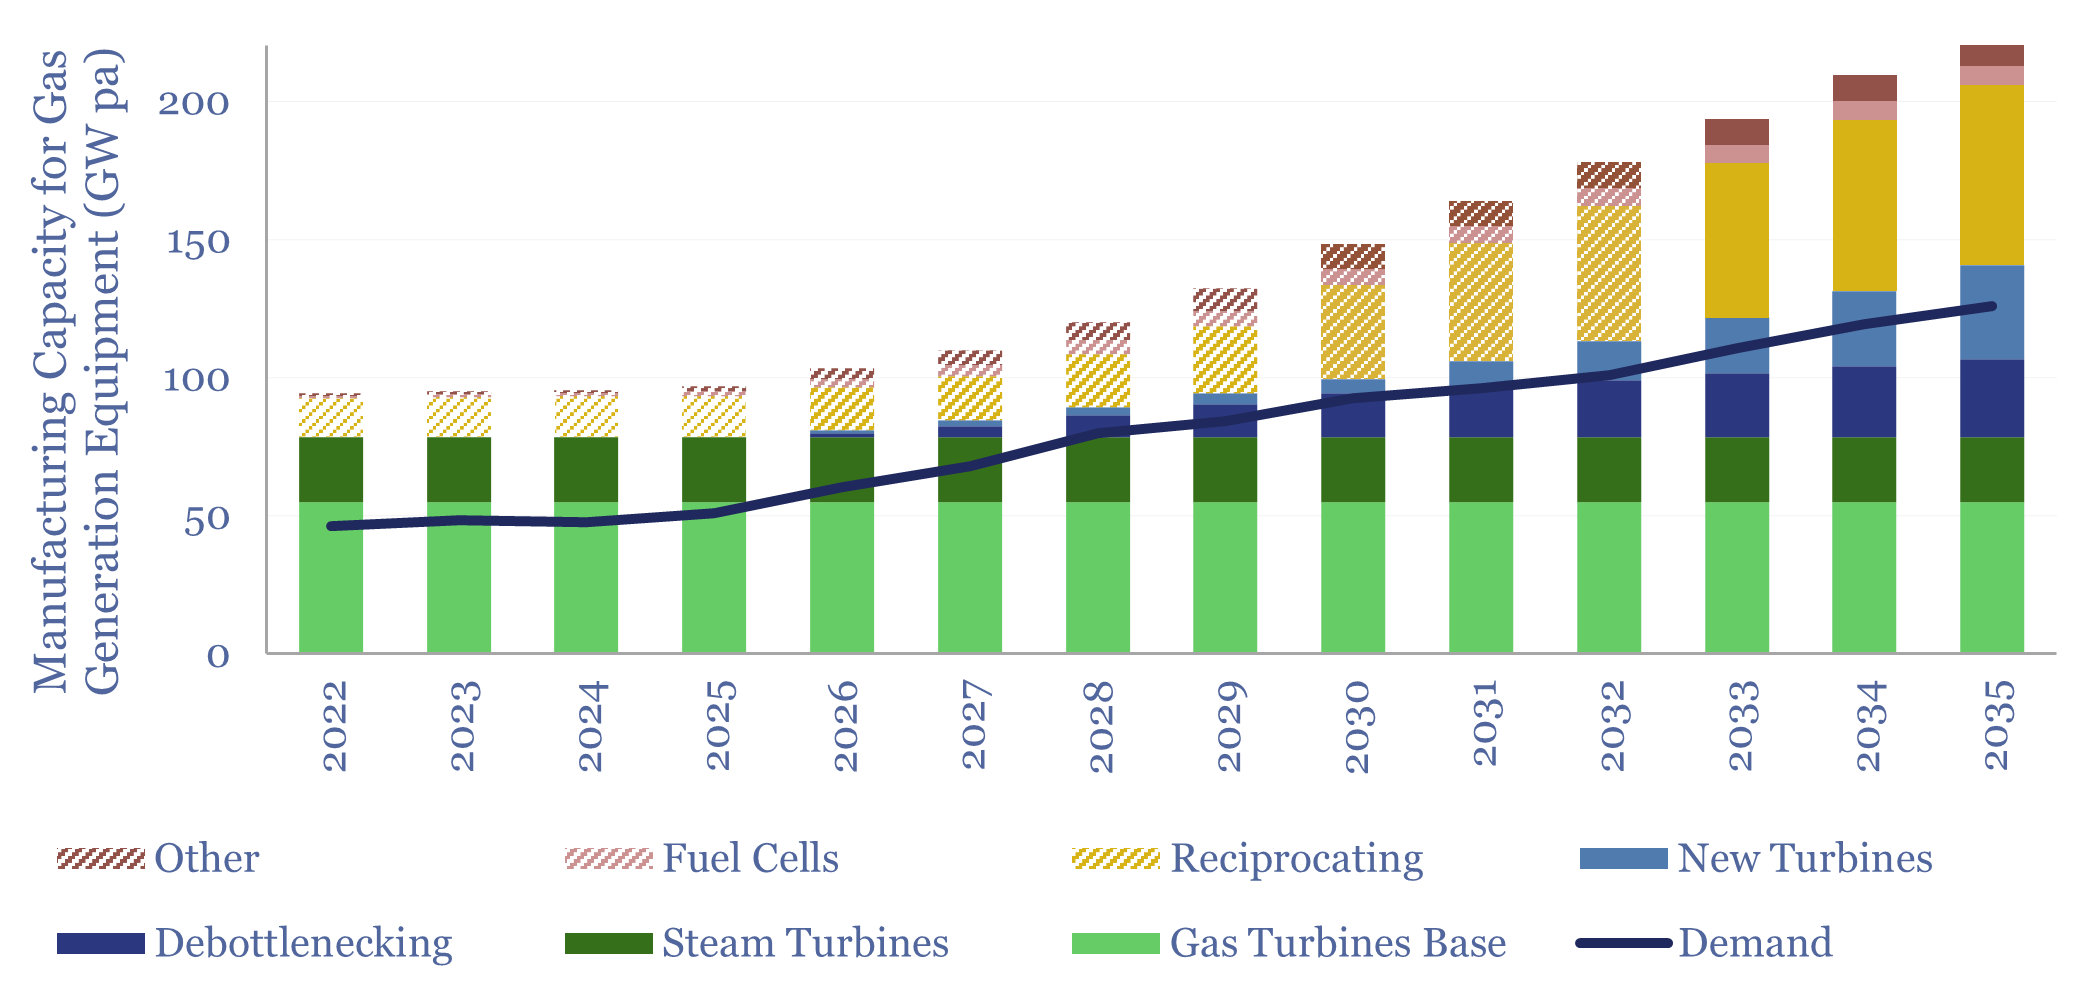
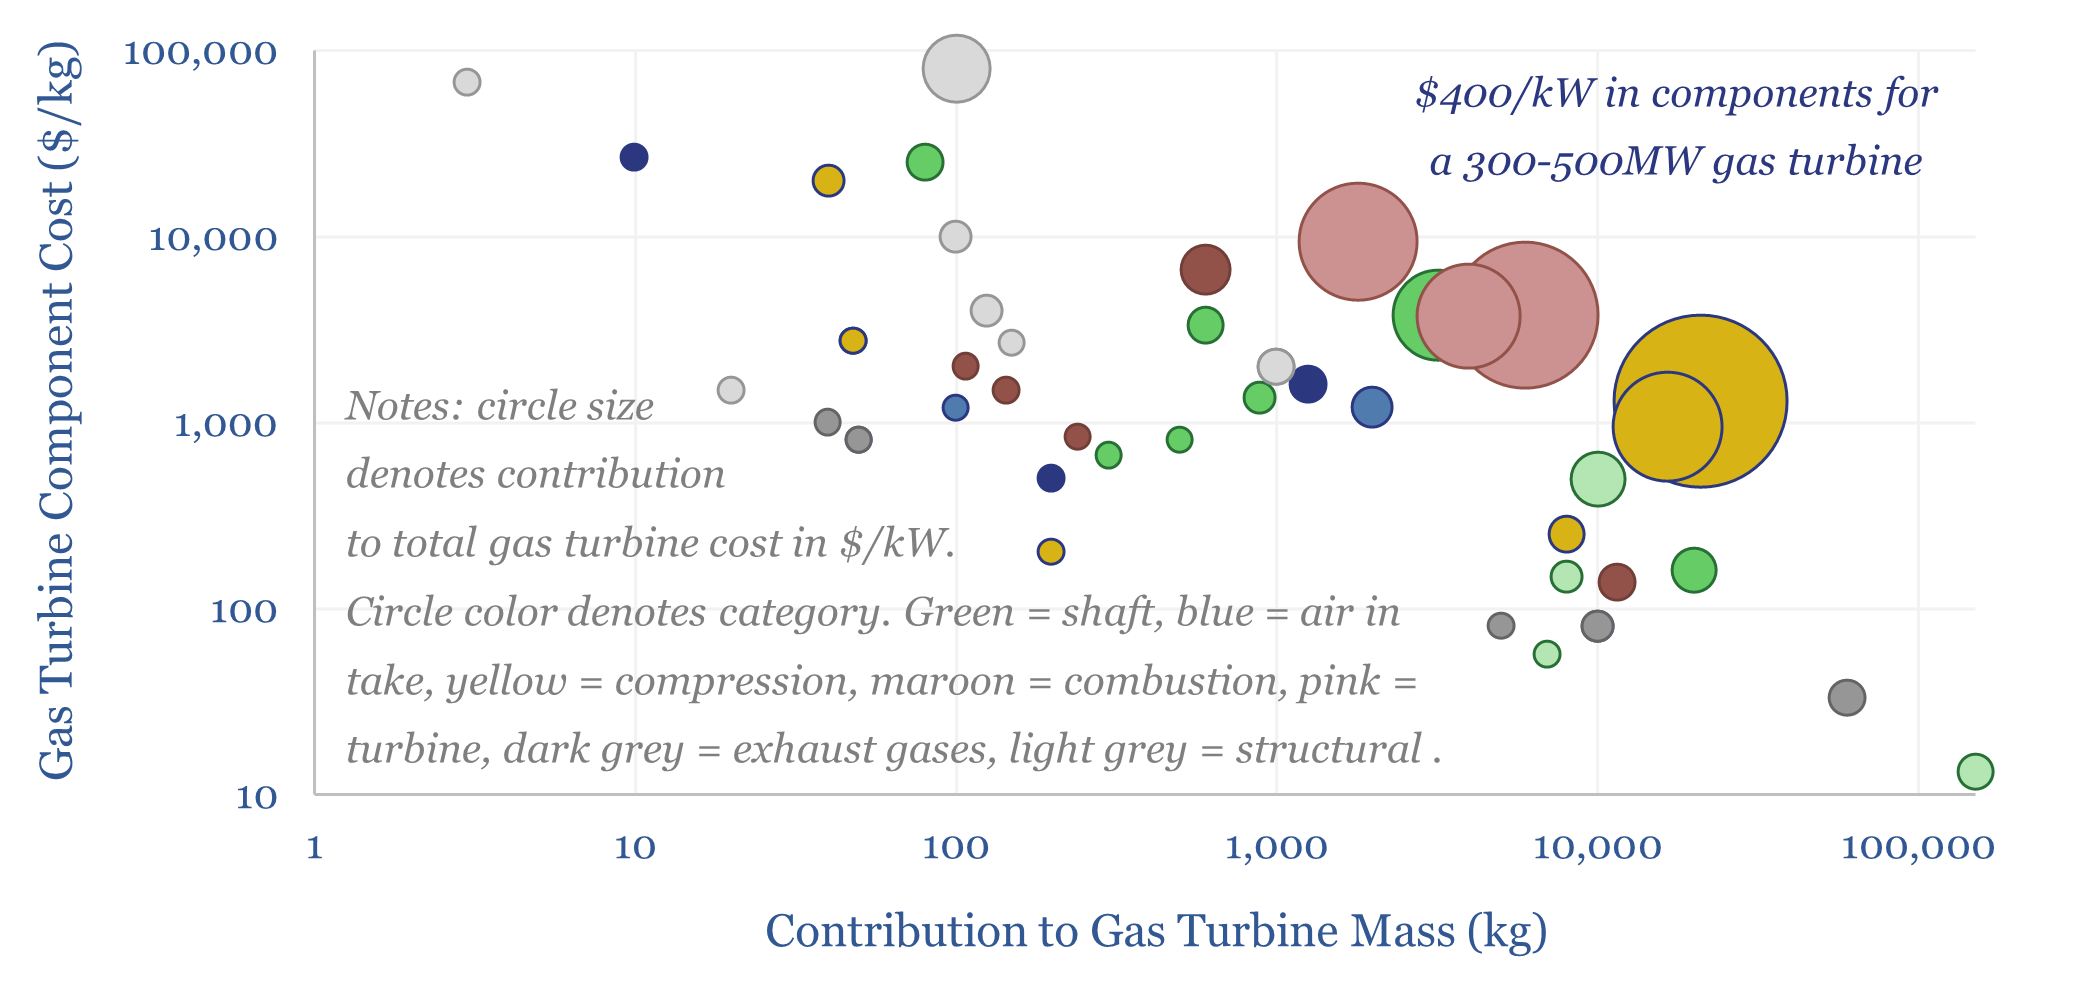
Can we model the supply and demand for gas turbines? This 21-page report presents our attempt. We ultimately see gas turbine manufacturing expansions outpacing demand growth. AI is also helping to expand. However, ‘accelerated orders’ may have distorted order books in 2025.
Read the Report?
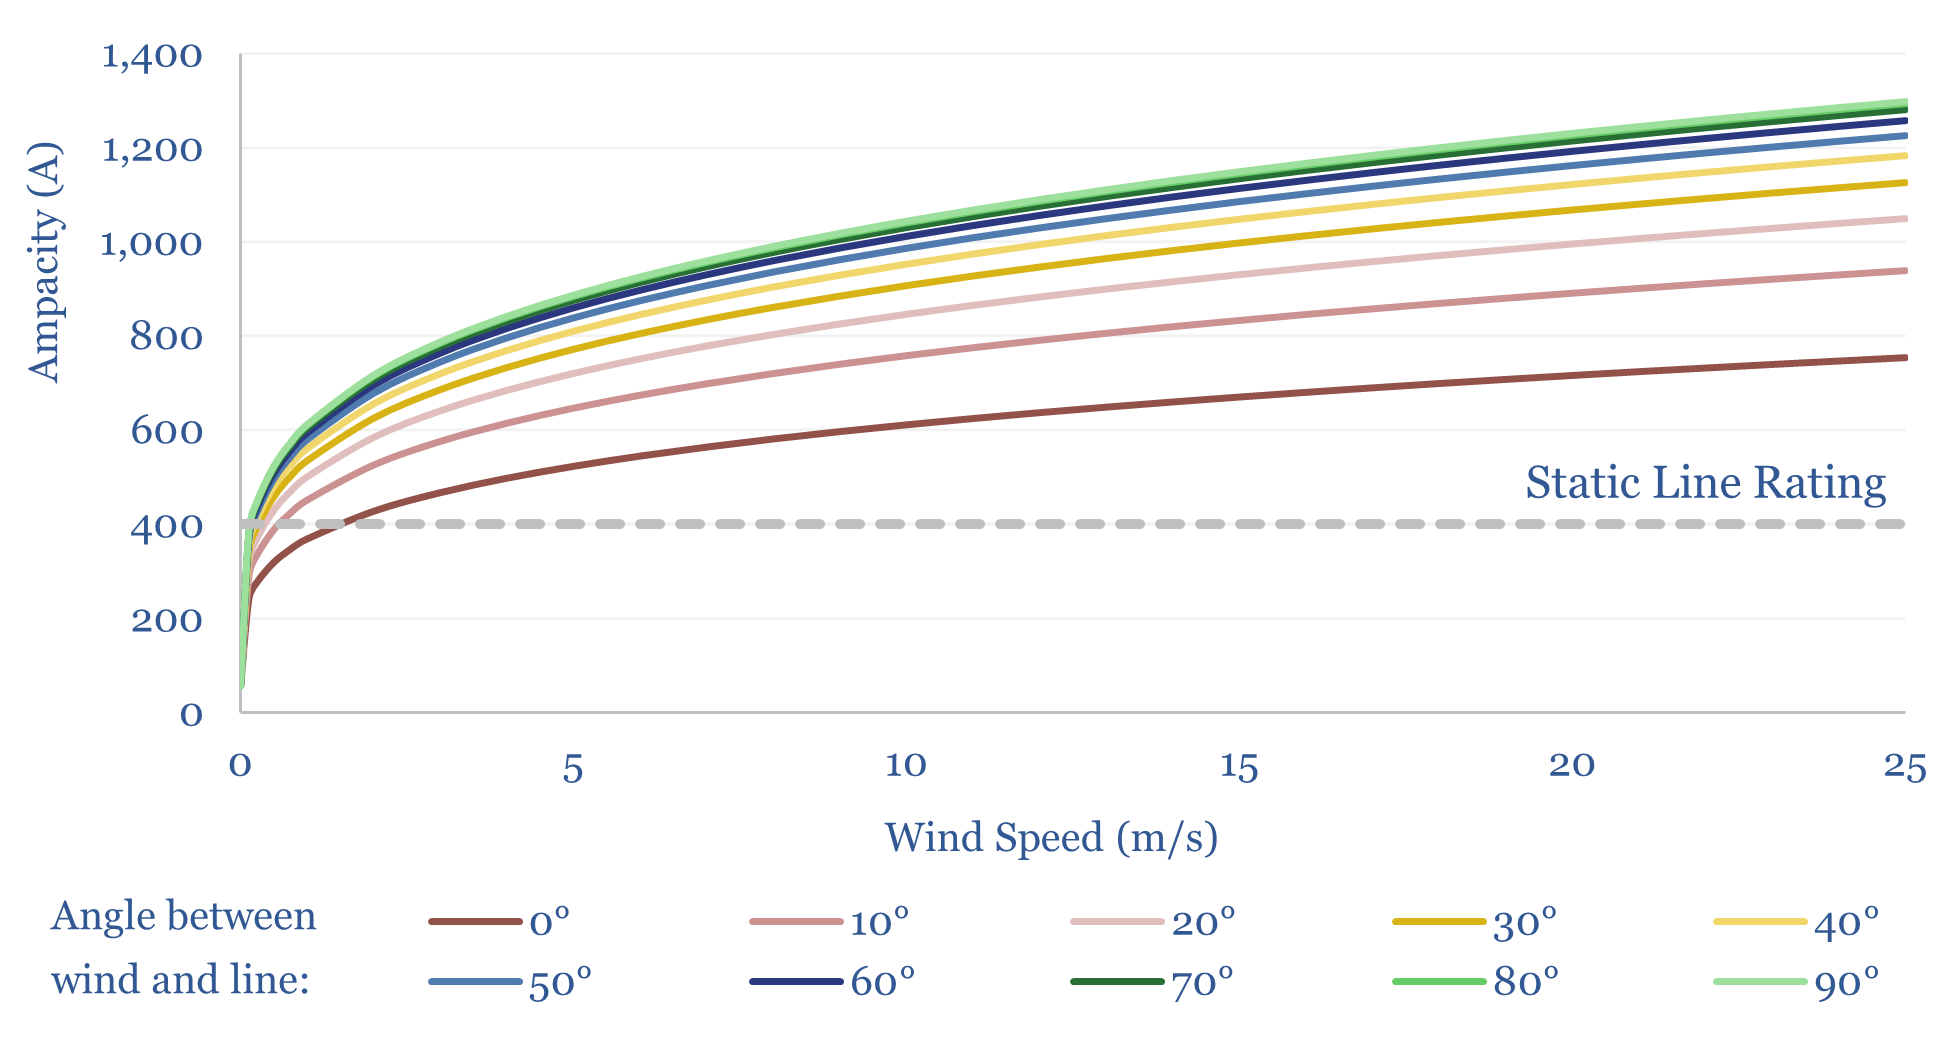
The carrying capacity of the power grid is not fixed, but varies with wind speeds and ambient temperatures. AI is now helping to enable Dynamic Line Ratings, unlocking 10-100%+ more capacity on some lines, effectively for free. This 18-page report explores the implications. Could DLRs avoid $100-300bn pa in future global grid capex, and thus debottleneck the rise of AI itself?
Read the Report?
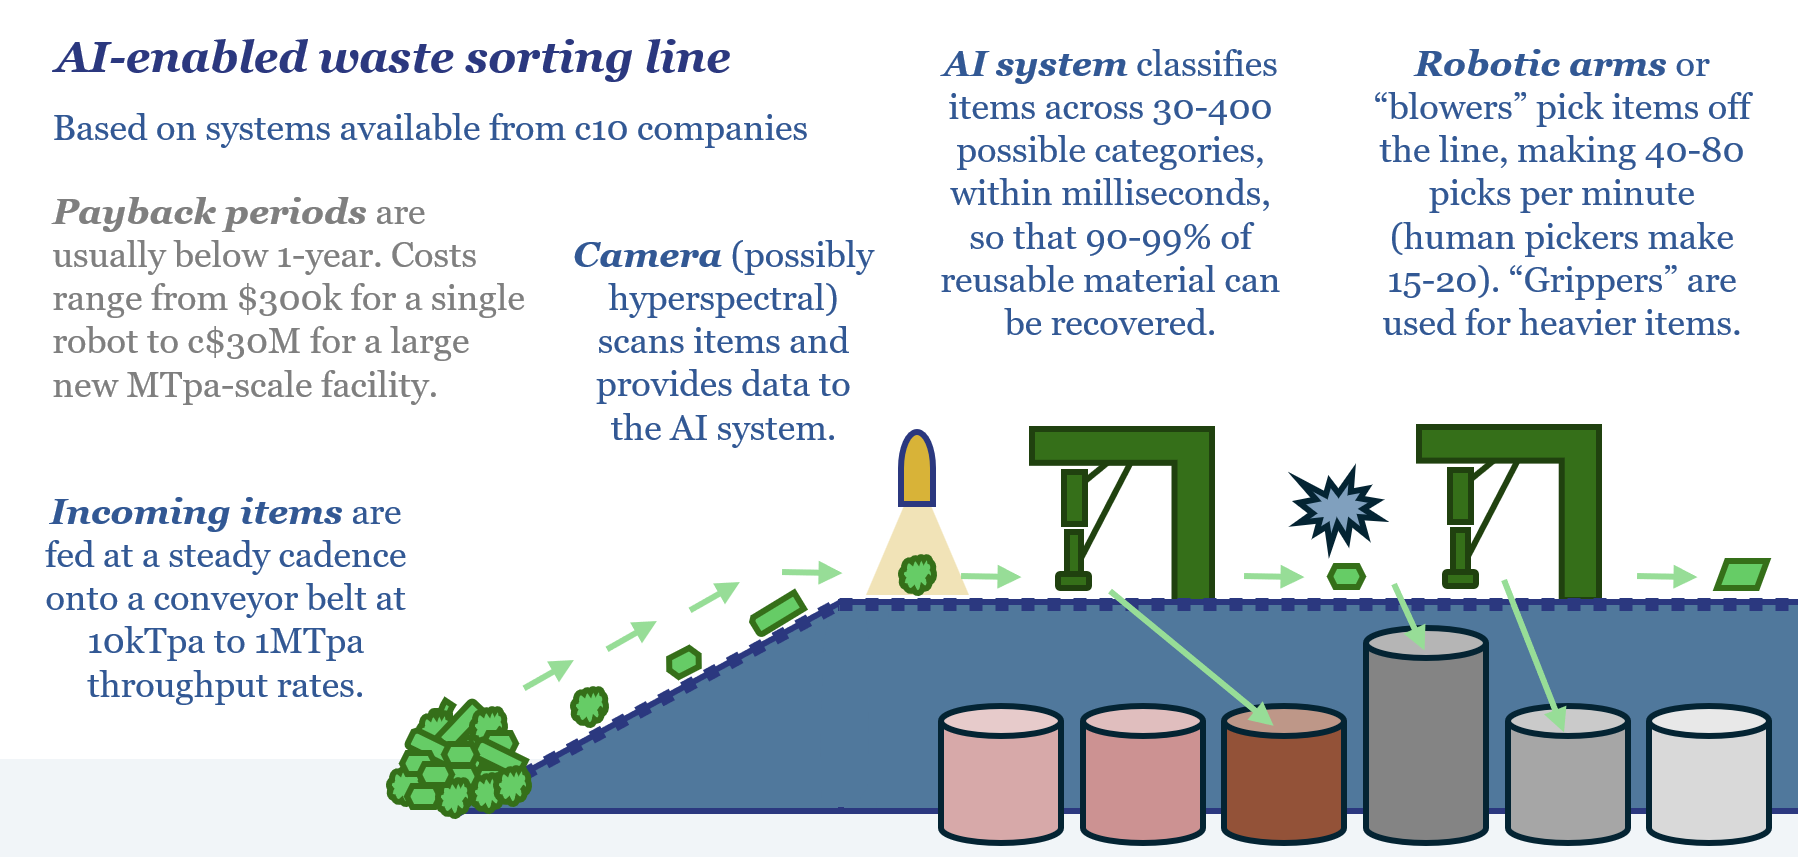
10 companies have recently launched AI-enabled robotics to recover value from the world’s 2.3GTpa of solid waste. Picking rates are 4x faster than humans. c1-year paybacks are quoted. Hence today’s 17-page report explores the implications for gas, power, metals, materials and oil markets, amidst a step-change in the circular economy.
Read the Report?
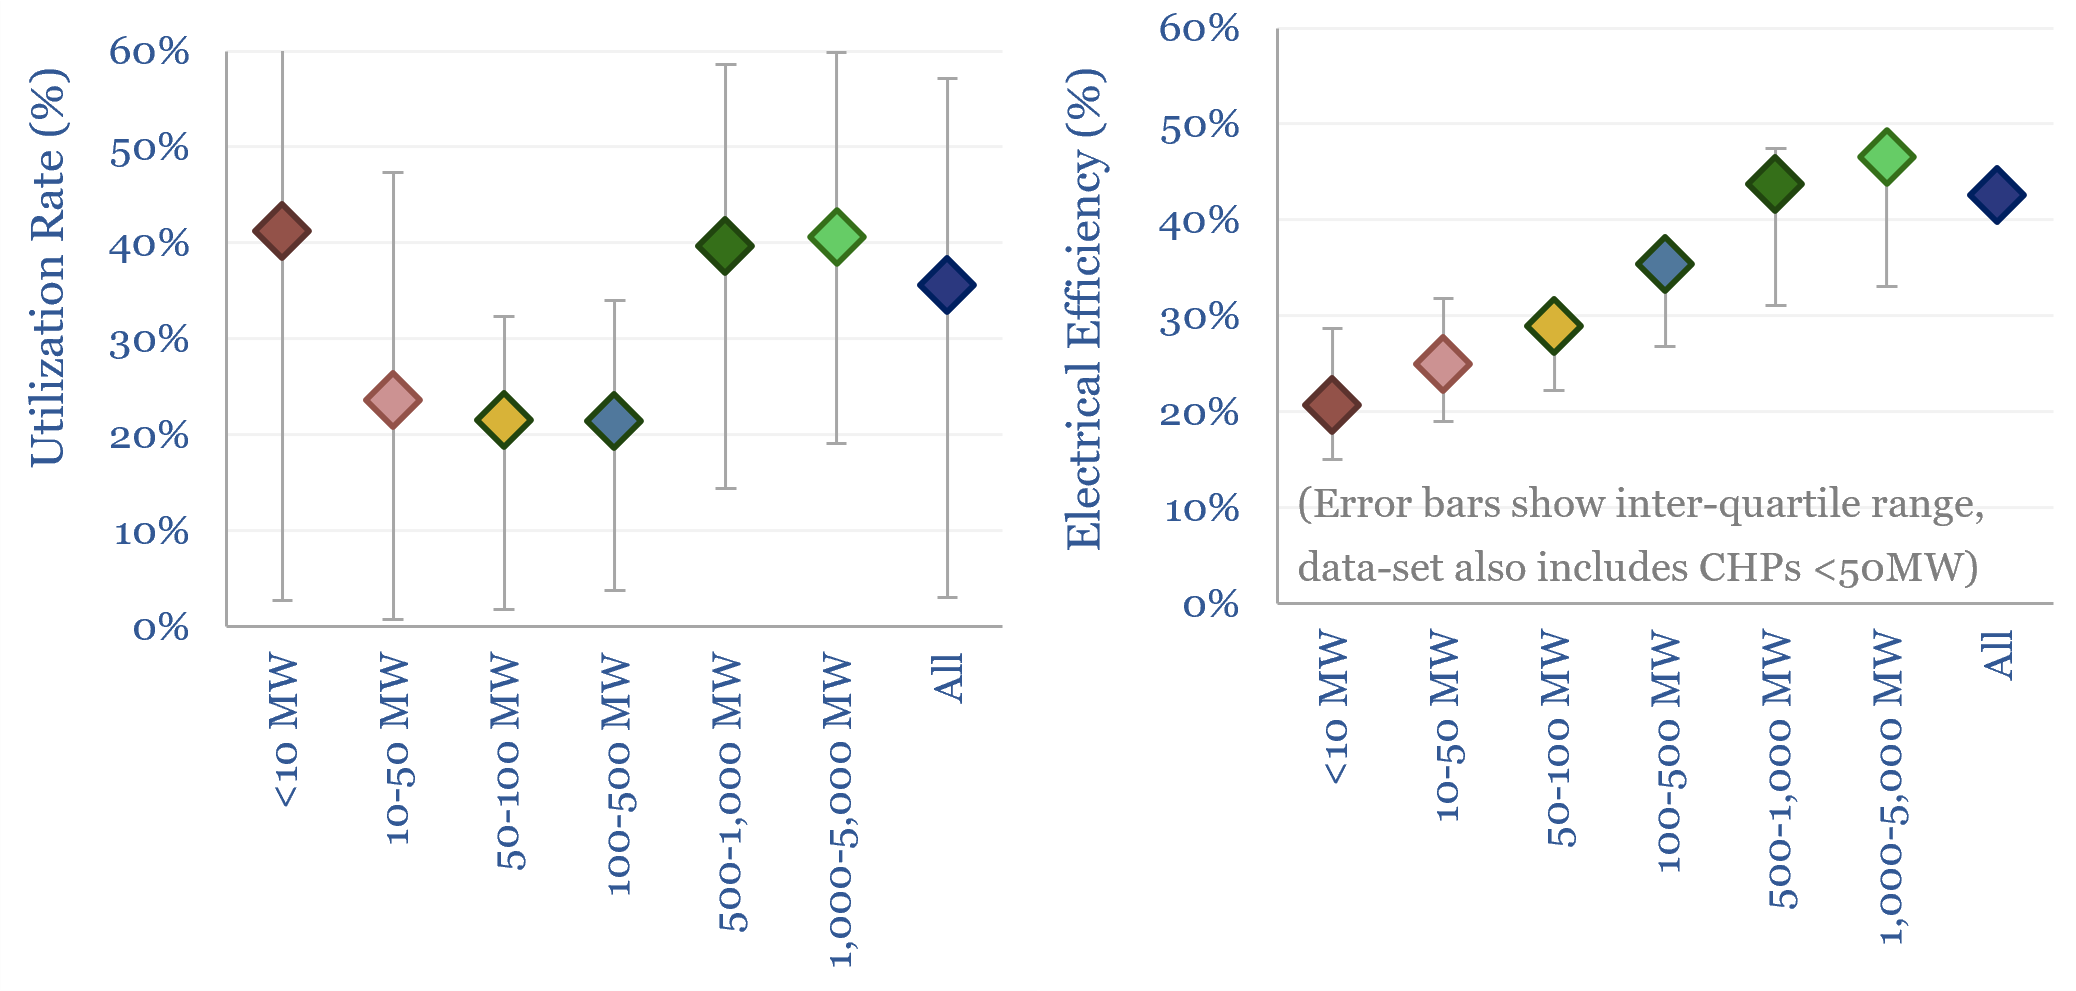
Gas-fired power generating capacity is in a classic capital cycle. This 16-page report evaluates when the cycle will peak. Gas power demand wants to rise at 3.8% pa through 2050. But high CCGT prices may delay EM growth, bring in new entrants, and substitution towards reciprocating engines.
Read the Report?
Further upscaling of AI is only possible via improved power electronics. Hence this 17-page report explores solid state circuit breakers, which offer 1,000x faster fault protection and greater controllability. How do SSCBs work? What do they cost? Who benefits? And who is displaced?
Read the Report?
The internet/AI era is pushing people out of dense urban centers into suburbs and exurbs, whose residents use 2-5x more oil and energy. This 15-page report reviews population density data from 3,150 US counties. Suburbification and exurbification have already been adding 0.2-0.8% pa to oil demand, which is seen accelerating further.
Read the Report?
Providing power to AI data centers was a key theme in 2025. But distributing power within them may be just as important for 2026+. More power-dense AI chips require upgrading in-rack buses from 54V to 800V. This 14-page report explores the challenges and opportunities of future AI power delivery architectures.
Read the Report?
2026 will be a year of recalibration. Long-standing theses/trends will break down: including for oil, LNG, geopolitics, EVs, solar, power markets and decarbonization. Energy markets swing from 1% oversupply in 2025, to undersupply in 2027. So which materials and strategies will fare best?
Read the Report?
Global oil demand was once meant to peak out in 2024-30. But 2025 saw almost 1Mbpd of growth, to 104Mbpd. 2026 should see over 1Mbpd of growth, amplified by a YoY pullback in EV sales. Hence this 15-page report revisits peak global oil demand and sees global refinery utilization tightening by 3-5%.
Read the Report?
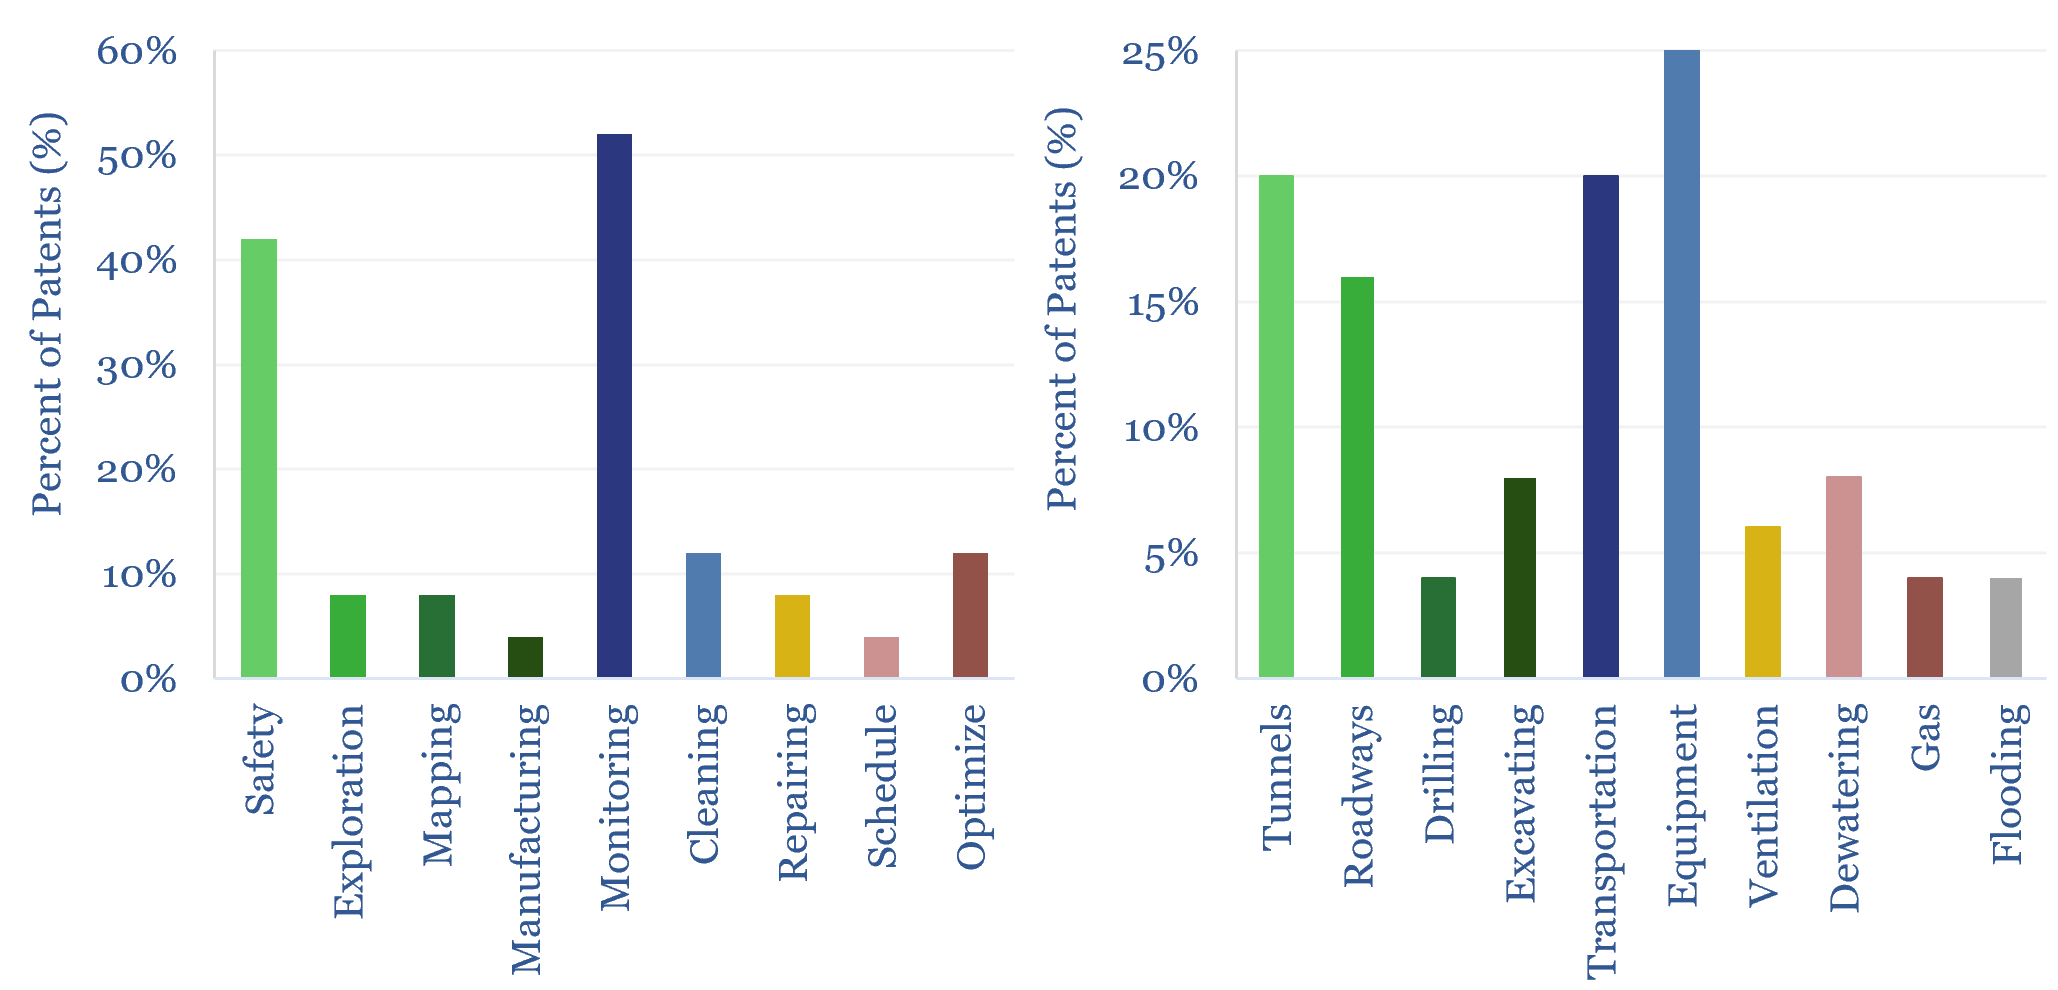
The idea for this report was to dream up interesting uses for autonomous mobile robotics in the future, including in energy and mining. But to our amazement, many of these ideas are already being piloted. We reviewed the pilots in this 18-page report. They suggest transformational economic impacts and moderate energy/materials upside.
Read the Report?
This 13-page report explores the upside in autonomous transport. We were recently invited to a fascinating company event in Leipzig, Germany. But it was too complex to reach by flying. It would have been doable in an autonomous vehicle, albeit using 2x more energy overall. So could autonomous vehicles unlock 5Mbpd of global oil demand upside?
Read the Report?
This 19-page report explores the world’s progress towards net zero, amidst the harsh economic reality of 2025+. Which decarbonization technologies are still progressing, which are scaling back, and why? What if the current trajectory is ultimately seen to be enough?
Read the Report?
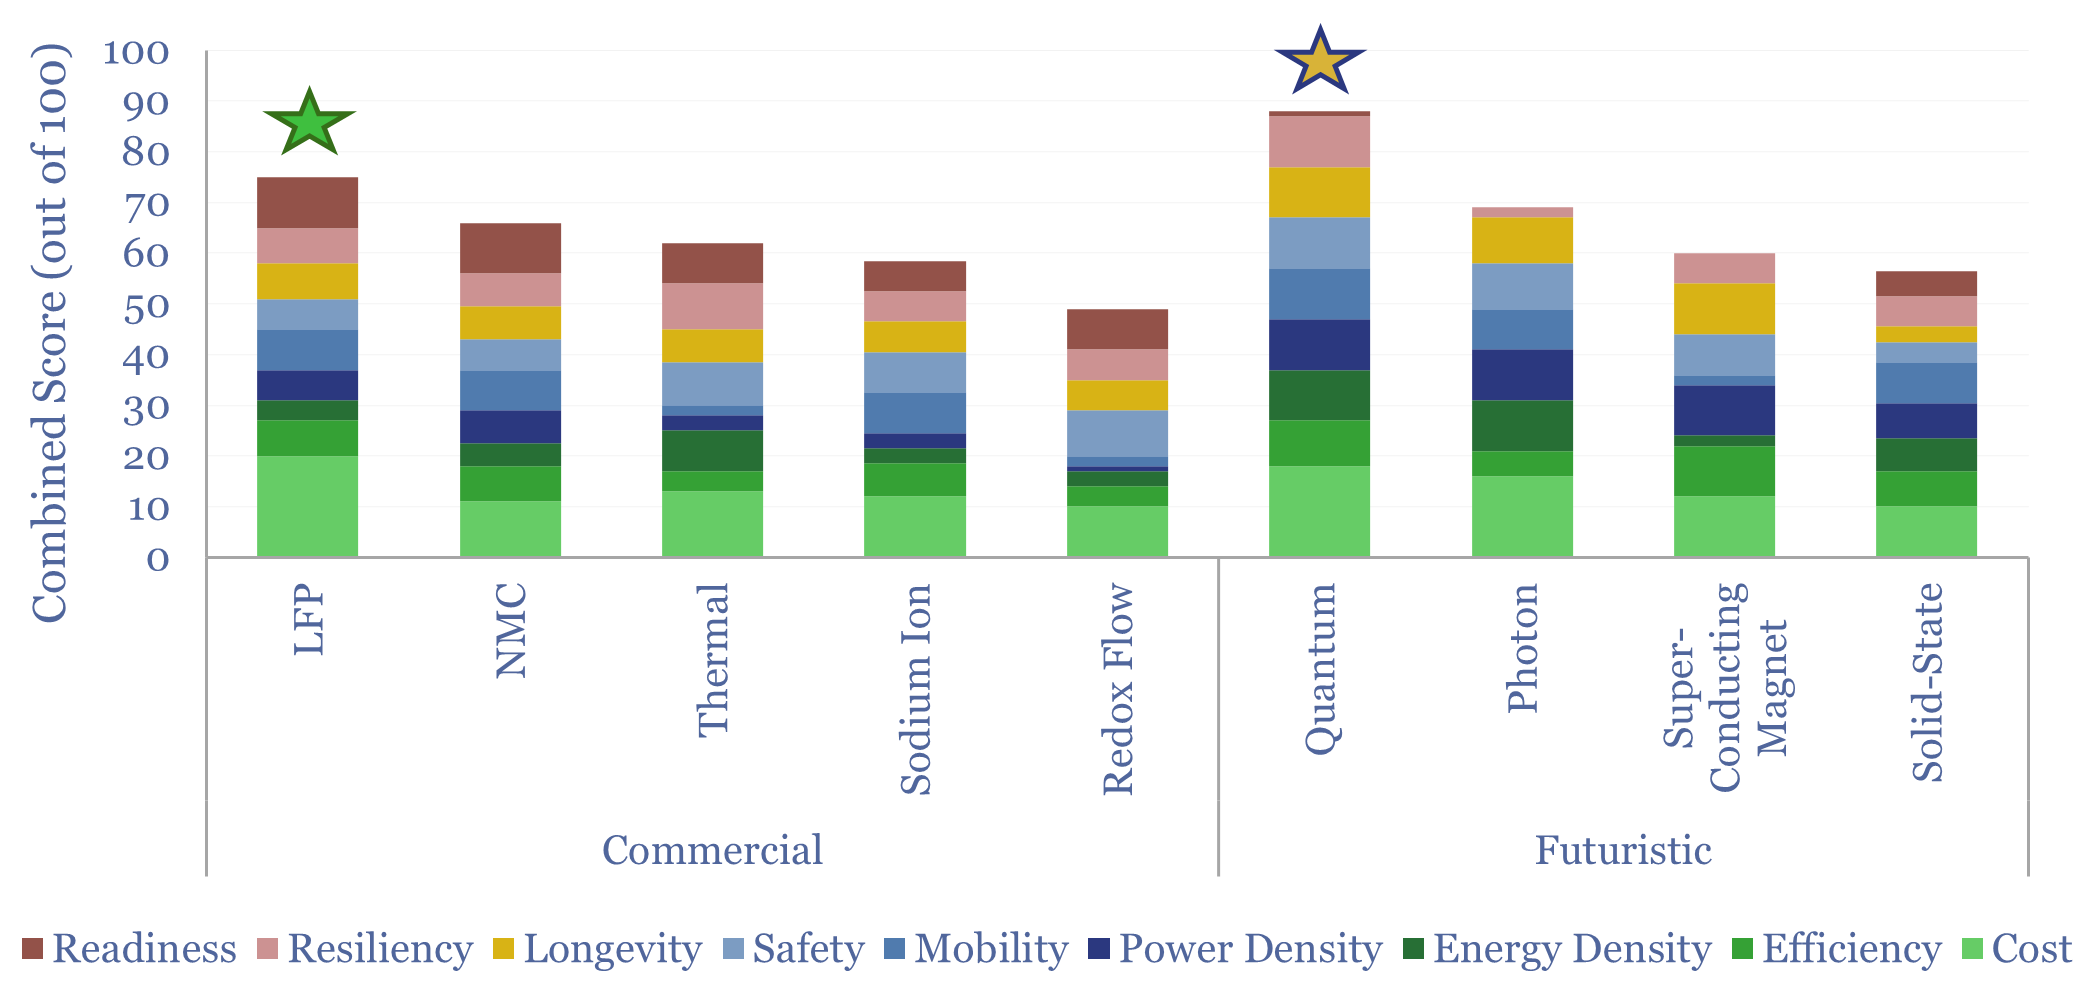
Lithium ion batteries are now so deeply entrenched that we doubt any new electrochemistry can supplant them. This 23-page report asks where are the opportunities now in batteries? Could any futuristic batteries with quasi-infinite capacity, such as quantum batteries, power inter-seasonal storage or long-distance aviation?
Read the Report?
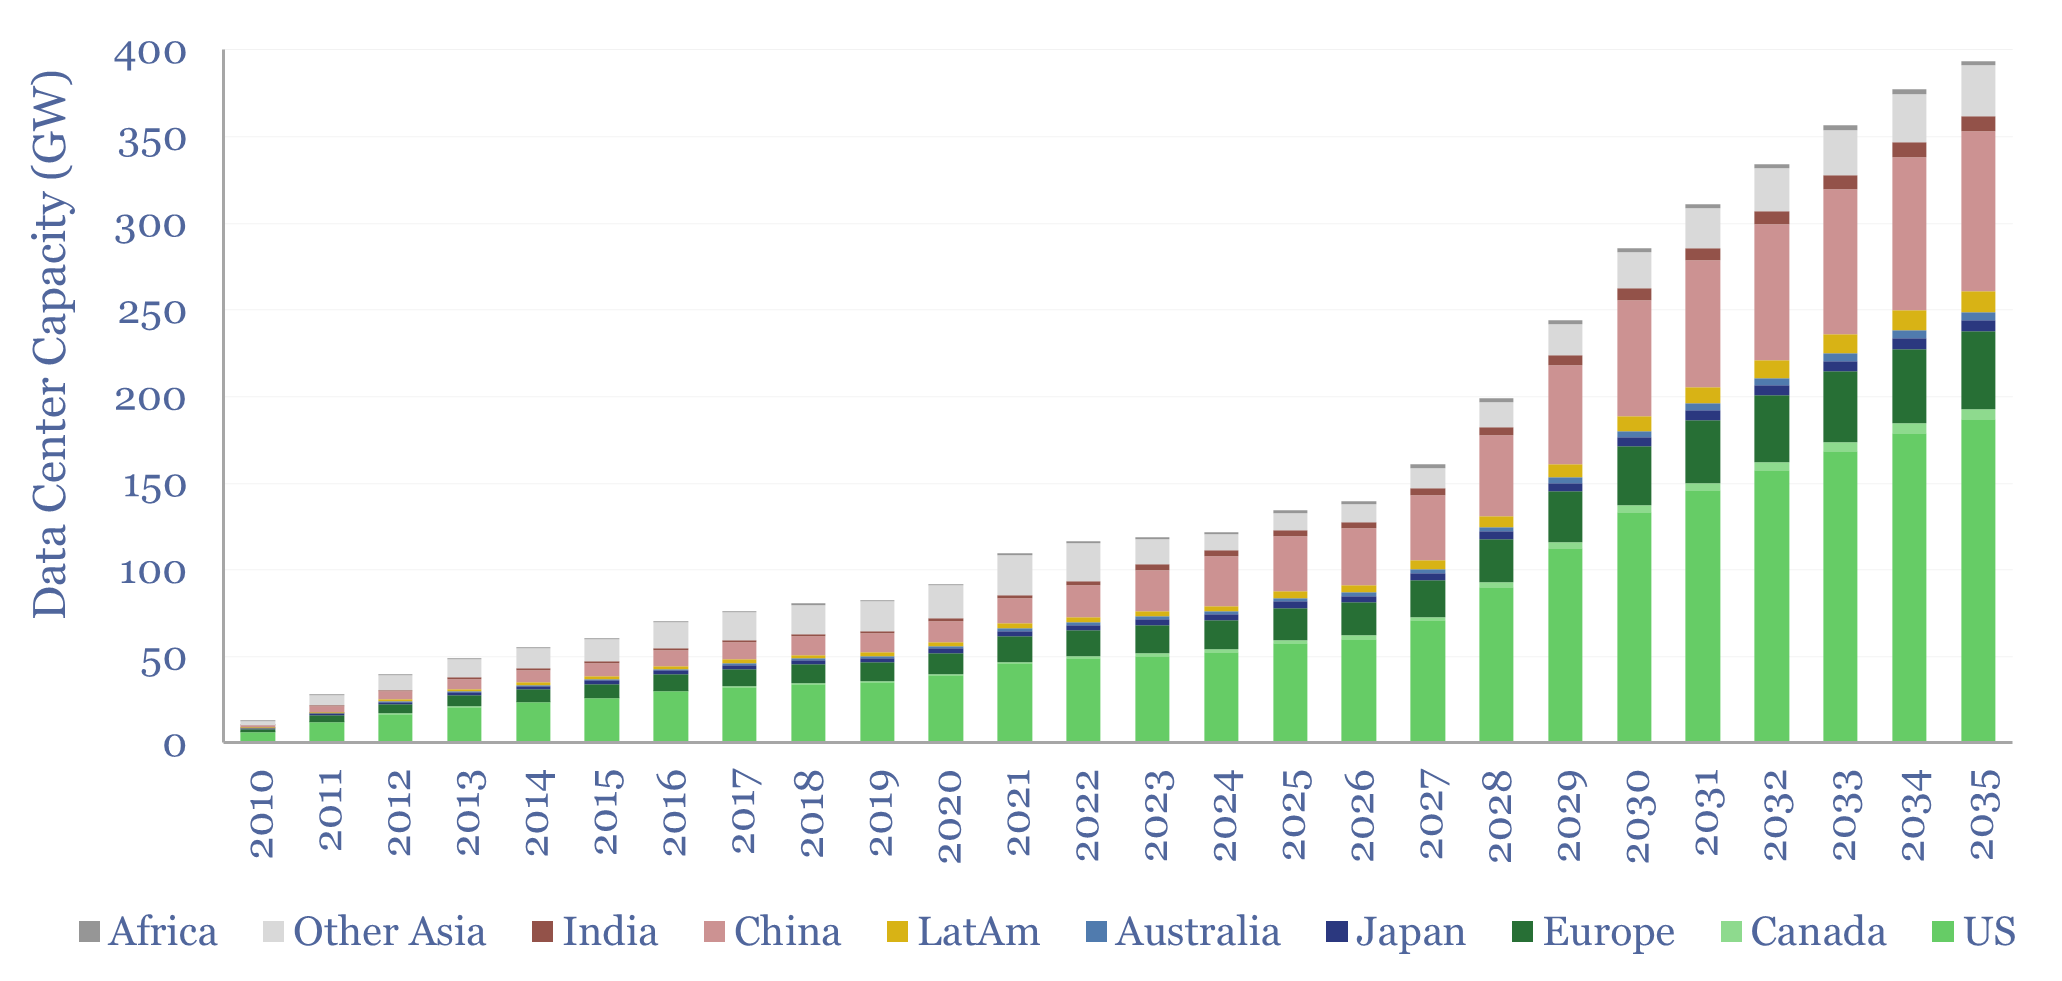
How many data centers will there be? How big will the biggest AI data centers be? Where should they be located? And do recent announcements connote upside or downside risks? This 15-page report forecasts the build-out of AI data centers, using bottom-up data, statistical distributions and economic modeling.
Read the Report?
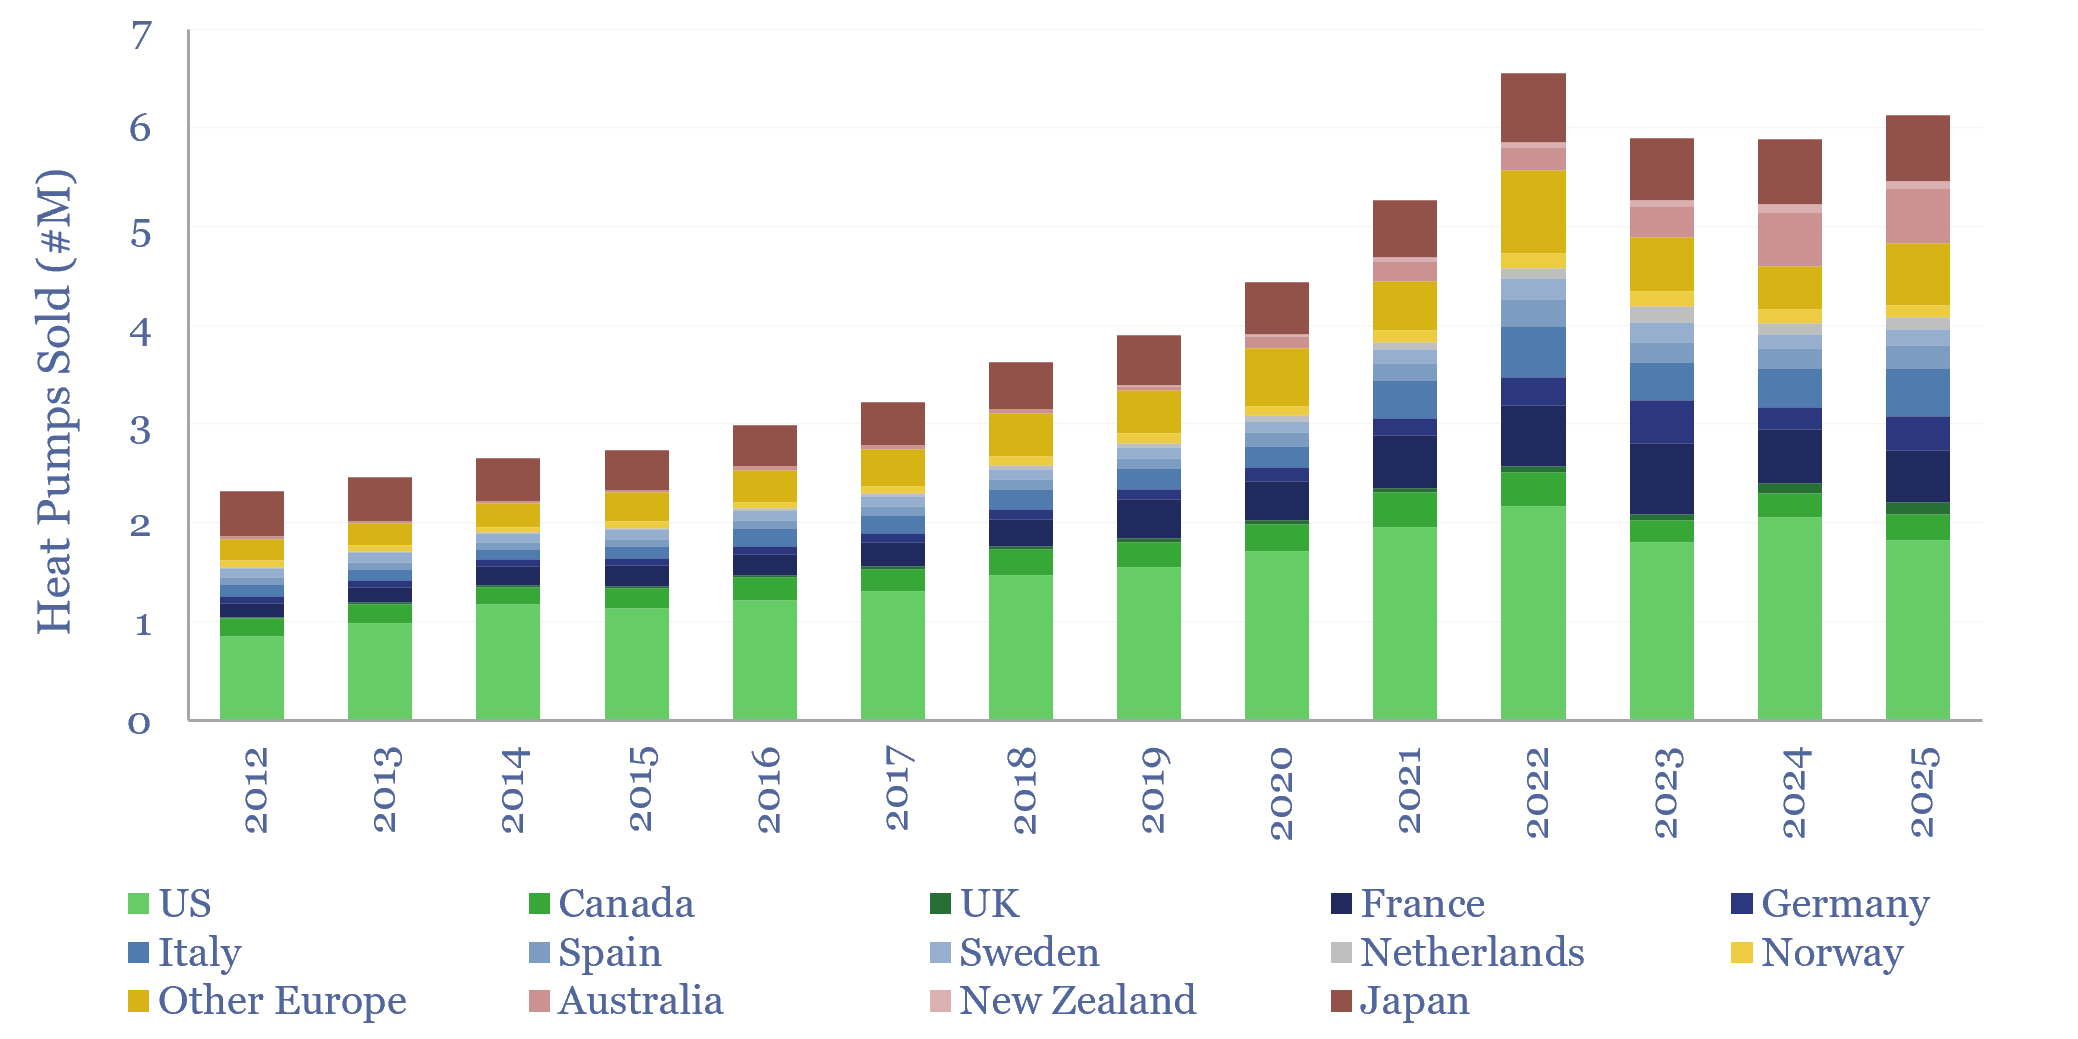
Could industrial heat pumps accelerate, especially due to excess renewables, thereby stoking load growth, and displacing natural gas? This 14-page report finds the economics are more challenging than expected. Heat pumps fare best in specific contexts. Load growth mainly hinges on AI.
Read the Report?
This 15-page report outlines how wholesale power markets work, which helps to understand four emerging controversies. Wholesale power prices are governed by classic microeconomics: day-ahead markets clear at the intersection of downward sloping demand curves and upward sloping supply curves.
Read the Report?
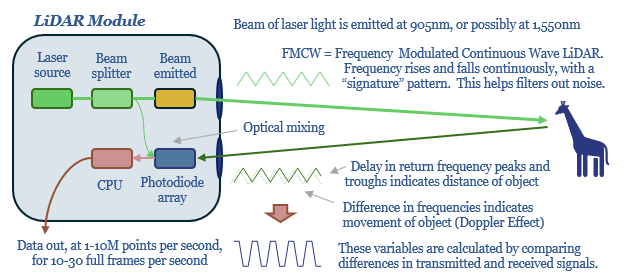
The sensors used for advanced driver assistance systems (ADAS), and increasingly for autonomous vehicles, offer useful lessons for AI, robotics and mining. Hence this 17-page report revisits the debate between LiDAR vs cameras, radar and ultrasound. Hardware must compete on cost and performance. But who benefits from deflation?
Read the Report?
This 15-page report models the costs of powering AI data centers, and other round-the-clock loads, using only solar and batteries, plus a “penalty” of 100-600 c/kWh for unmet demand. In some locations, solar+batteries will out-compete gas in the future? But an ocean of excess power gets thrown out?
Read the Report?
This global energy supply-demand model combines our supply outlooks for coal, oil, gas, LNG, wind and solar, nuclear and hydro, into a build-up of useful global energy balances in 2023-30. 2026 will be a year of recalibration, as global energy markets shift from c1% over-supply in 2025 to -0.5% under-supply in 2027?
Download the Model?
Global plastic is estimated at 530MTpa in 2025, rising to 1GTpa by 2050. This data-file is a breakdown of global plastic demand, by product, by region and by end use, with historical data back to 1990 and our forecasts out to 2050. Our top conclusions for plastic demand, by region, by product, by fate, are below.
Download the Model?
Global gas supply-demand is predicted to rise from 400bcfd in 2023 to 650bcfd by 2050, in our outlook, as a complement to wind, solar, nuclear, and as global coal resources mature from the 2030s onwards. This data-file quantifies global gas demand and supply by country, across heating, power and industry.
Download the Model?
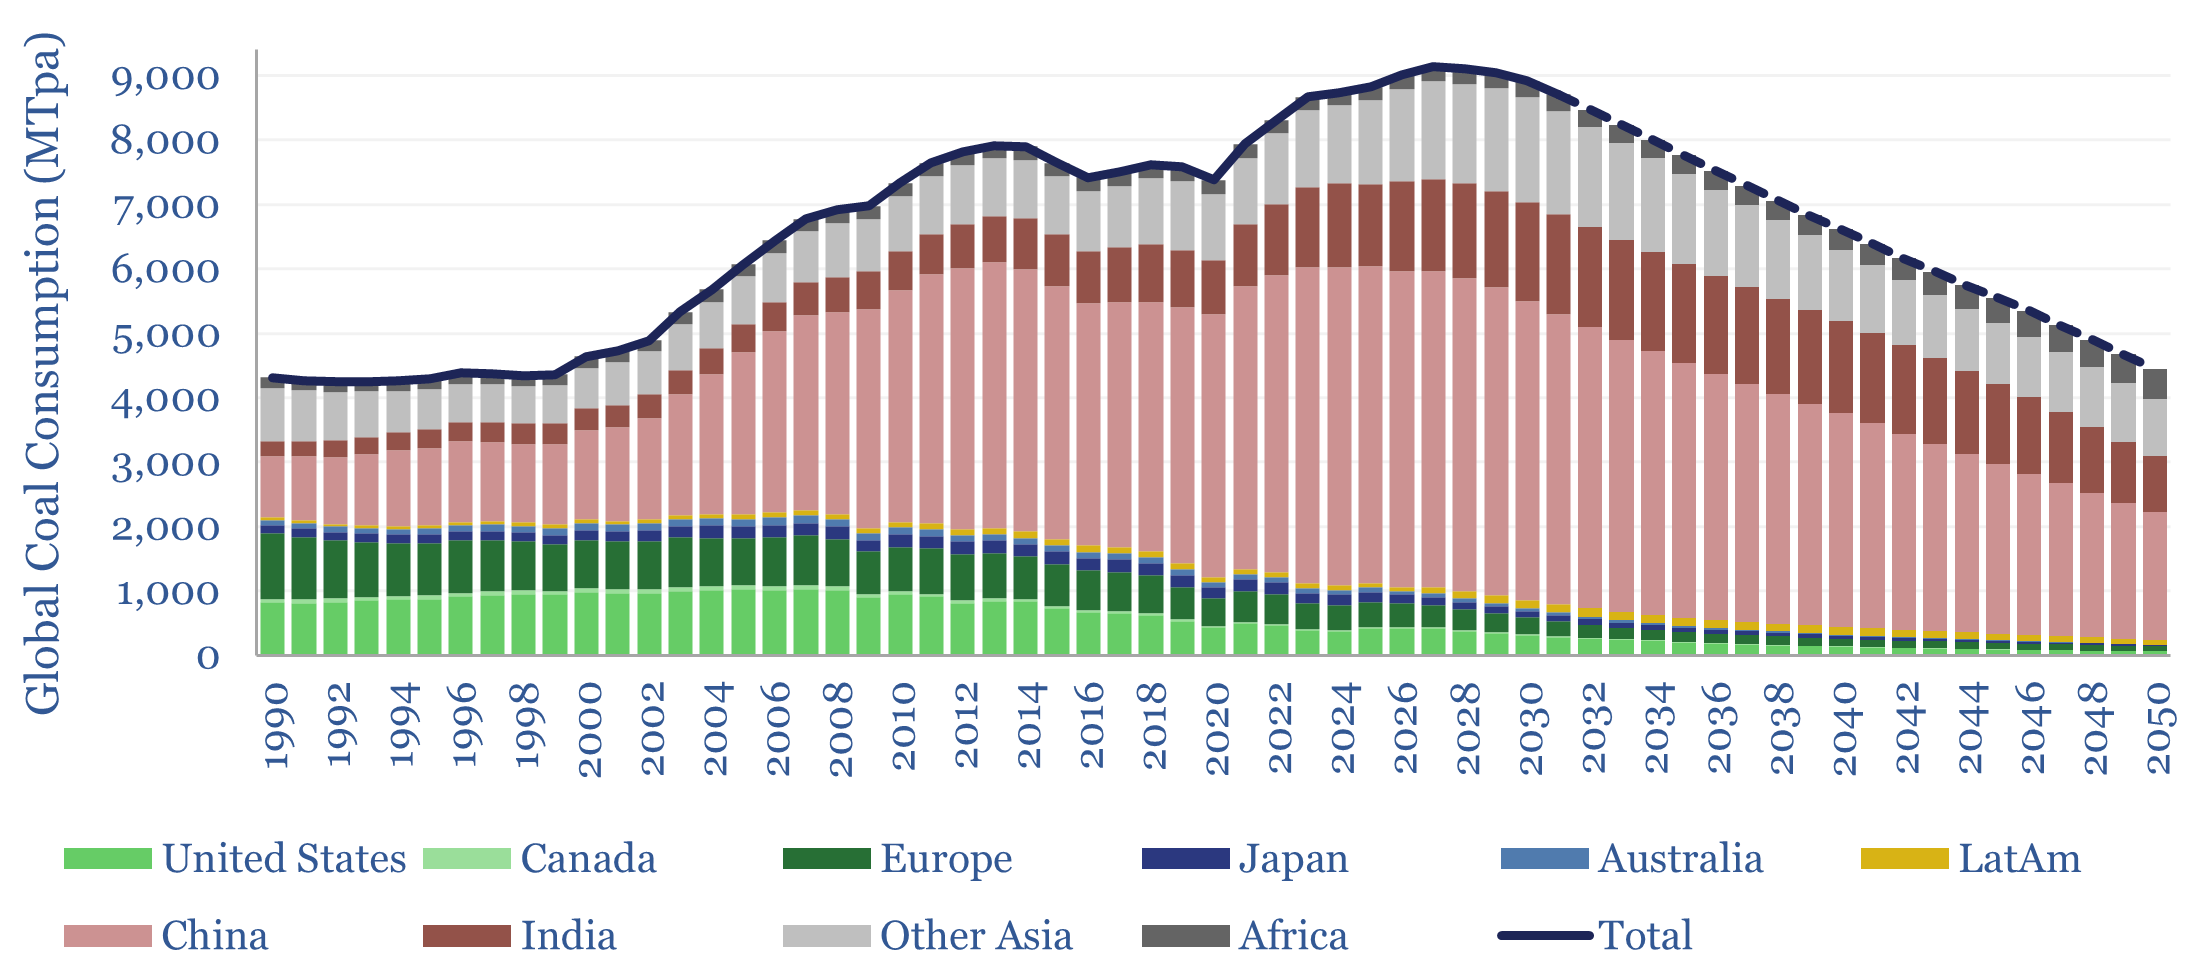
Global coal supply-demand remained at all-time peak levels of 8.8GTpa in 2025, of which 7.6GTpa is thermal coal and 1.1GTpa is metallurgical. The largest consumers are China (4.9GTpa), India (1.3GTpa), other Asia (1.3GTpa), Europe (0.4GTpa) and the US (0.4GTpa). This model presents our forecasts for global coal supply-demand from 1990 to 2050.
Download the Model?
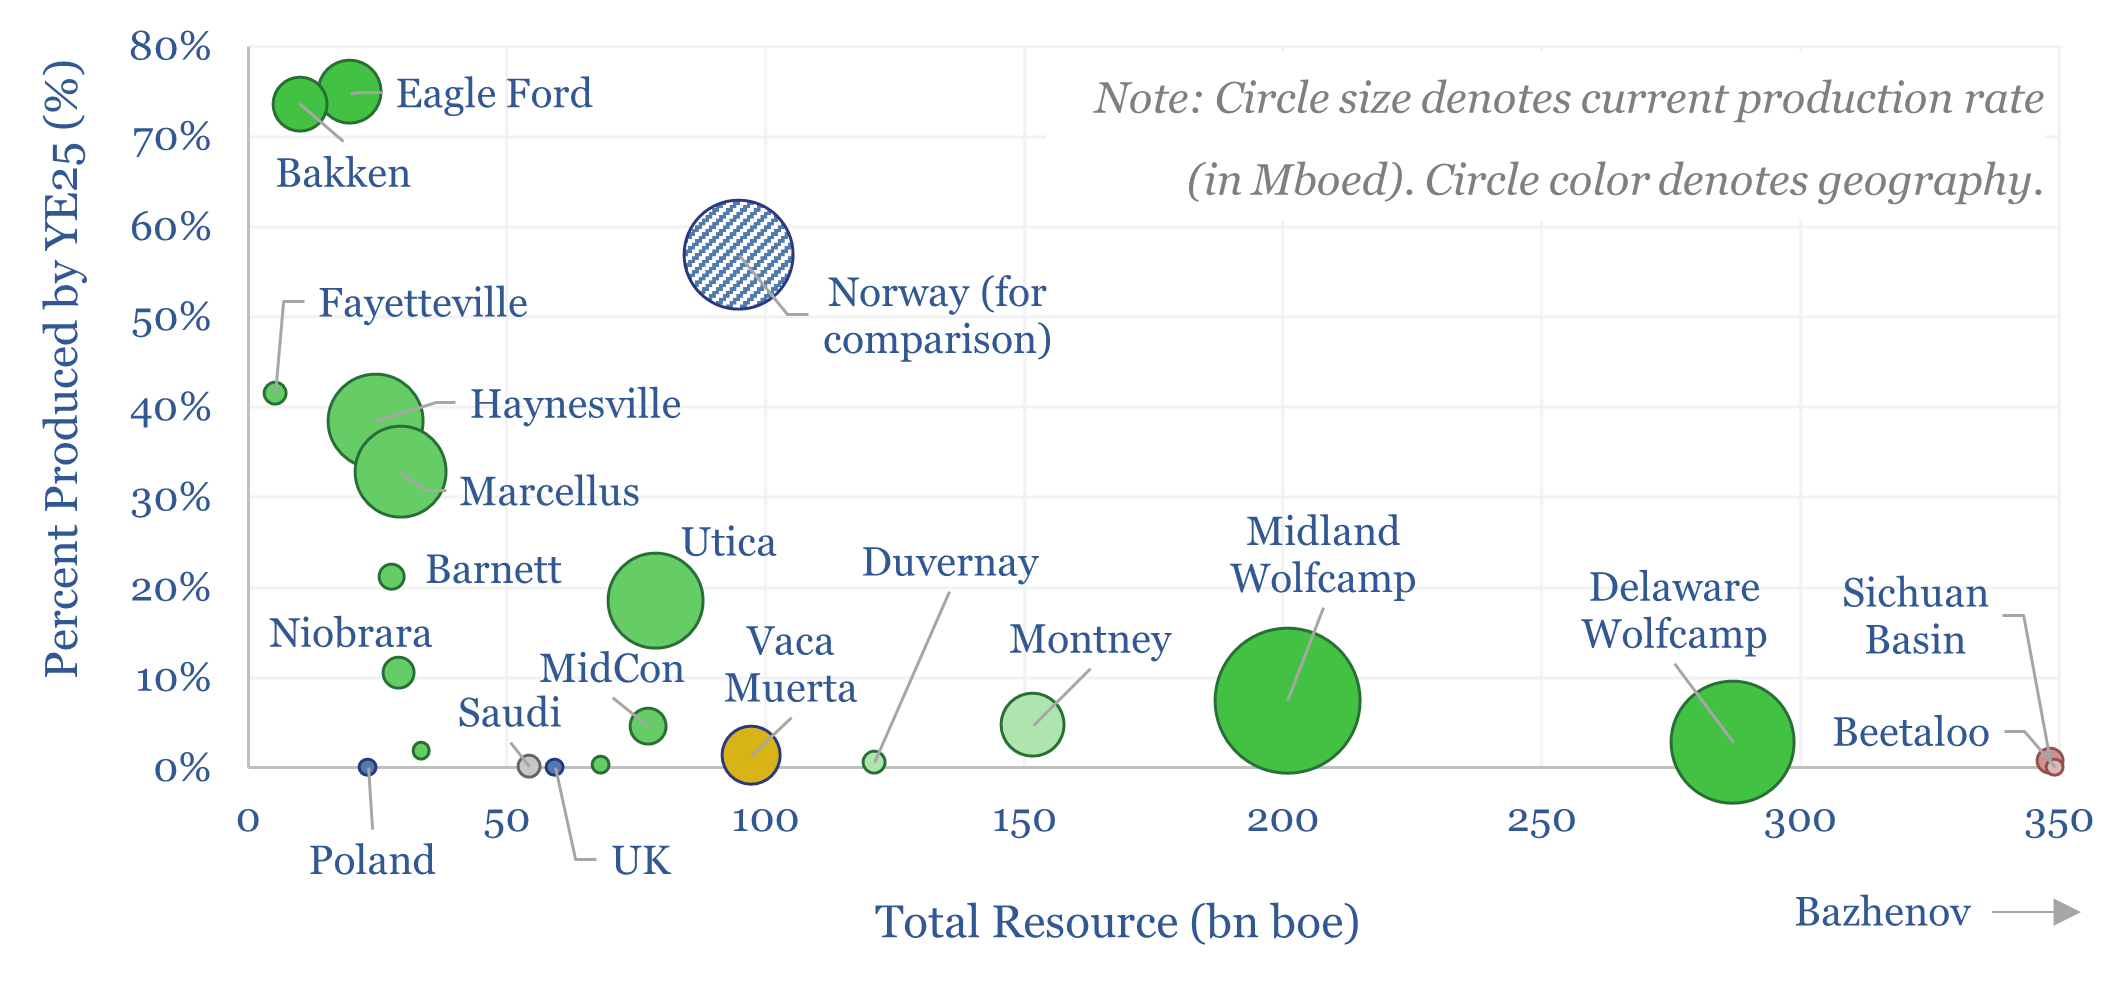
This model sets out our US shale production forecasts by basin. It covers the Permian, Bakken, Eagle Ford, Marcellus/Utica and Haynesville, as a function of the rig count, drilling productivity, completion rates, well productivity and type curves. The data-file was last updated in May-2025, revising liquids growth negative in 2025-26, which in turn tightens US gas markets?
Download the Model?
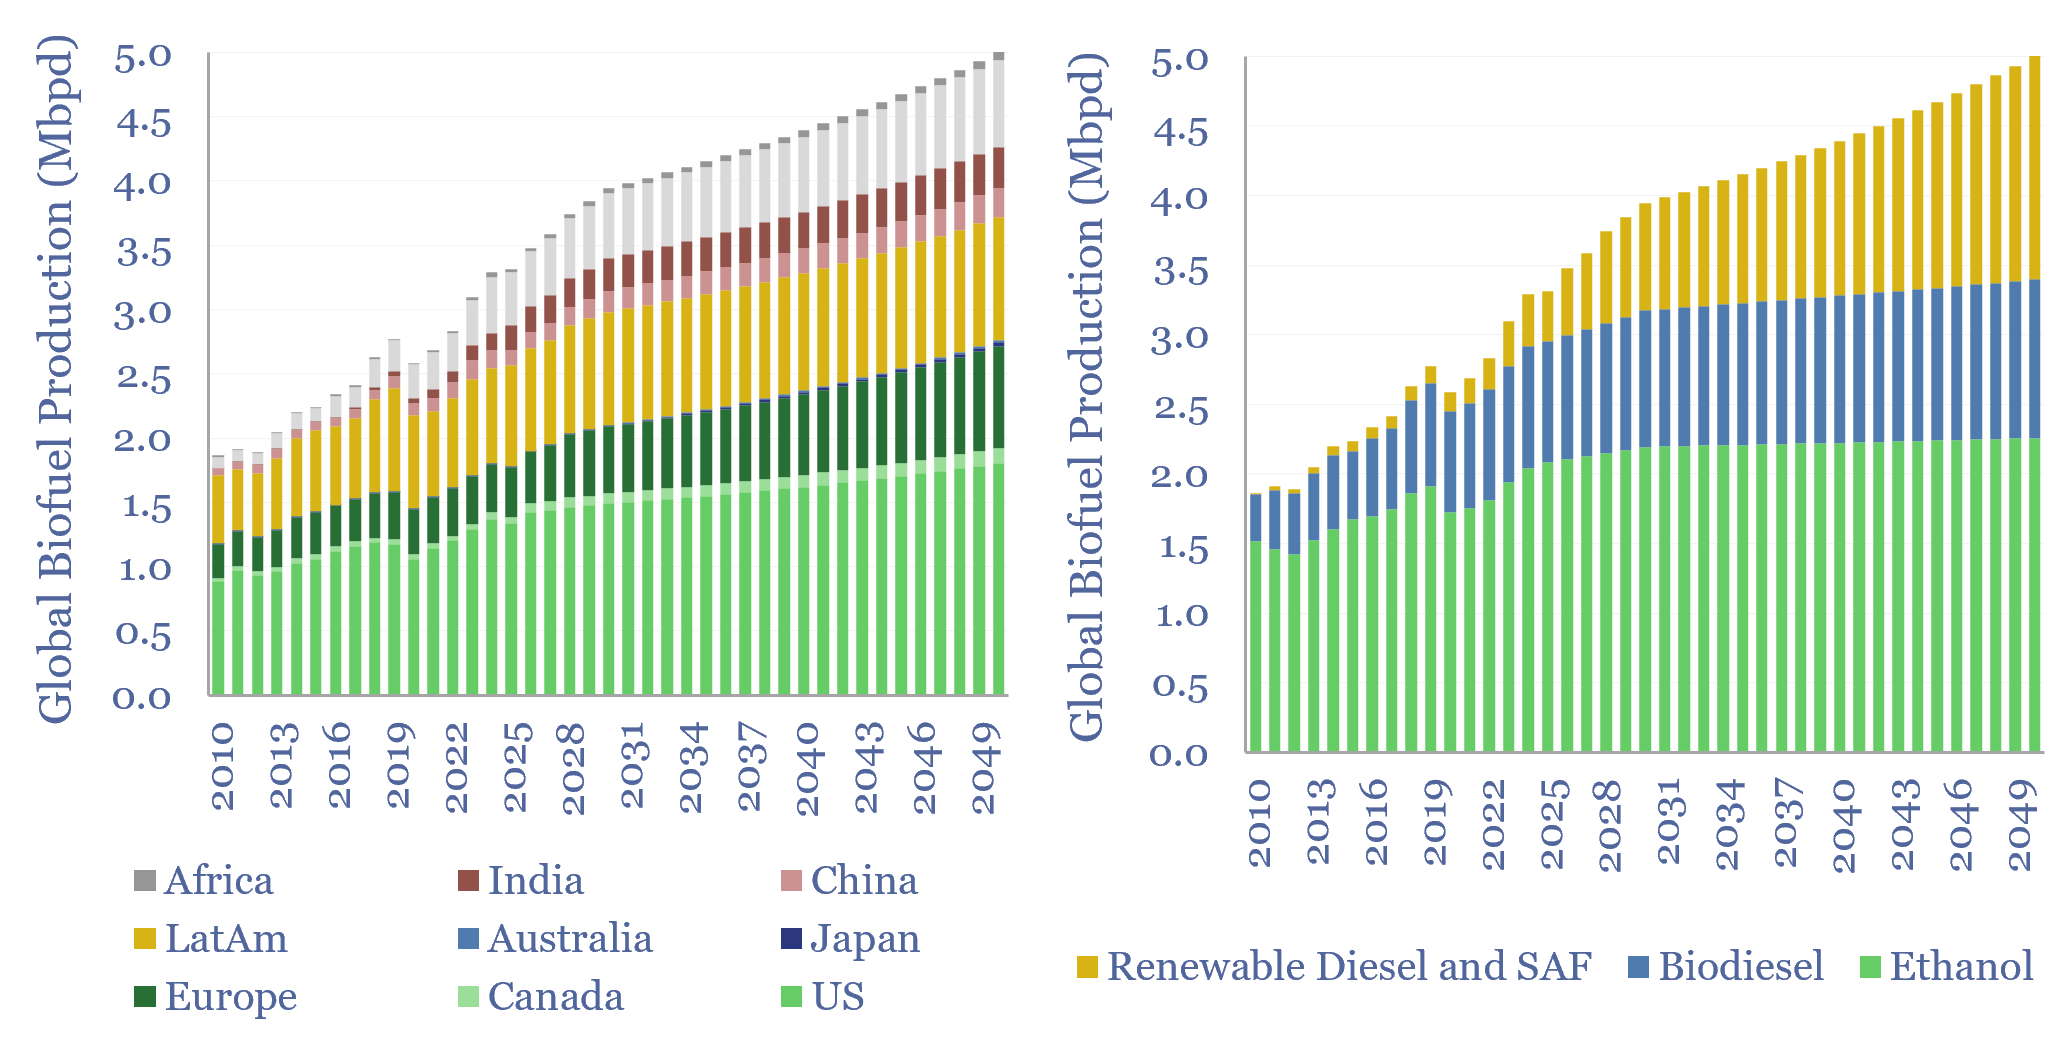
Global liquid biofuel production ran at 3.3Mbpd in 2025, of which c60% is ethanol, c30% is biodiesel and c10% is renewable diesel. 65% of global production is from the US and Brazil. Our forecasts for global liquid biofuel production reach 3.8Mbpd by 2030 and 5Mbpd by 2050, with 75% of the growth in renewable diesel.
Download the Model?
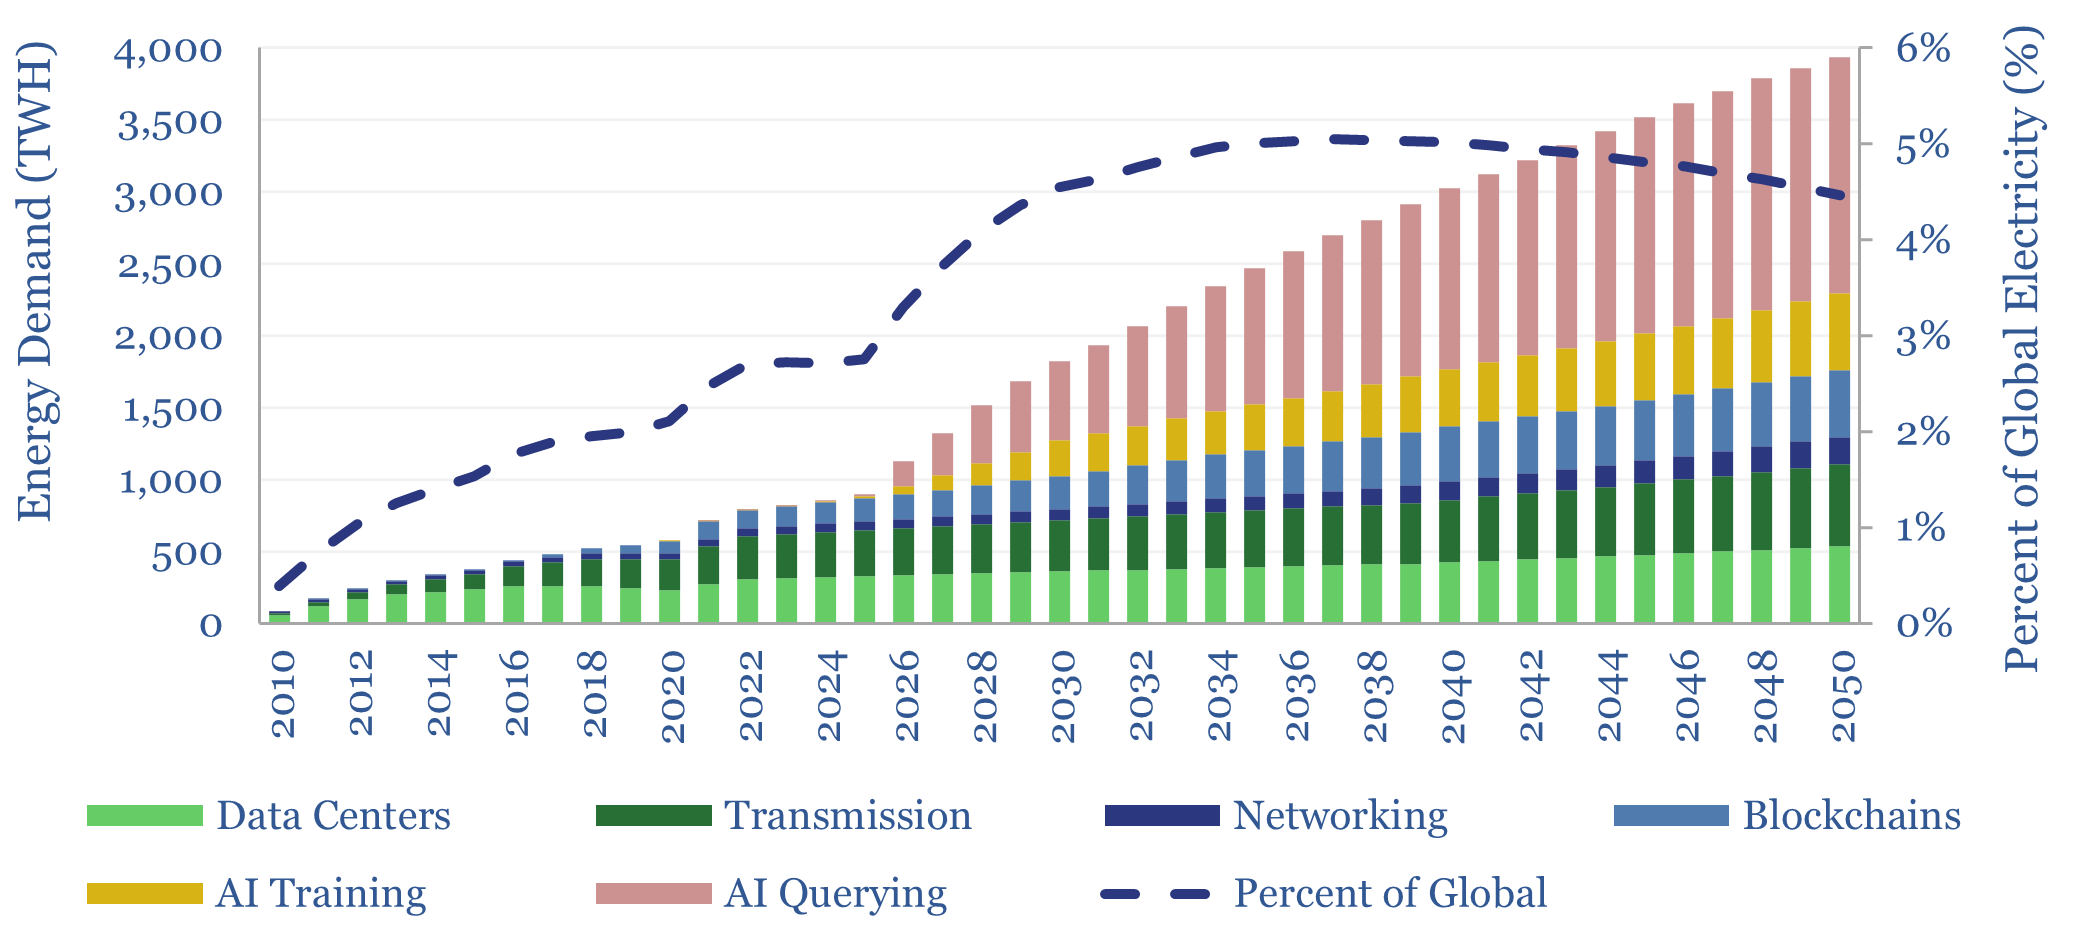
This data-file forecasts the energy consumption of the internet, rising from 800 TWH in 2022 to 2,000 TWH in 2030 and over 4,000 TWH by 2050. The main driver is the energy consumption of AI, plus blockchains, rising traffic, and offset by rising efficiency. Input assumptions to the model can be flexed. Underlying data are from technical papers.
Download the Model?
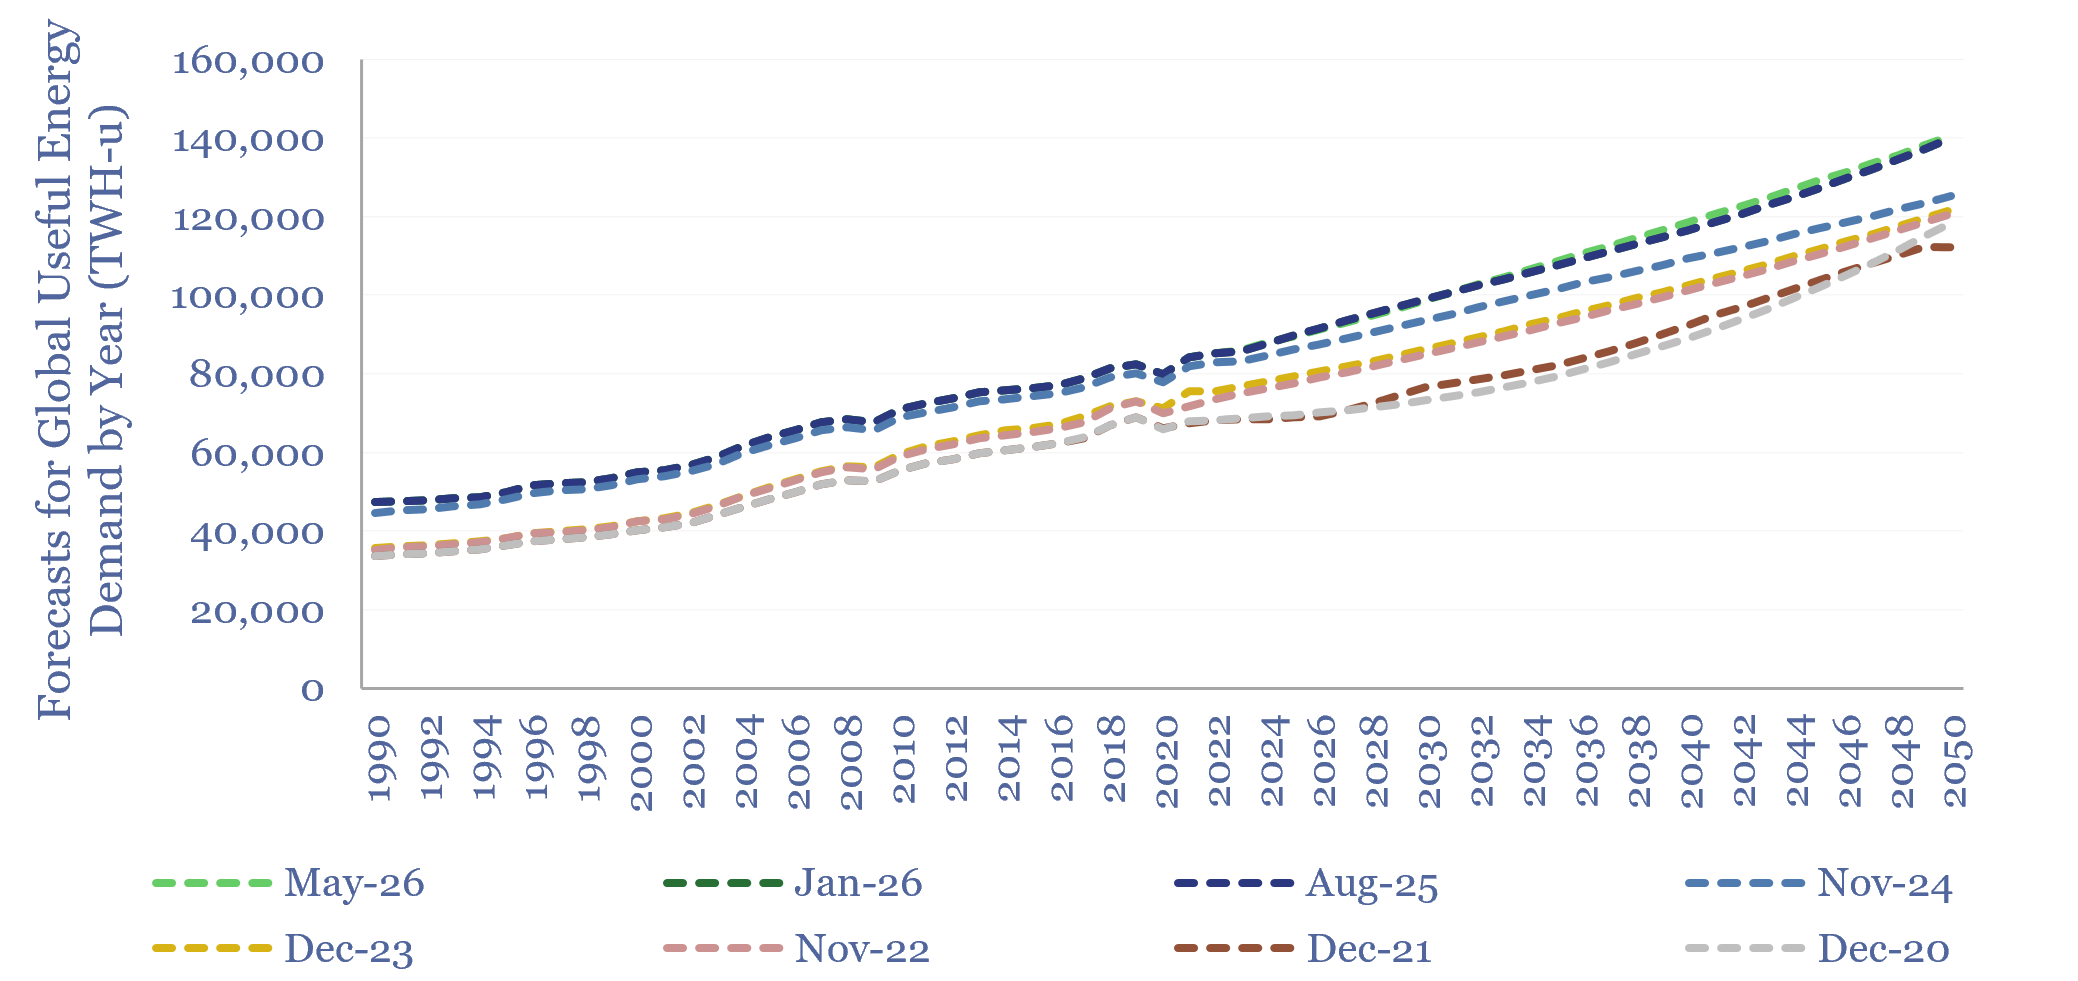
This data-file captures the forecast revisions, over time, in our various energy supply-demand models. Over the past seven years, we have consistently and enormously increased our forecasts for solar and coal. We have also repeatedly raised our forecasts for global oil and electricity use. Conversely, we have seen slower growth in gas and EVs, and to a lesser extent, nuclear and wind. Perhaps these trends continue?
Download the Model?
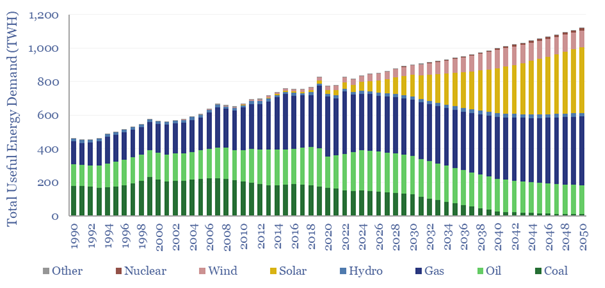
Global electricity supply-demand is disaggregated in this data-file, by source, by use, by region, from 1990 to 2050, triangulating across all of our other models in the energy transition, and culminating in over 50 fascinating charts, which can be viewed in this data-file. Global electricity demand rises 3x by 2050 in our outlook.
Download the Model?
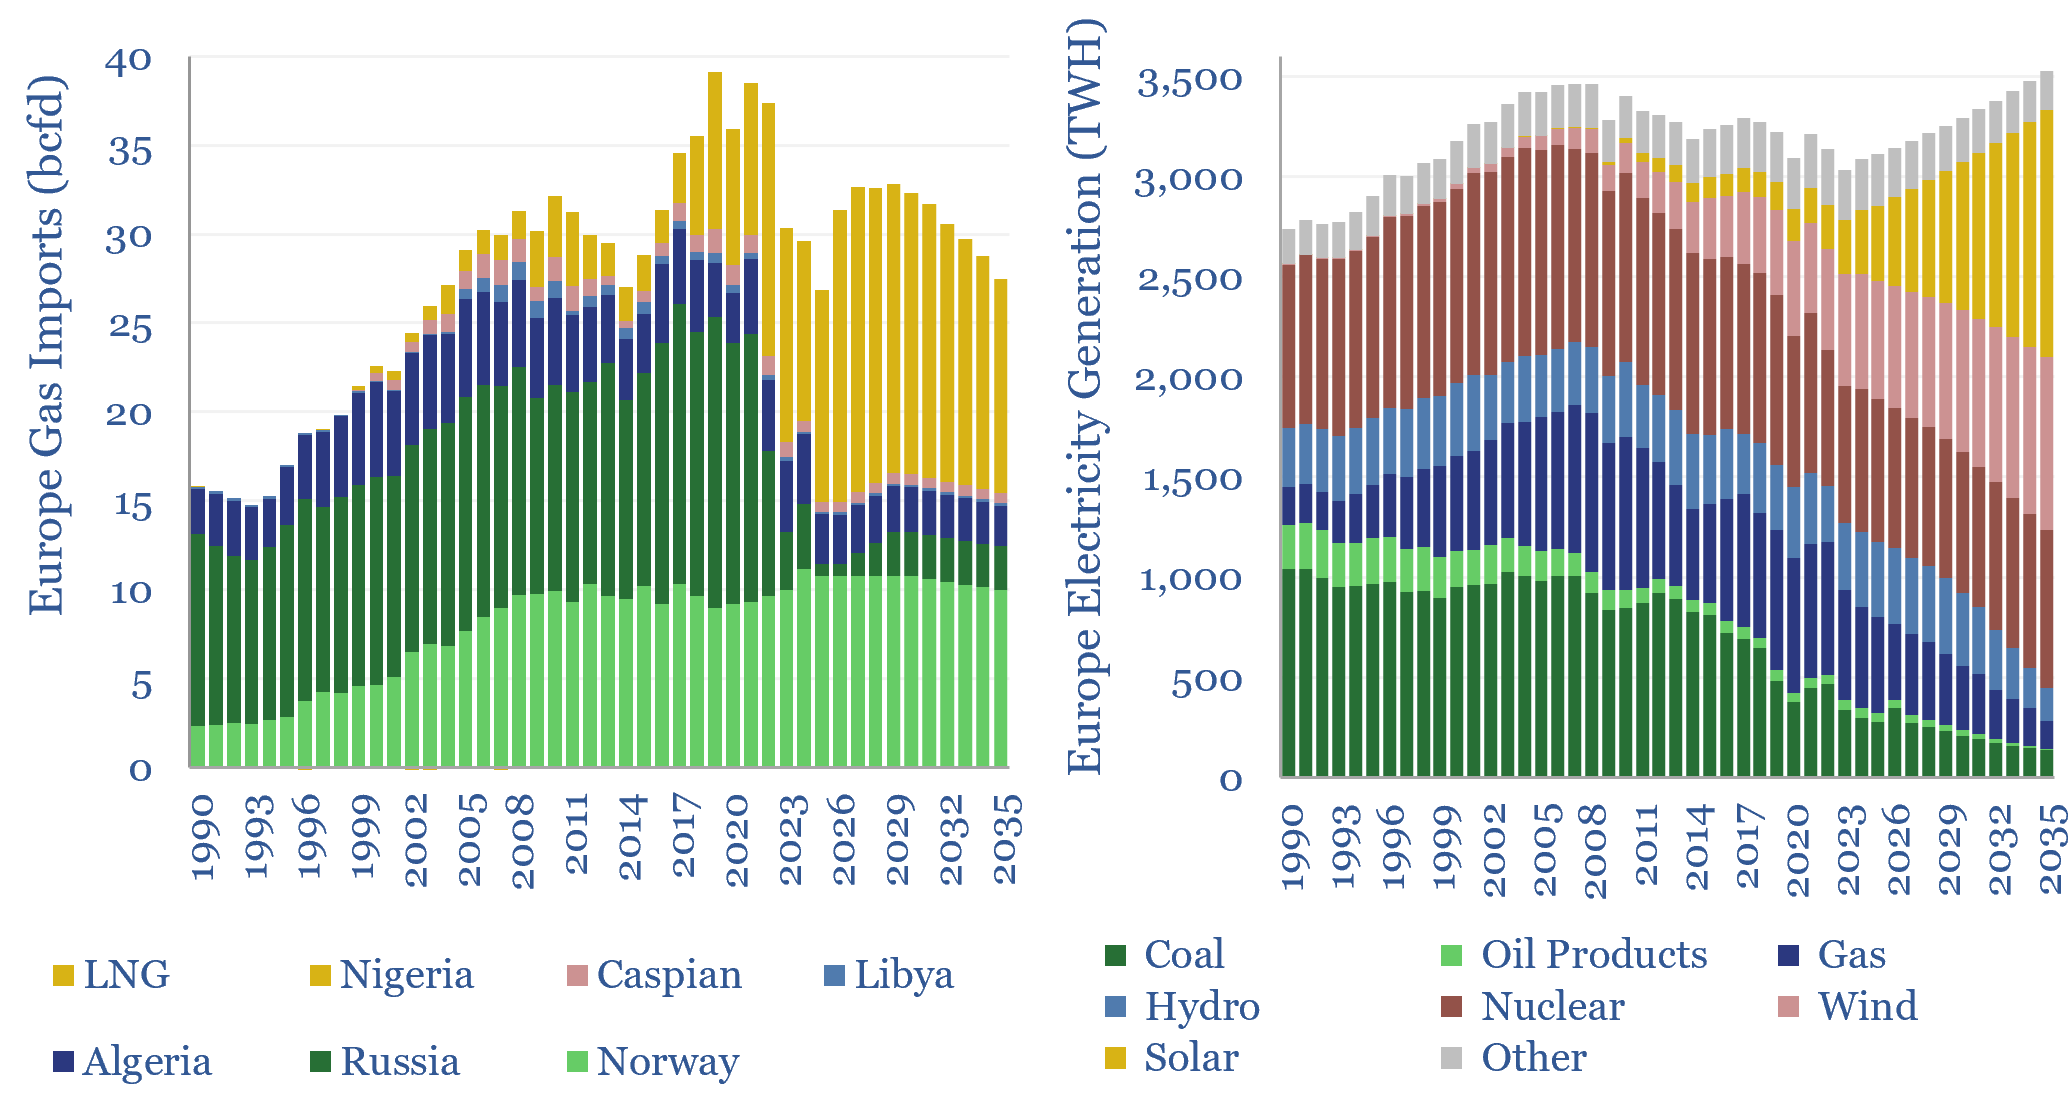
This data-file is our European gas supply-demand model. Balances are assessed in European gas and power markets from 1990 to 2035, reflecting all of our research into Europe’s energy transition. 2024-25 gas markets were supported by inventory draw-downs, but LNG imports step up from 110MTpa to 120MTpa through 2030, before softening again through 2035.
Download the Model?
This data-file is our China Energy Model and China CO2 Model, disaggregating China’s energy demand by industry, across coal, oil, gas, wind, solar, hydro and nuclear, across c200 lines, from 2000-2060, with 20-input variables that can be stress-tested. By 2050, useful energy demand rises by 38%, electricity demand doubles, and CO2 falls back by 40%.
Download the Model?
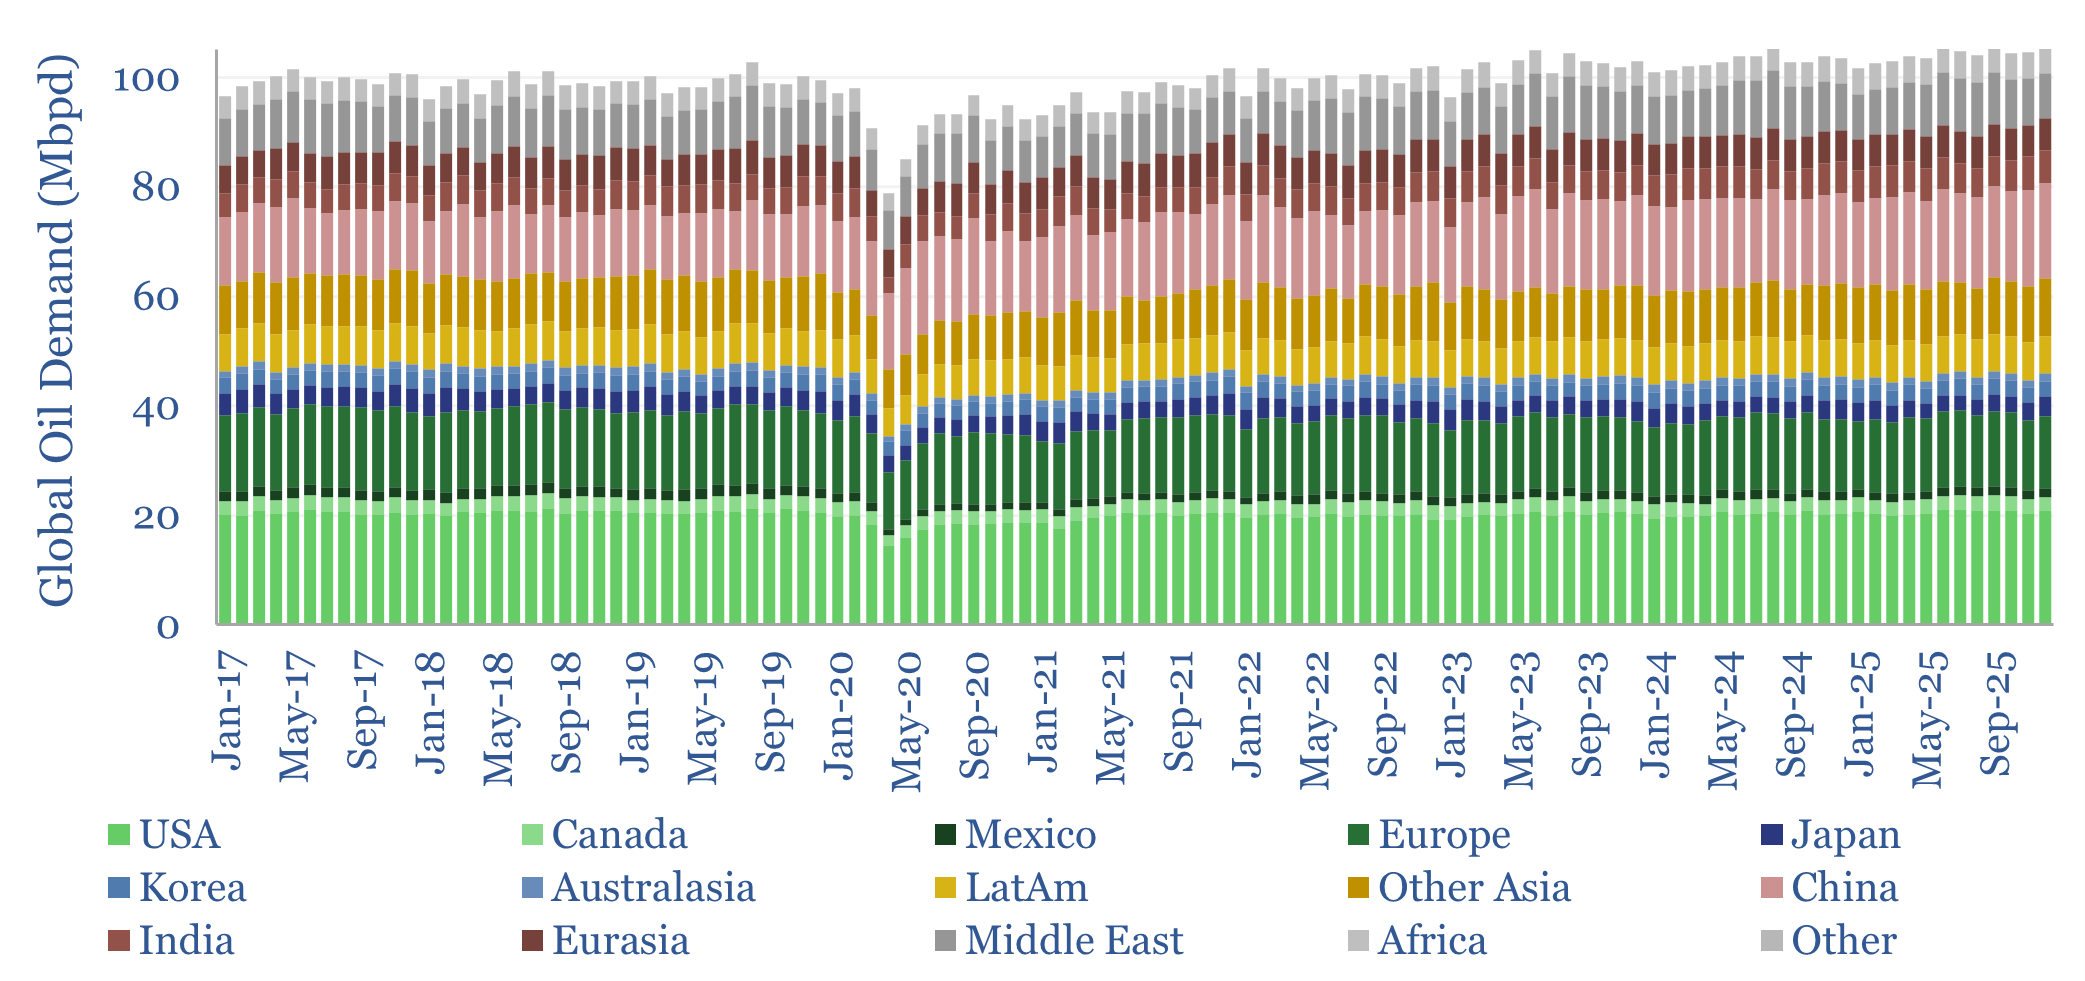
This data-file breaks down global oil demand, country-by-country, product-by-product, month-by-month, across 2017-2025. Global oil demand ran at 104 Mbpd in 2025, for +1.0 Mbpd of growth. For perspective, global oil demand rose at +1.2Mbpd per year in the 30-years from 1989->2019, so there is not much evidence, on face value, that “peak oil is nigh”.
Download the Model?
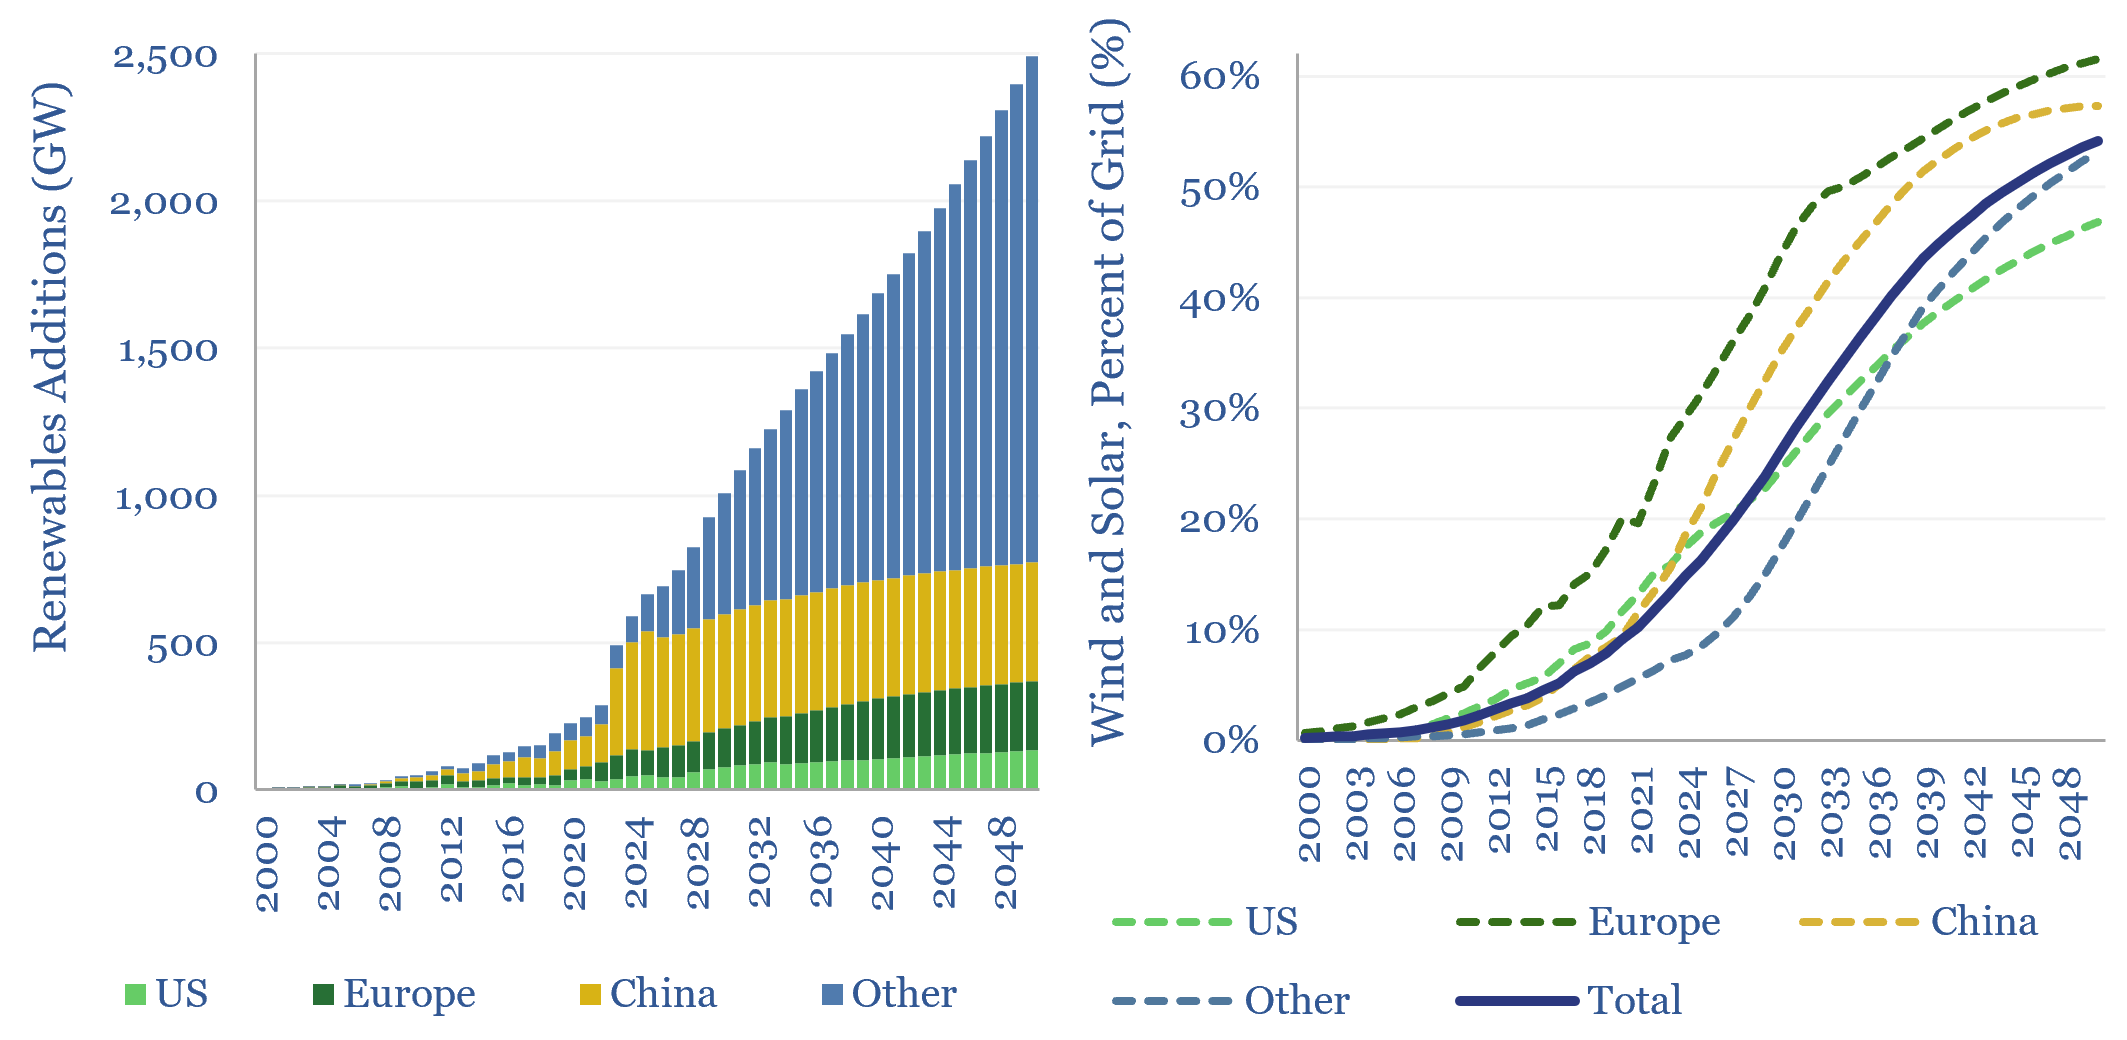
Global wind and solar capacity additions reached 630GW pa (AC-basis) in 2025, which is 3x 2020 levels and 10x 2011 levels. The pace of gross wind and solar capacity additions can rise by a further 3x by 2050, bringing wind and solar to 55% of a greatly expanded global power grid by 2050. Most of the upside is in solar.
Download the Model?
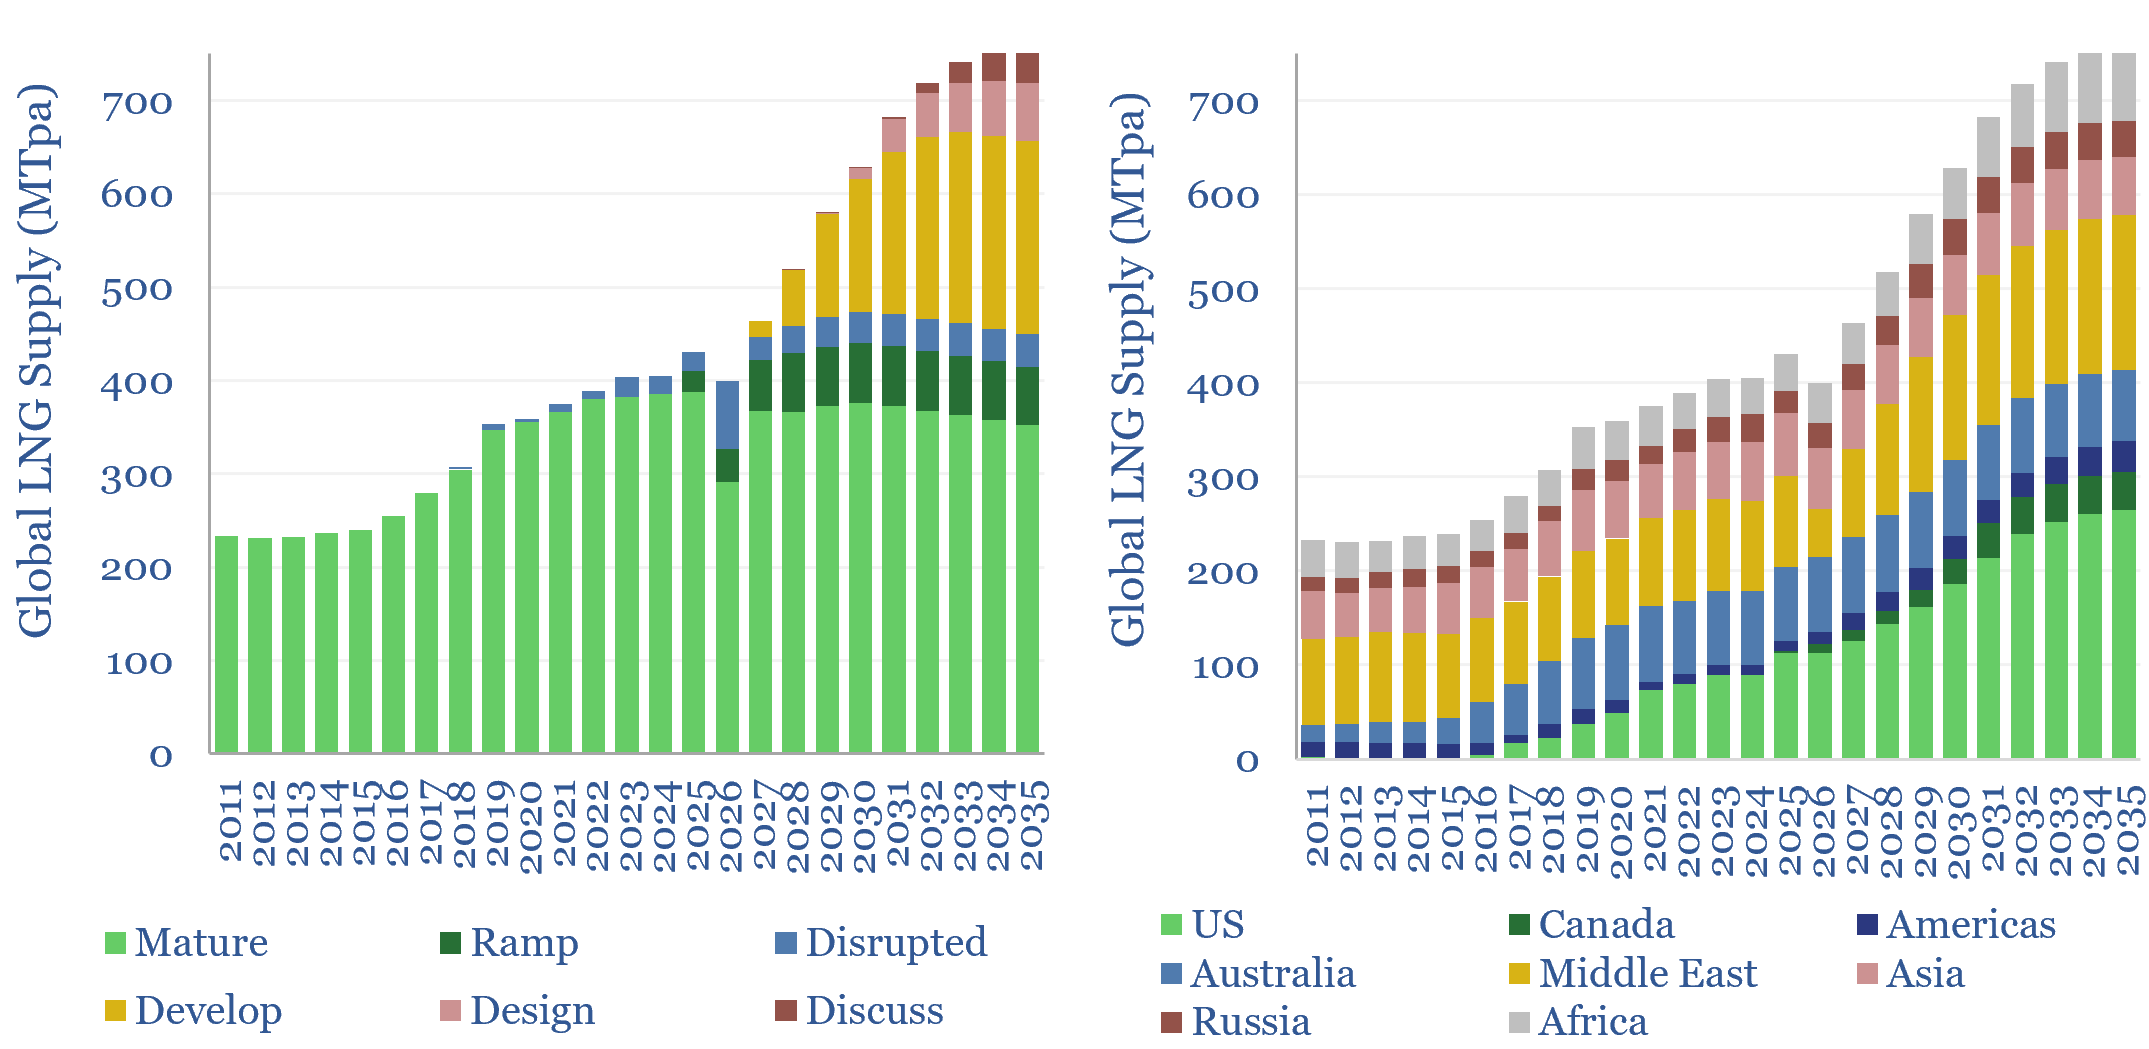
Global LNG output ran at 430MTpa in 2025. This model estimates global LNG production by facility across 200 LNG facilities and projects. Our latest forecasts are that global LNG demand will rise at a 6% CAGR, to reach 760MTpa by 2035, for an absolute growth rate of +30MTpa per year. There is a construction boom underway.
Download the Model?
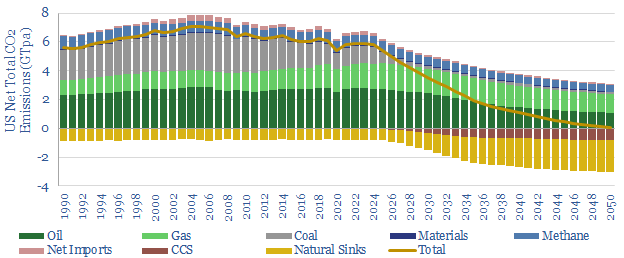
The US consumes 25,000 TWH of primary energy per year, which equates to 13,000 TWH of useful energy, and emits 6GTpa of CO2. This model captures our best estimates for how the US energy system will involve, across oil, gas, coal, nuclear, wind, solar and efficiency gains, and thus the trajectory of CO2 emissions through 20250.
Download the Model?
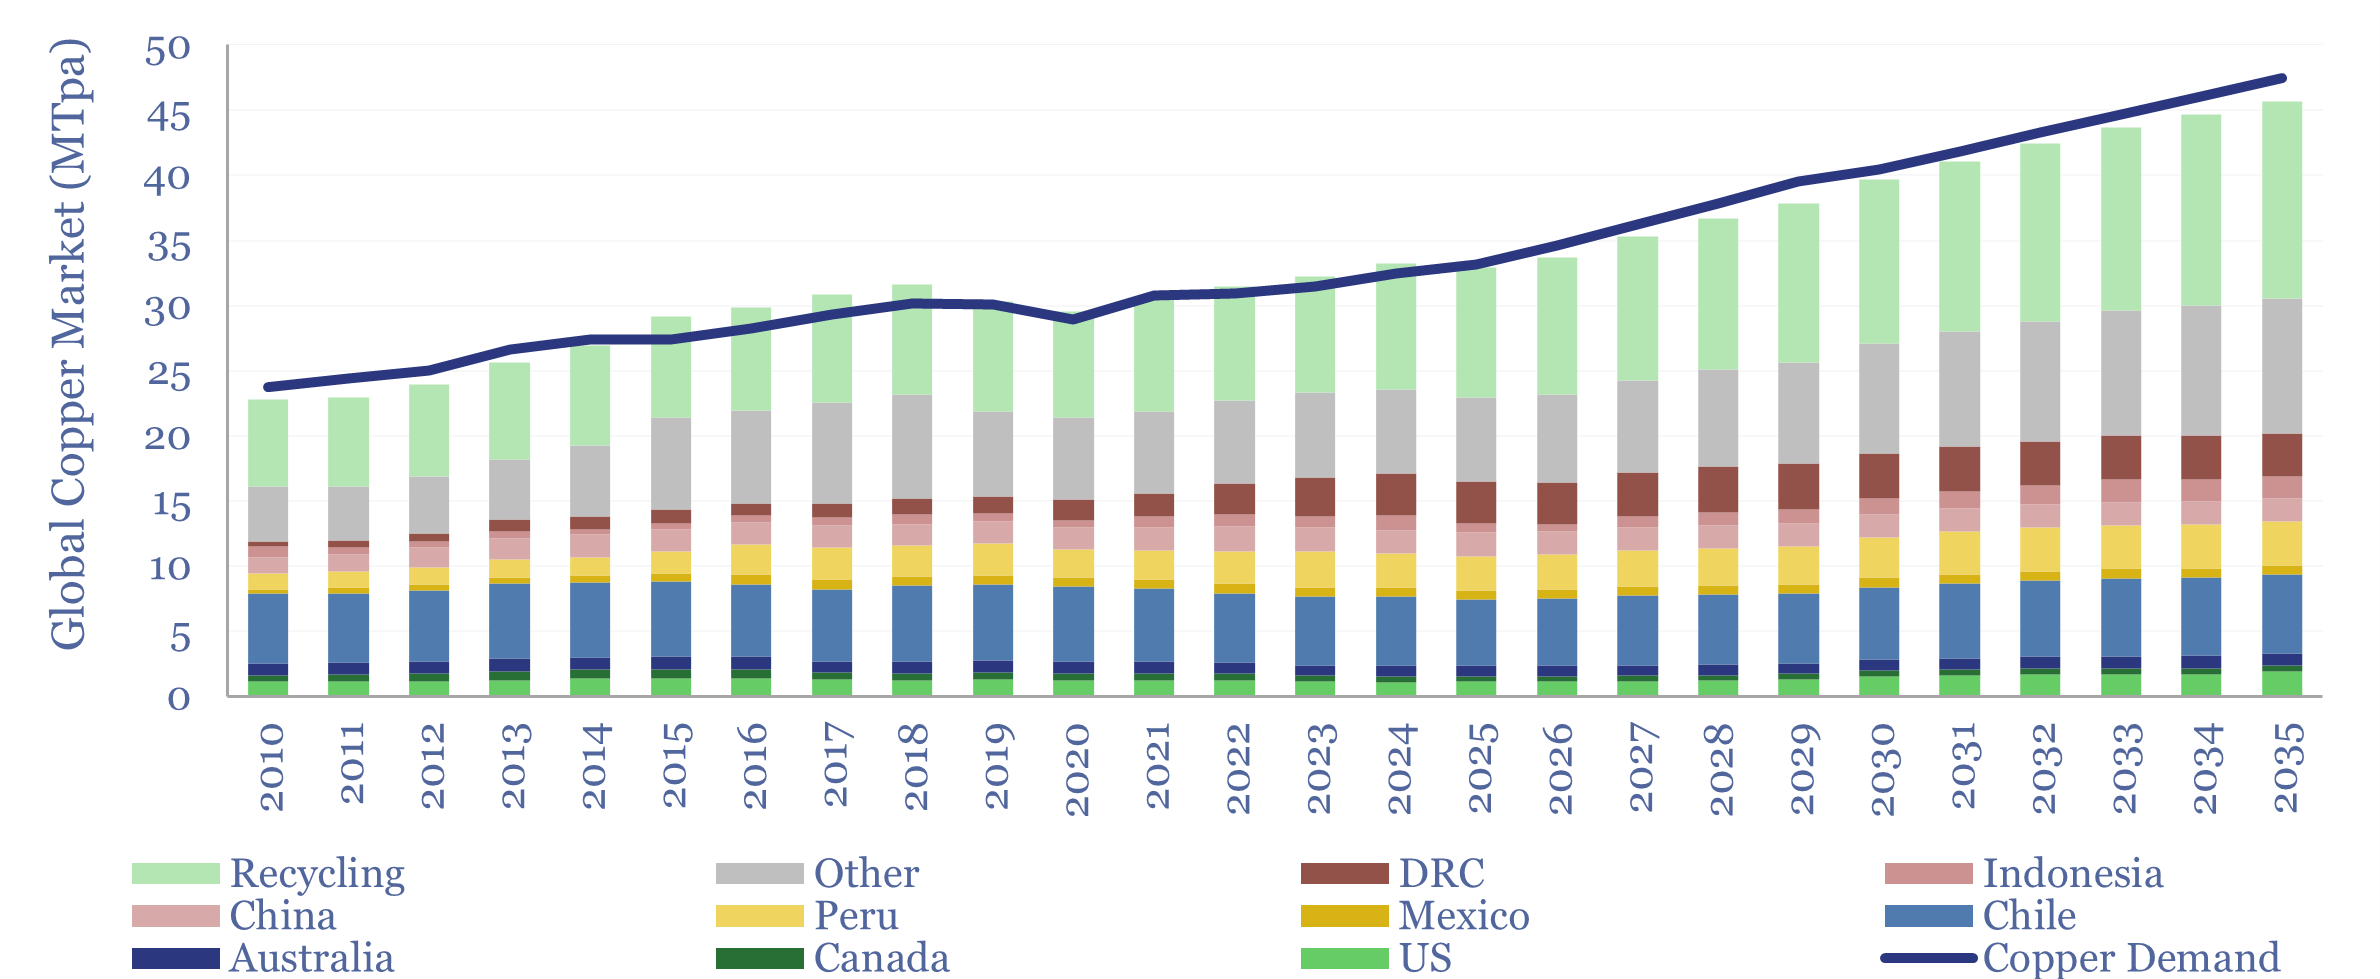
Global copper supply-demand is tabulated in this data-file, looking across 90 mines and upcoming projects, by country, and over time. Markets were 5% undersupplied when prices spiked in 2010-11, 6% over-supplied when they collapsed in 2015-16, and returned to undersupply in 2025. Undersupply persists through 2035, most likely at -3% pa, as demand grows by 3.6% pa.
Download the Model?
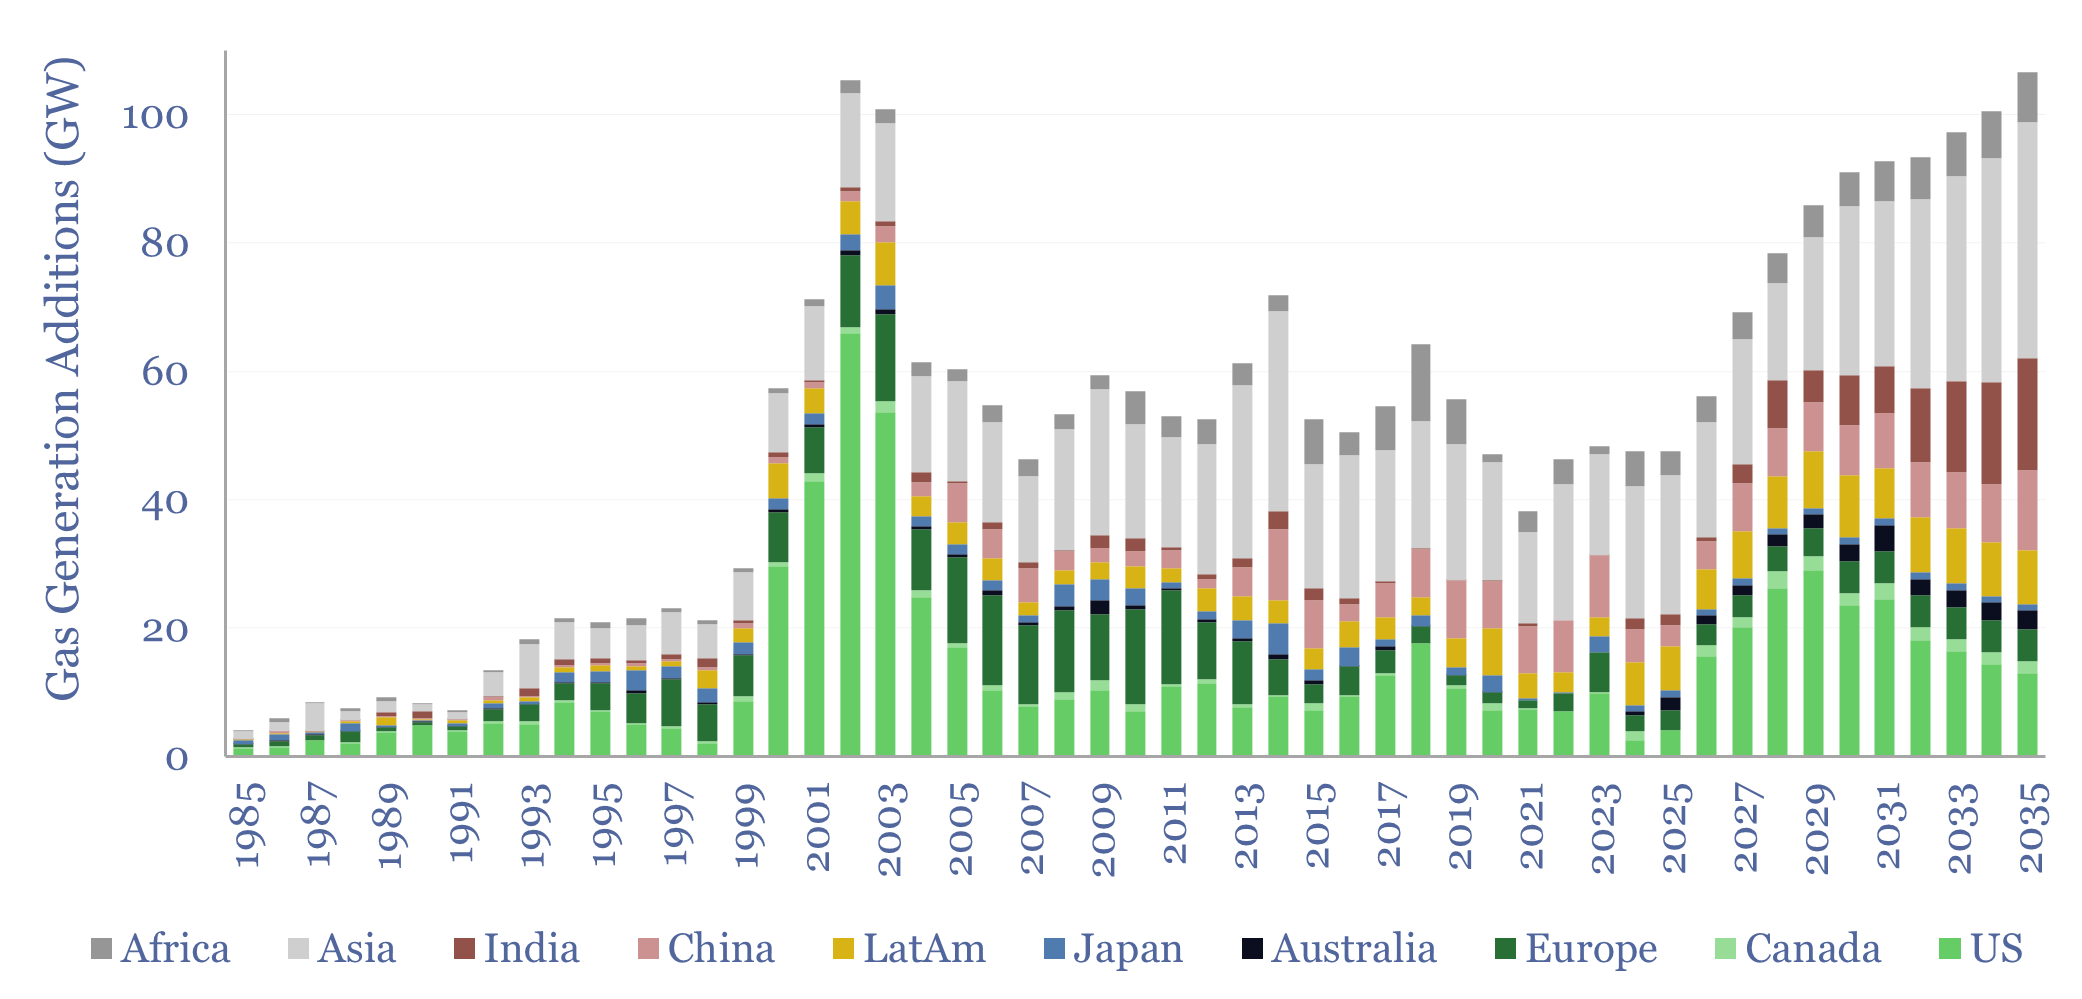
Global gas generation capacity additions averaged 50 GW pa over the decade from 2015-2024, of which the US was 20%, Europe was 10%, Asia was 50%, LatAm was 10% and Africa was 10%. Yet global gas turbine additions could double to 90 GW pa in 2025-35. This data-file estimates global gas turbine capacity by region and over time.
Download the Model?
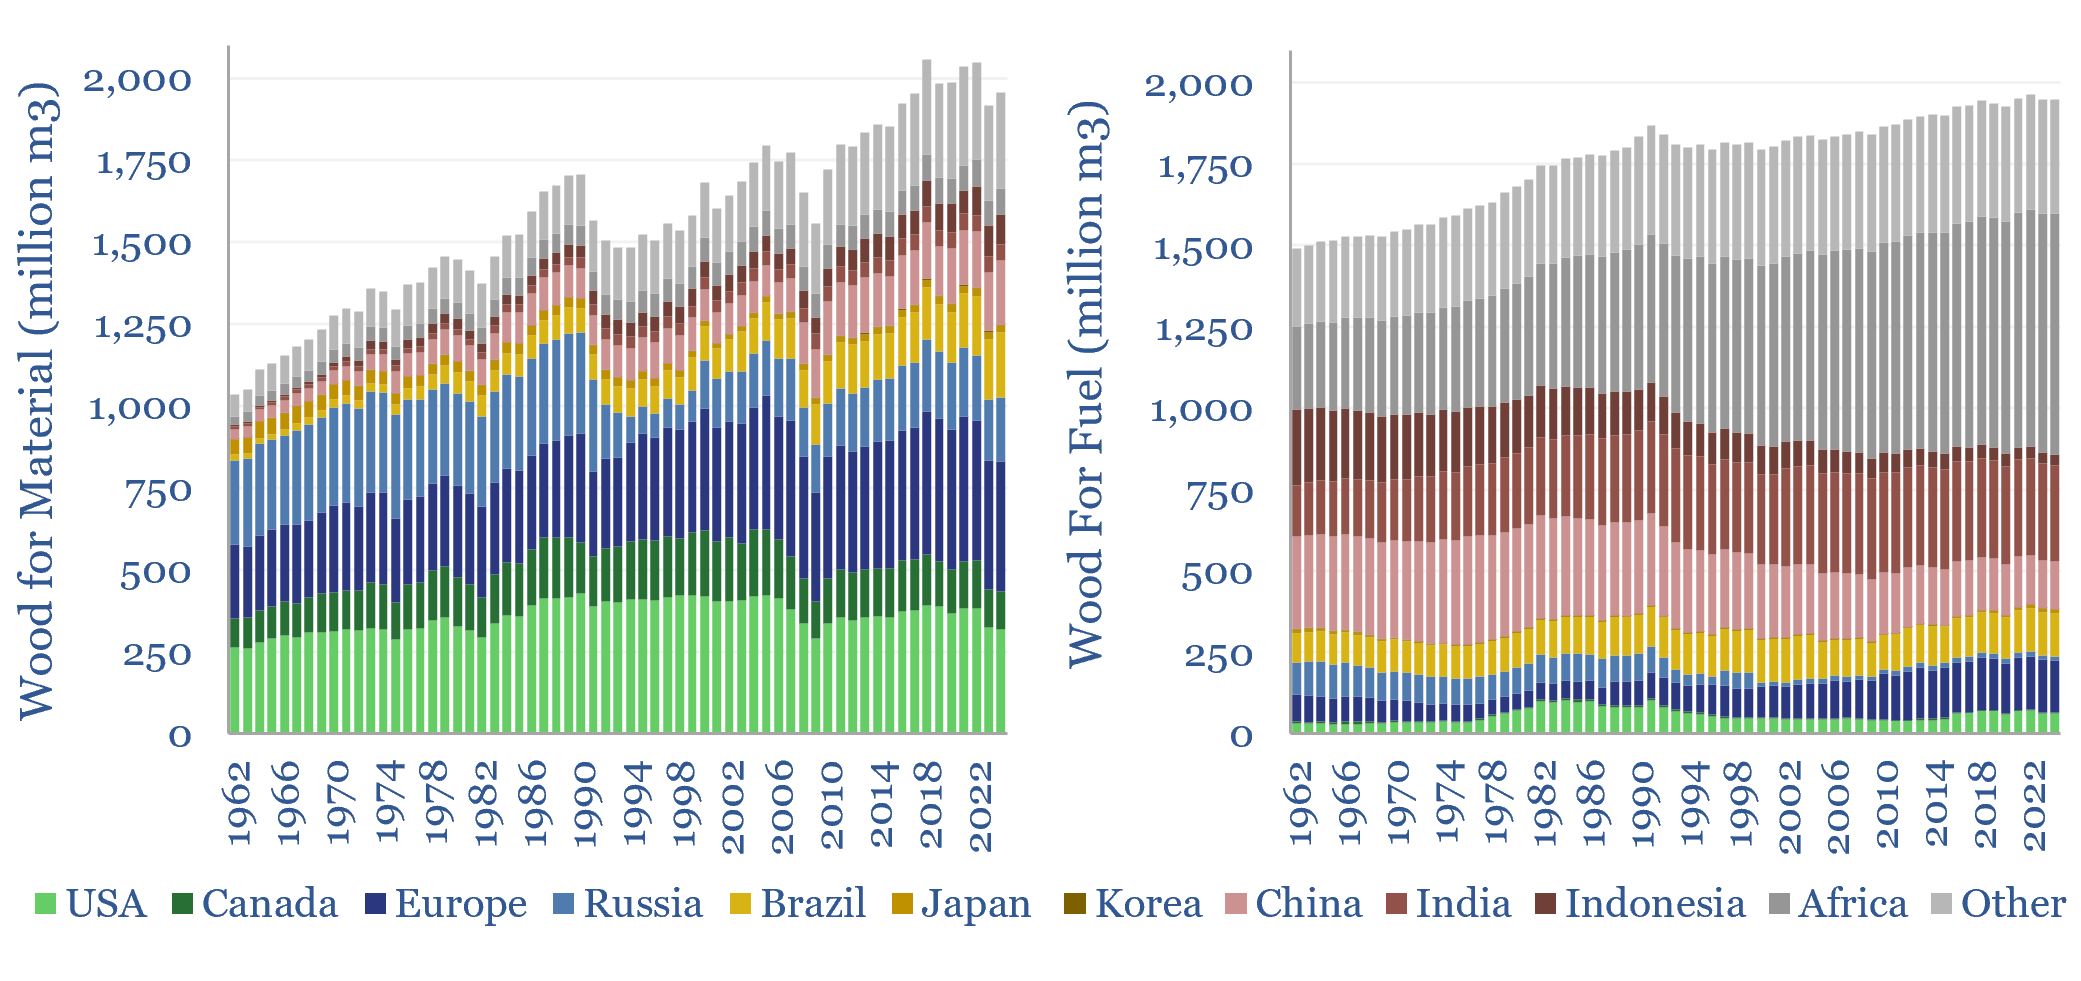
This data-file quantifies global wood production, country-by-country, category-by-category, back to 1960, using granular data from the FAO. 4bn m3 of wood is harvested per year (2GTpa by mass). There is a read-across for how commodities peak. And major upside for LNG.
Download the Model?
This model captures global energy demand by region through 2050, rising from 80,000 TWH in 2019 to 140,000 MWH in 2050. Population rises 0.6% pa. Energy use per global person rises at 1.1% pa, from 11 MWH pp pa to 15 MWH pp pa. So total demand rises at c2% pa. Meeting the energy needs of human civilization is crucial in the energy transition.
Download the Model?
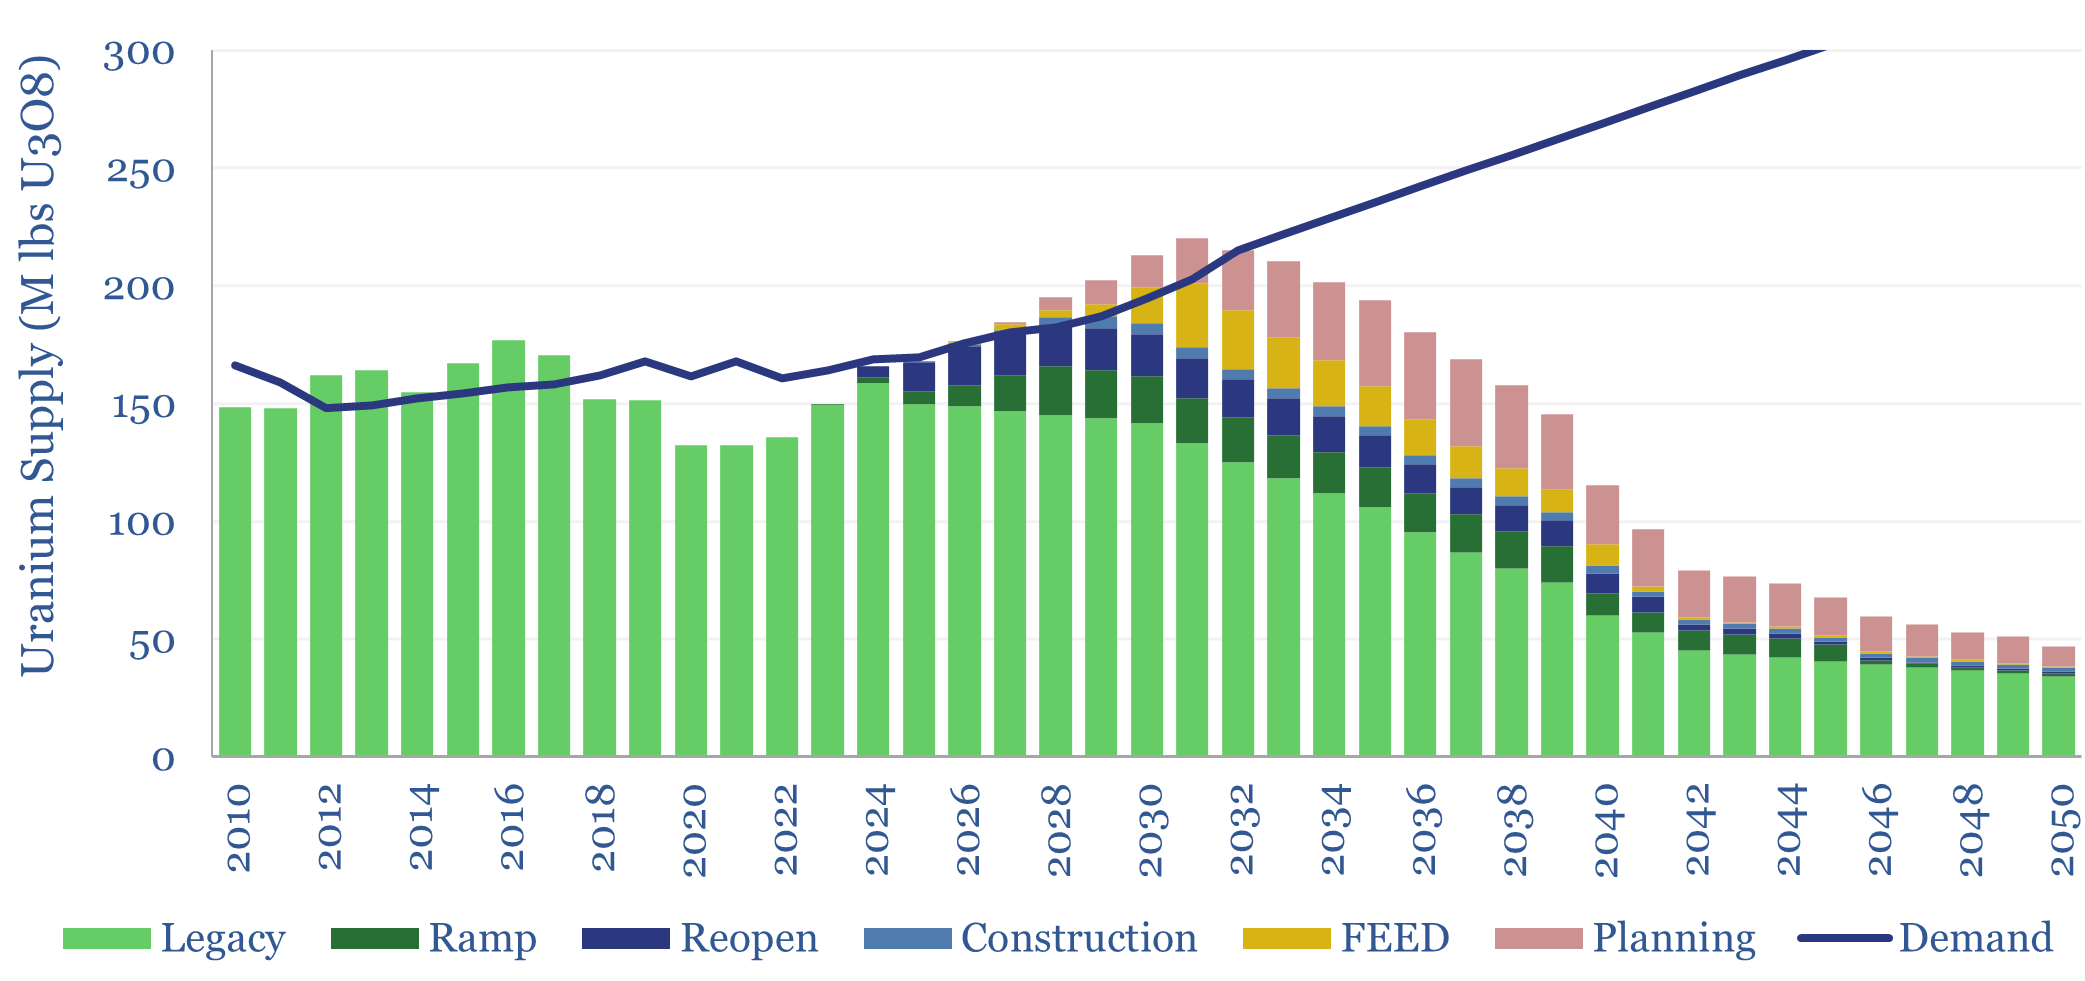
Our global uranium supply-demand model sees the market adequately supplied in 2026-30, even as demand ramps from 170M lbs pa to 210M lbs pa in 2030. However, our project risking is generous and there may be supply disruptions. What implications for broader power markets, decarbonization ambitions, and uranium prices?
Download the Model?
Global population and GDP are broken down in this data-file, across 10 key regions, with data back to 1960 and projections to 2050, as an input to all of our supply-demand models. Population rises at 0.7% pa from 8.0bn in 2023 to 9.7bn in 2050. Real global GDP rises at 2.5% from $105trn in 2023 to $200trn by 2050. Mega-trends are underway in demographics, manufacturing and defence.
Download the Model?
Global nuclear capacity, by reactor, by country, and over time, are built up in this data-file, by reviewing the construction, operation and shutdowns of 800 global nuclear reactors. After running sideways for 20-years, at 2,800 TWH pa, global nuclear generation rises at c3% pa to 2030, and c3% pa to 2050, reaching 5,600 TWH pa.
Download the Model?
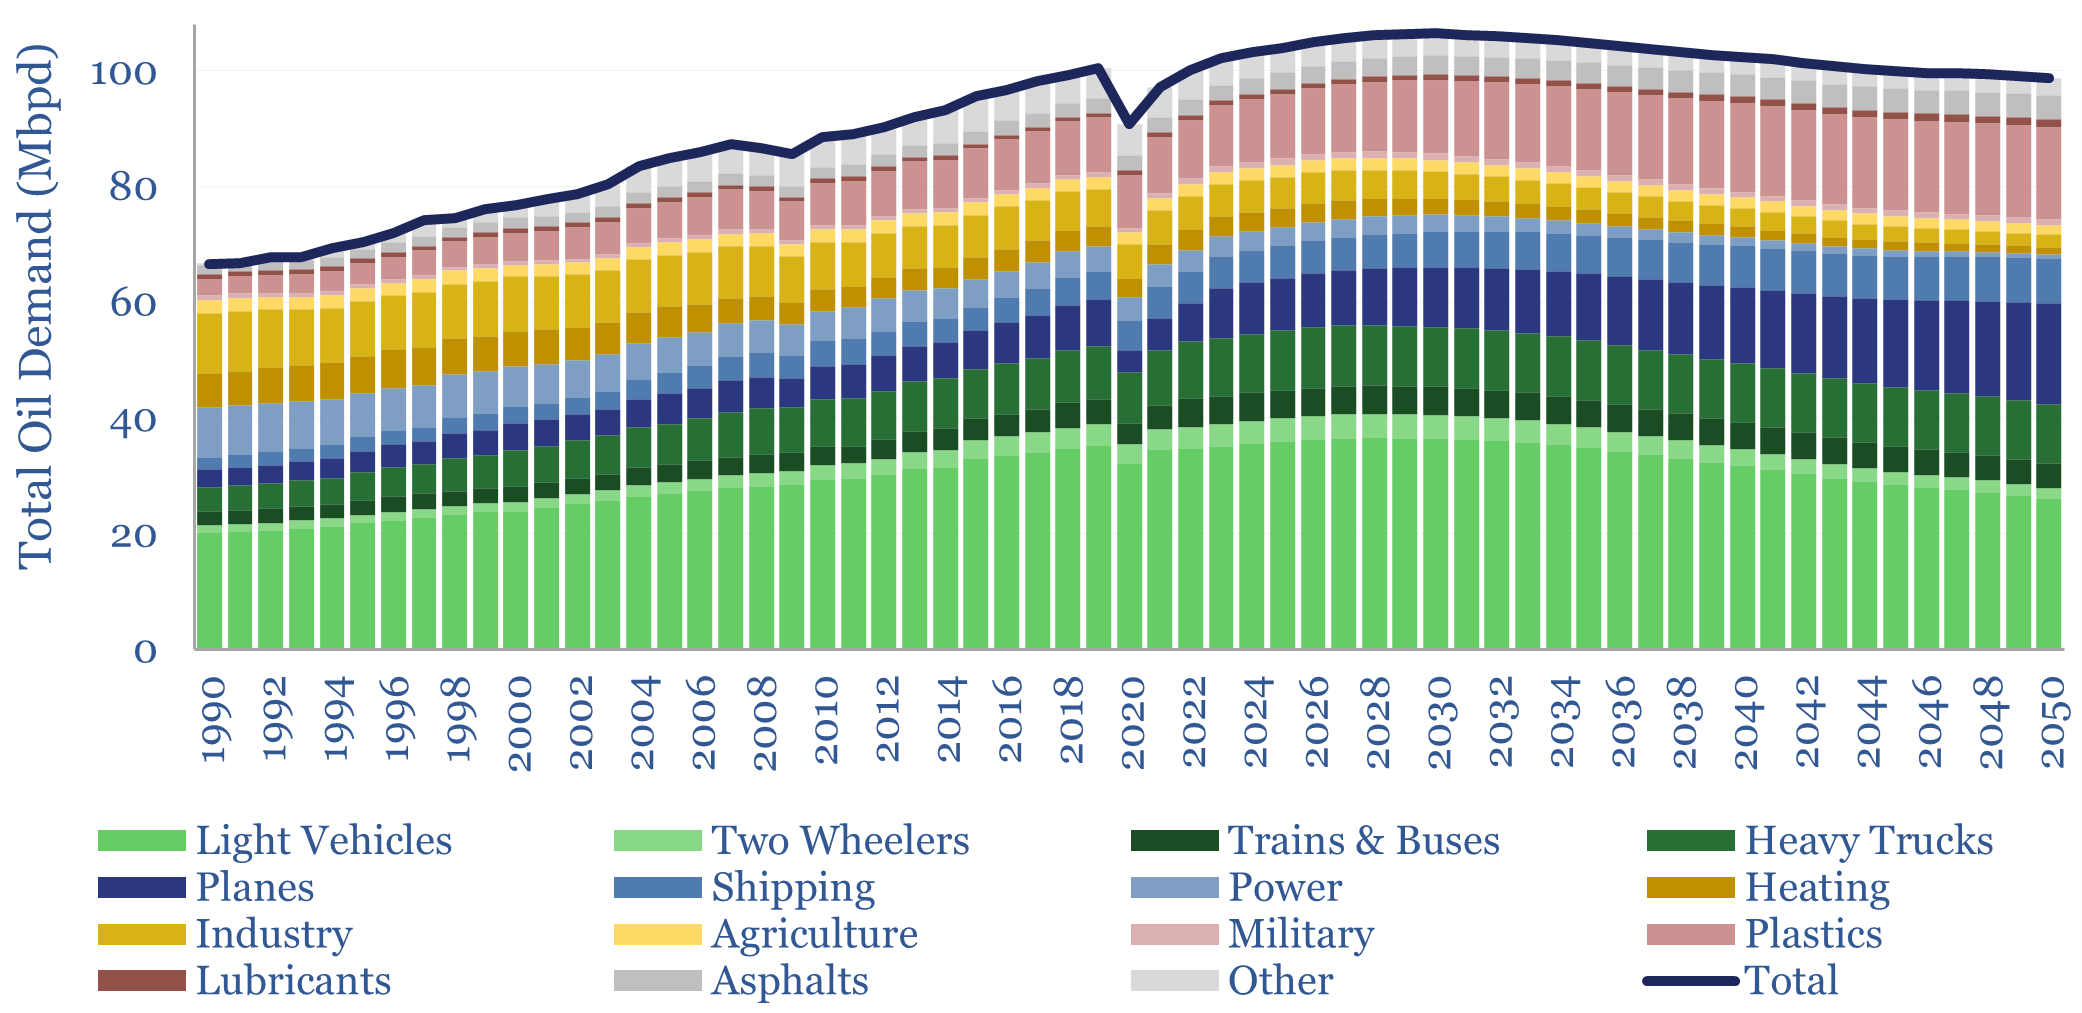
This model forecasts long-run global oil demand to 2050, by end use, by year, and by region; across the US, the OECD and the non-OECD. We see demand rising from 104Mbpd in 2024 to a plateau of 107Mbpd in 2030, then easing back to 100Mbpd by 2050.
Download the Model?
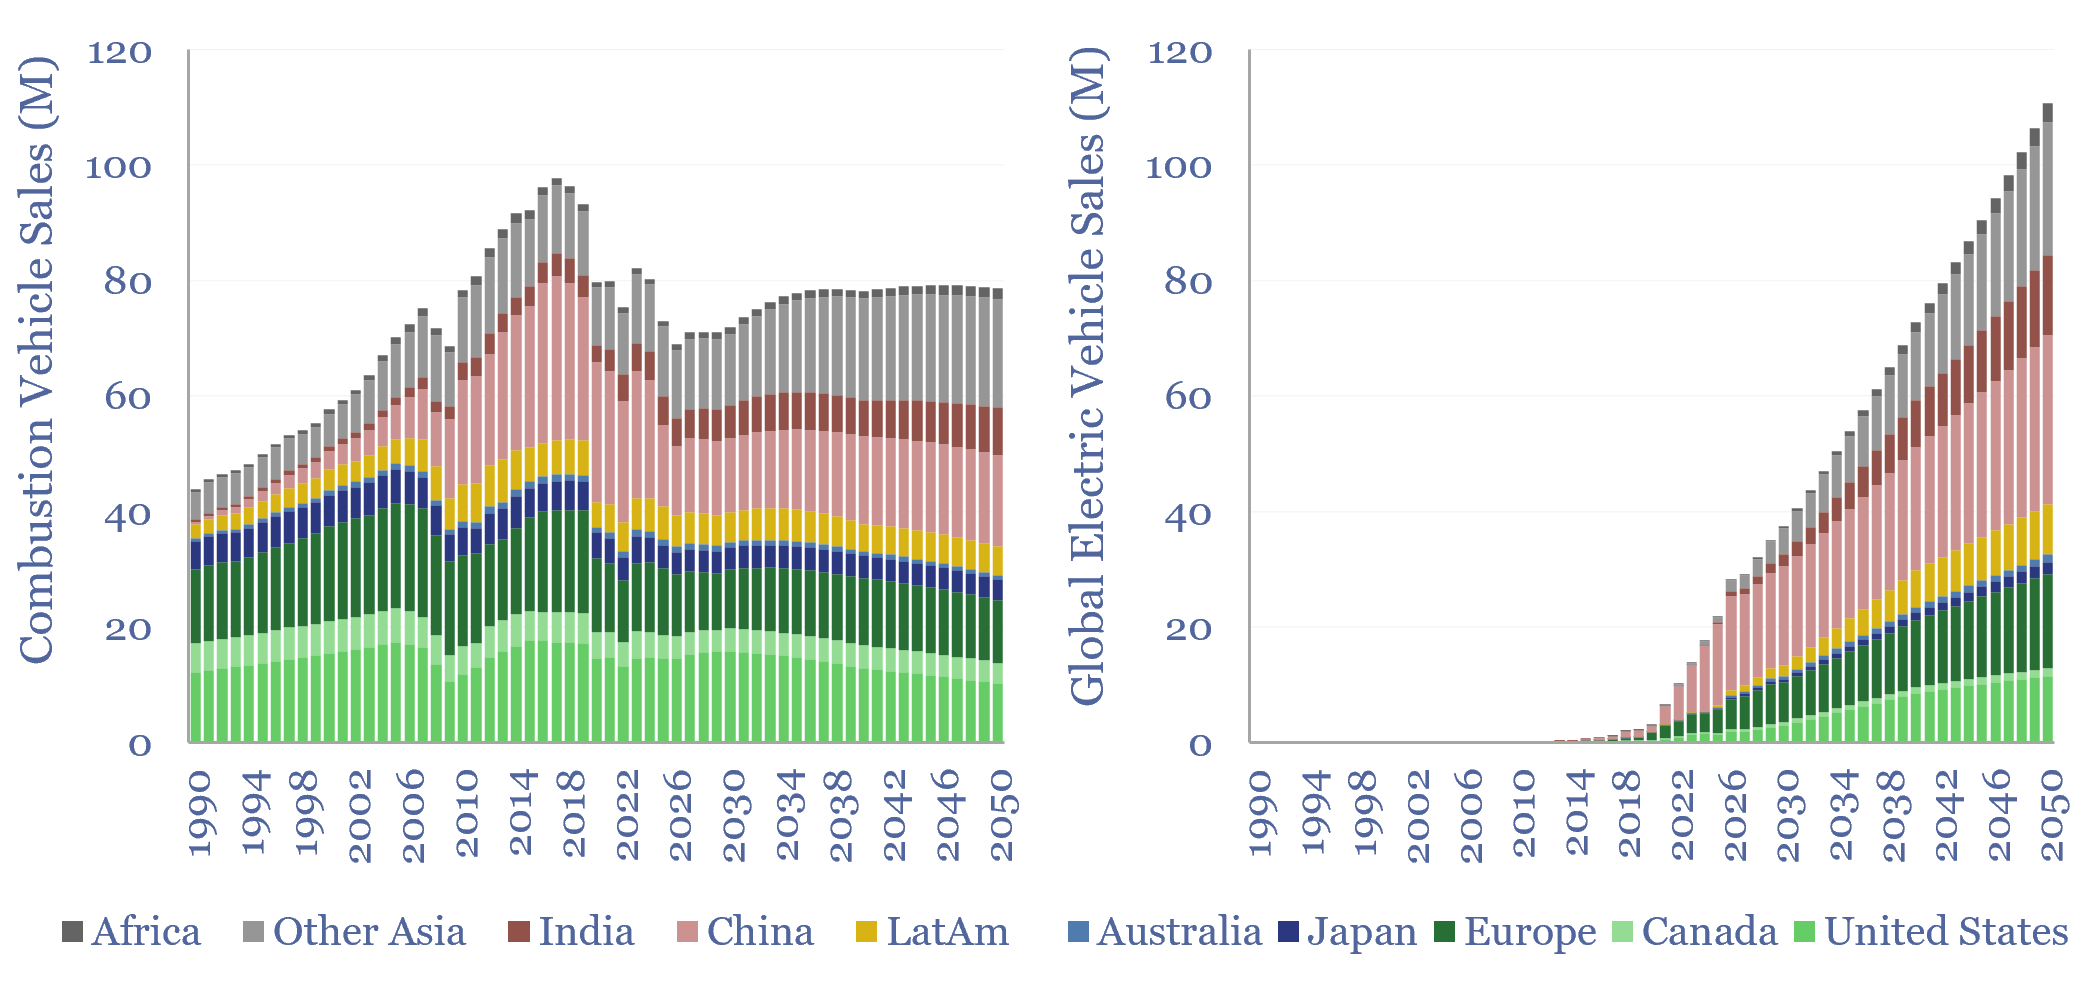
Global electric vehicle sales will ramp from c22M units in 2025 to 120M units in 2050, while combustion vehicle sales run flat at 80M units per year. This data-file forecasts global electric vehicle sales by region, the total electric vehicle fleet, and thus informs our models for long-term global oil demand.
Download the Model?
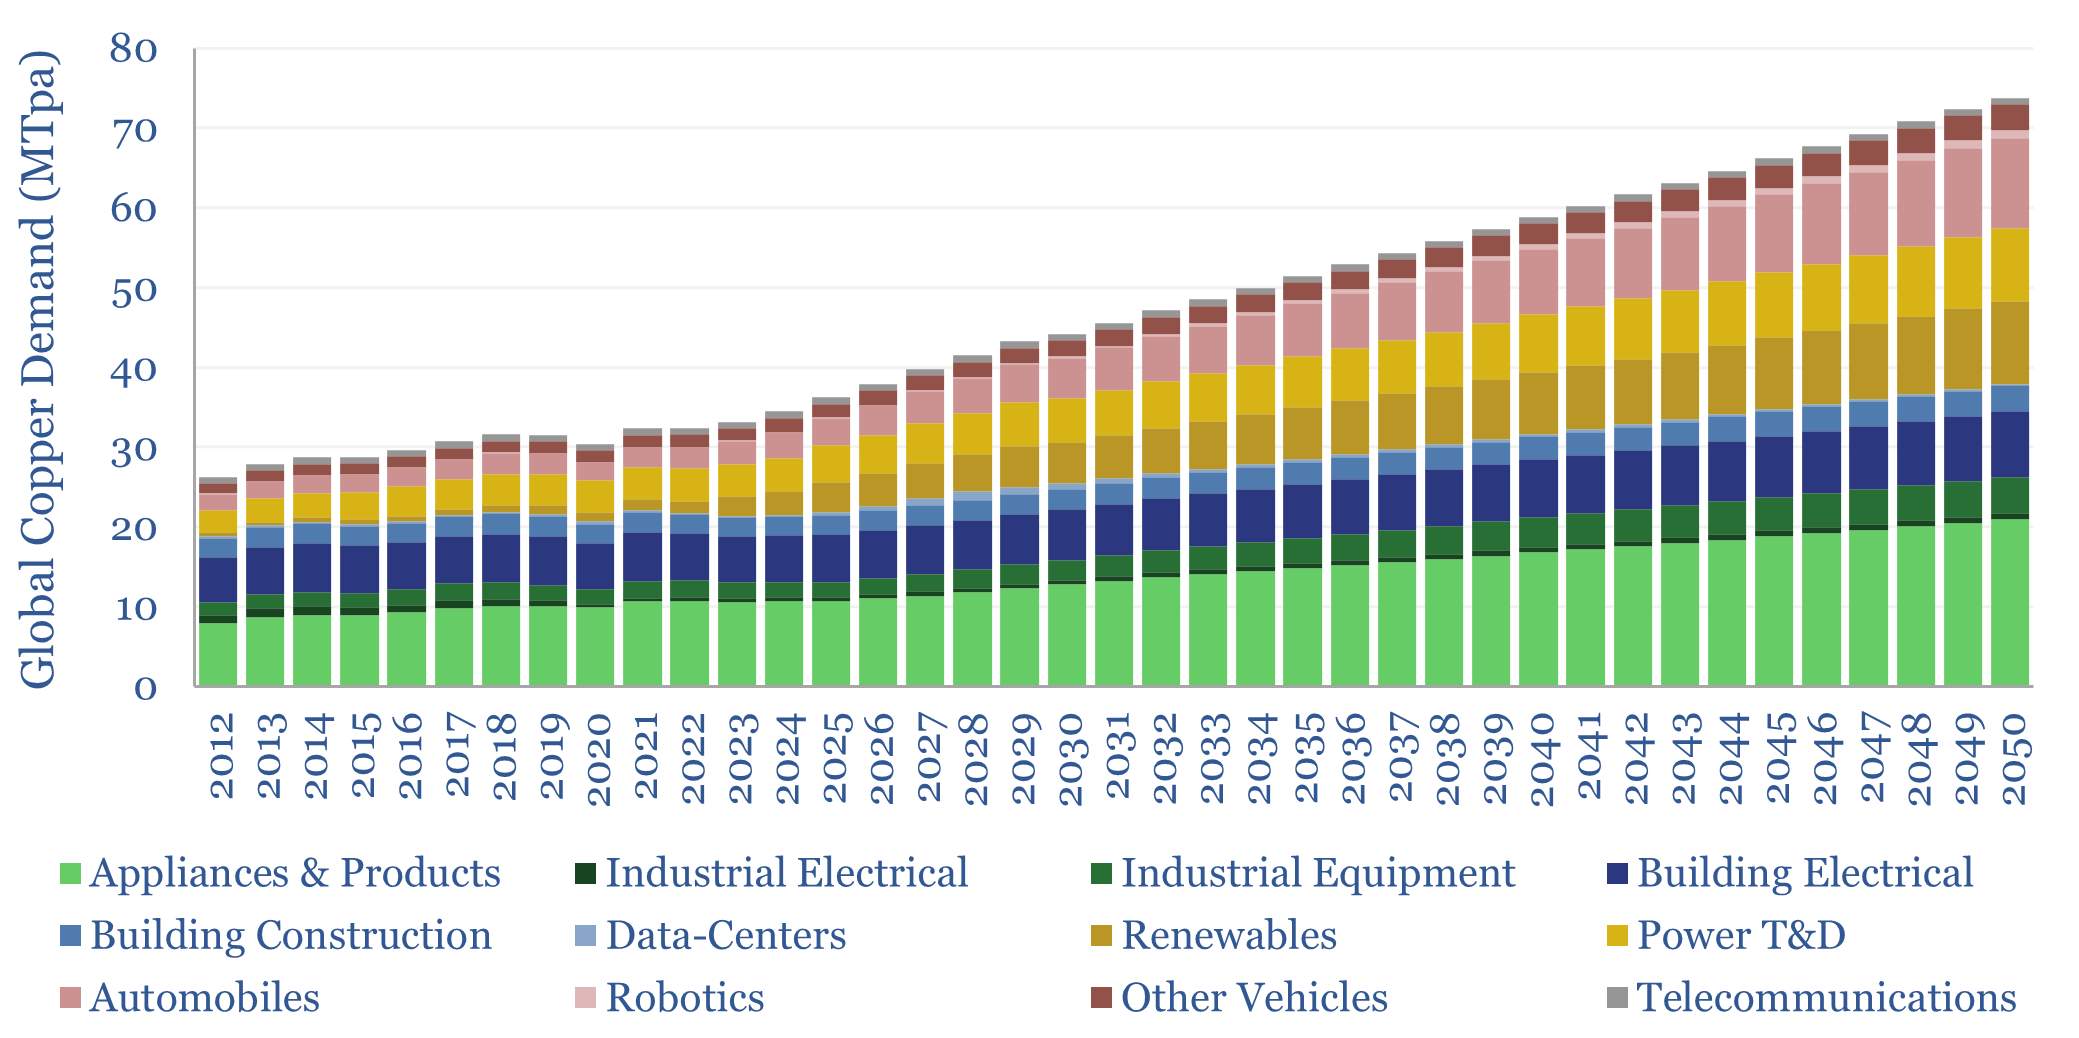
This data-file estimates global copper demand as part of the energy transition, rising from 33MTpa in 2023 to 44MTpa in 2030 and 80MTpa by 2050. Key demand drivers are solar, EVs, greater AC adoption and possibly drones and robotics. You can stress test half-a-dozen key input variables in the model.
Download the Model?
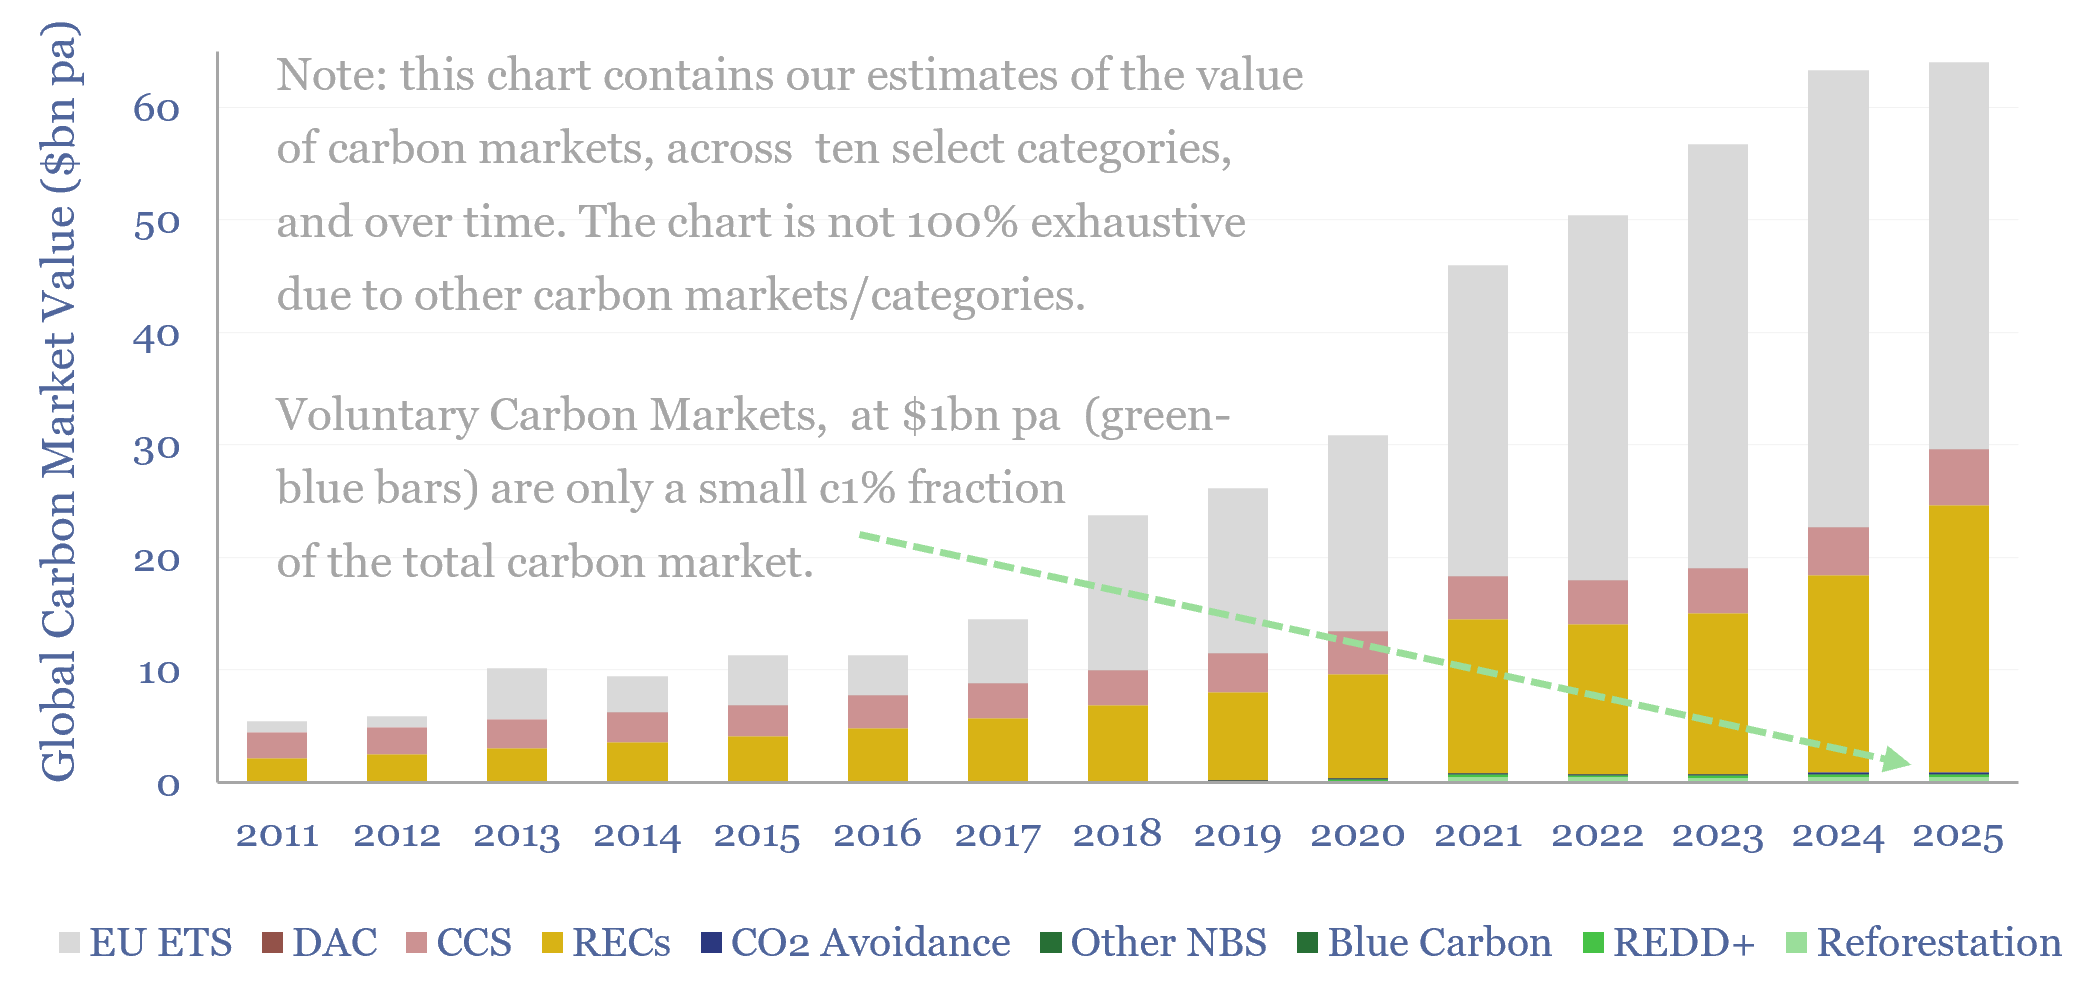
Over 400 CCS projects are tracked in our global CCS projects database. The average project is 2MTpa in size, with capex of $800/Tpa. The largest CO2 sources are hubs, gas processing, blue hydrogen, gas power and coal power. The most active countries are the US, UK, Canada and Europe. However, slow project progress in 2025 has halved our forecasts for 2035’s global CCS capacity to 200MTpa.
Download the Model?
Global lithium production, by project, by country, by resource type, and over time, are aggregated in this data-file, by tabulating details of each project. There is spare capacity in 2026, especially from Australian mine projects, but the current project pipeline sugggests a 20-30% market deficit in 2030-35.
Download the Model?
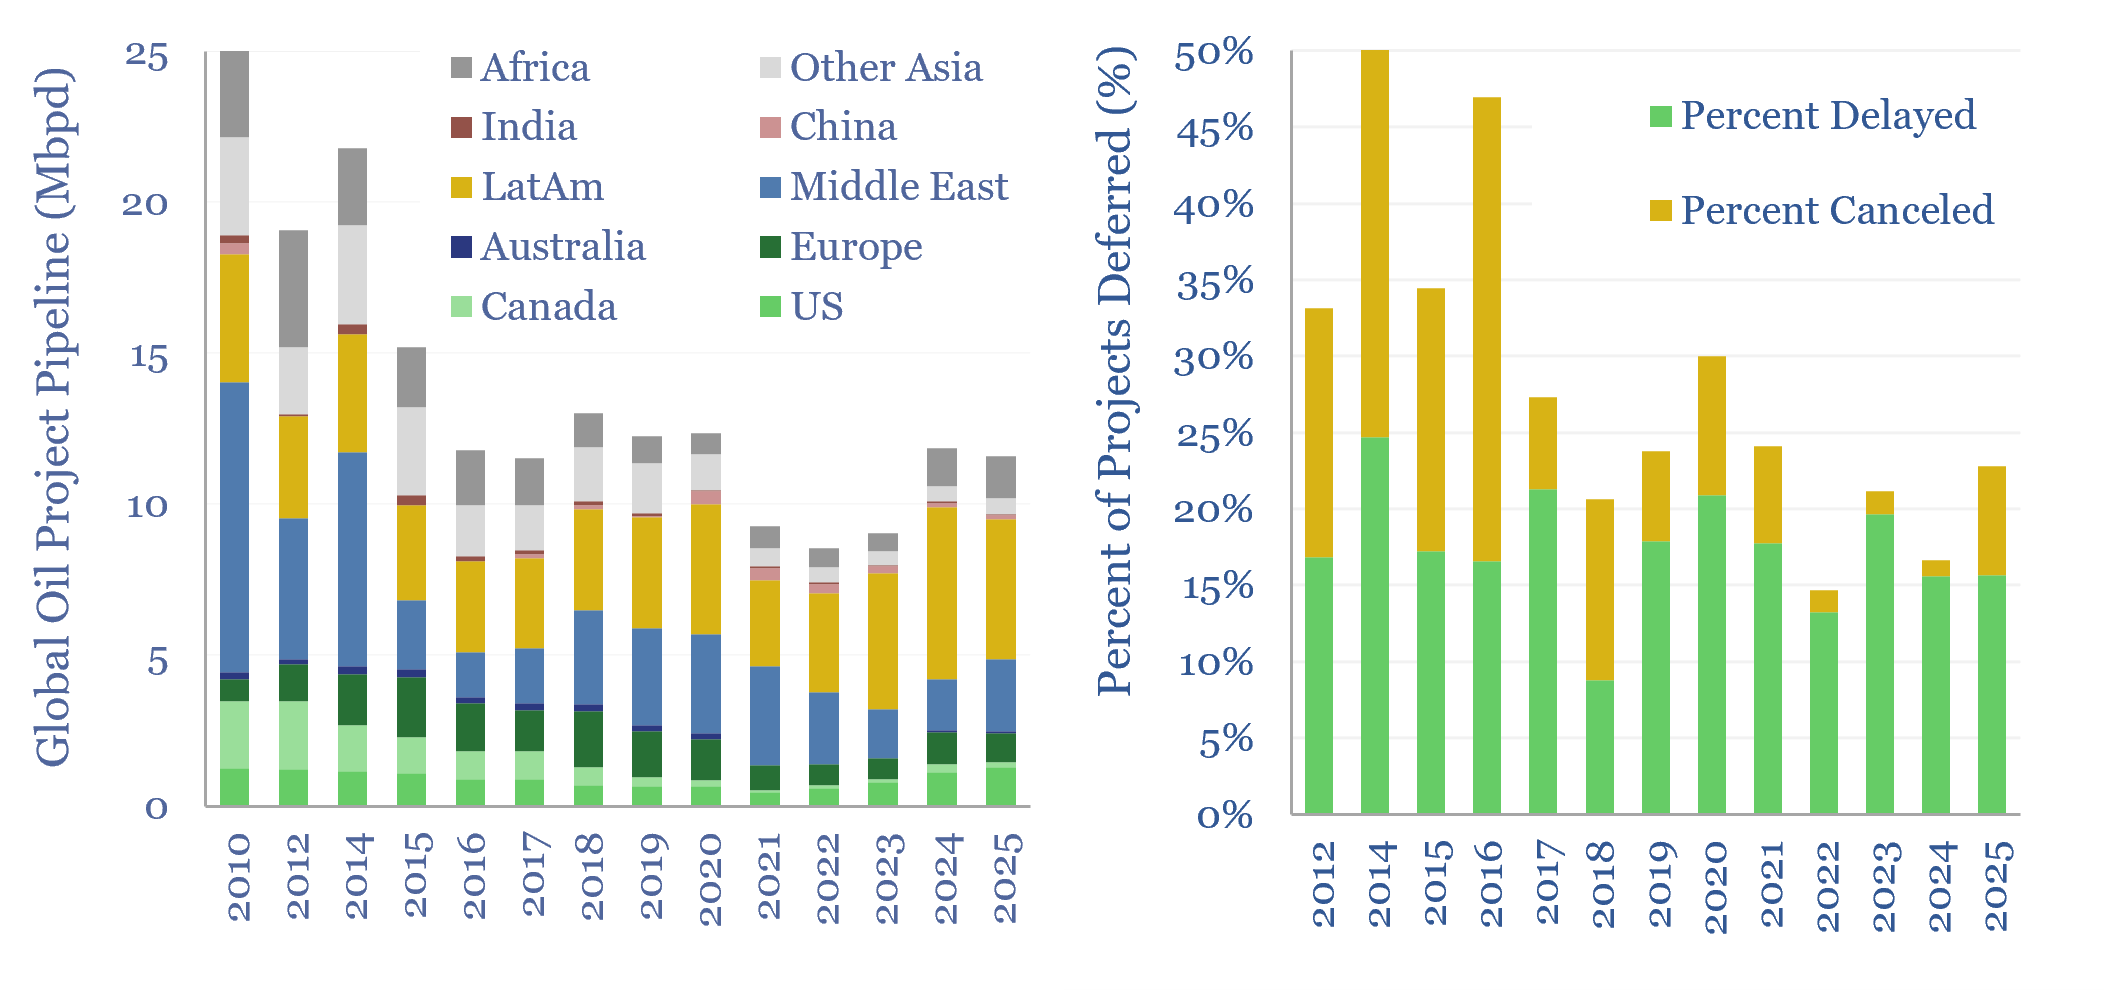
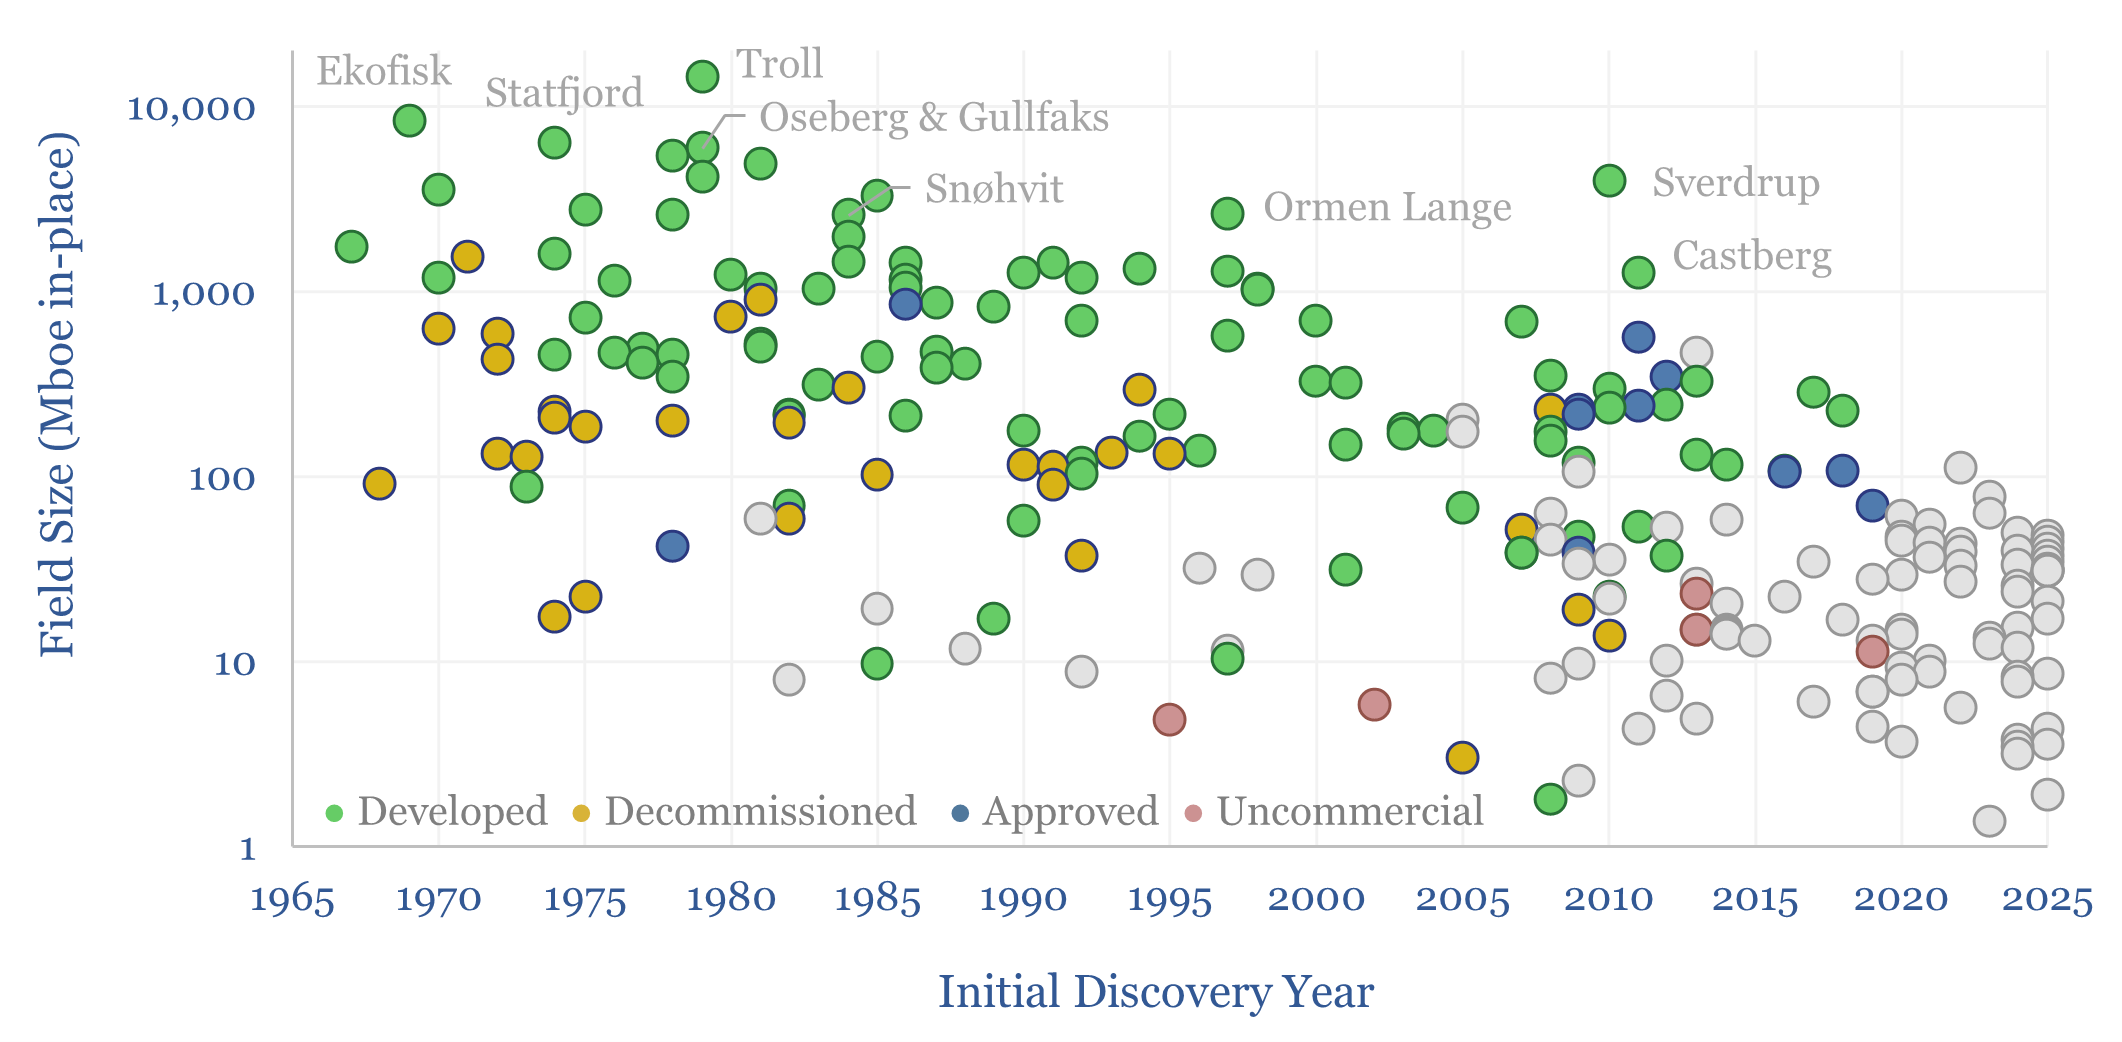
This data-file tracks conventional oil projects, by region, by development type, and over time. Over 10Mbpd of conventional oil projects are currently under development in 2025, representing $500bn of capex. What does this mean for oil markets?
Download the Model?
Australia’s useful energy consumption rises from 820TWH pa in 2023, by 1.2% pa 1,100 TWH pa in 2050. As a world-leader in renewables, it makes for an interesting case study. This Australia energy supply-demand model is disaggreated across 215 line items, broken down by source, by use, from 1990 to 2023, and with our forecasts to 2050.
Download the Model?
This data-file estimates global lithium demand amidst the ramp of electric vehicles, the rise of AI/robotics, and integrates with our oil market models. The data are disaggregated across electric vehicles, new vehicle types, consumer electronics, grid-scale batteries and conventional material uses.
Download the Model?
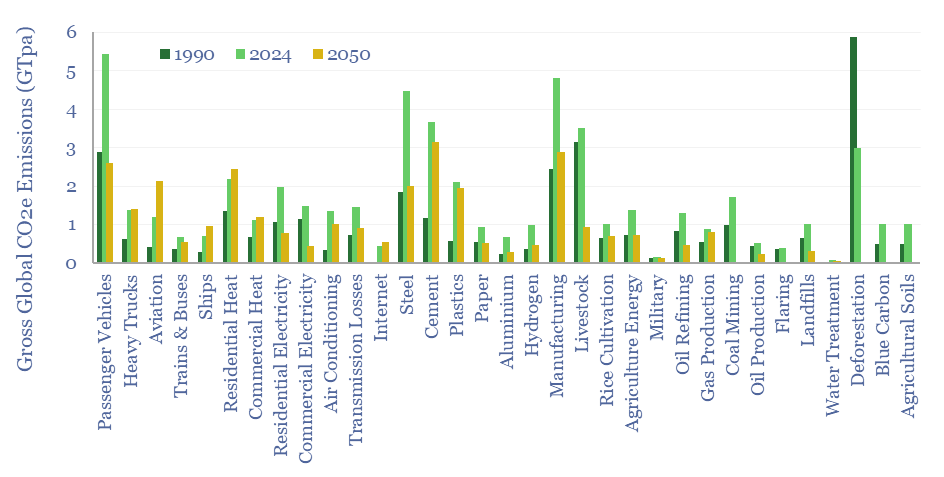
Global CO2 emissions rose from 32GTpa of CO2-equivalents in 1990 to 54GTpa in 2024, and are seen optimistically declining to 30GTpa by 2050, on a gross basis. This global CO2 emisisons breakdown covers 33 sources that each explain over 0.5% of global CO2e emissions, as a way of tracking emissions by source, by year, and our projections in the energy transition.
Download the Model?
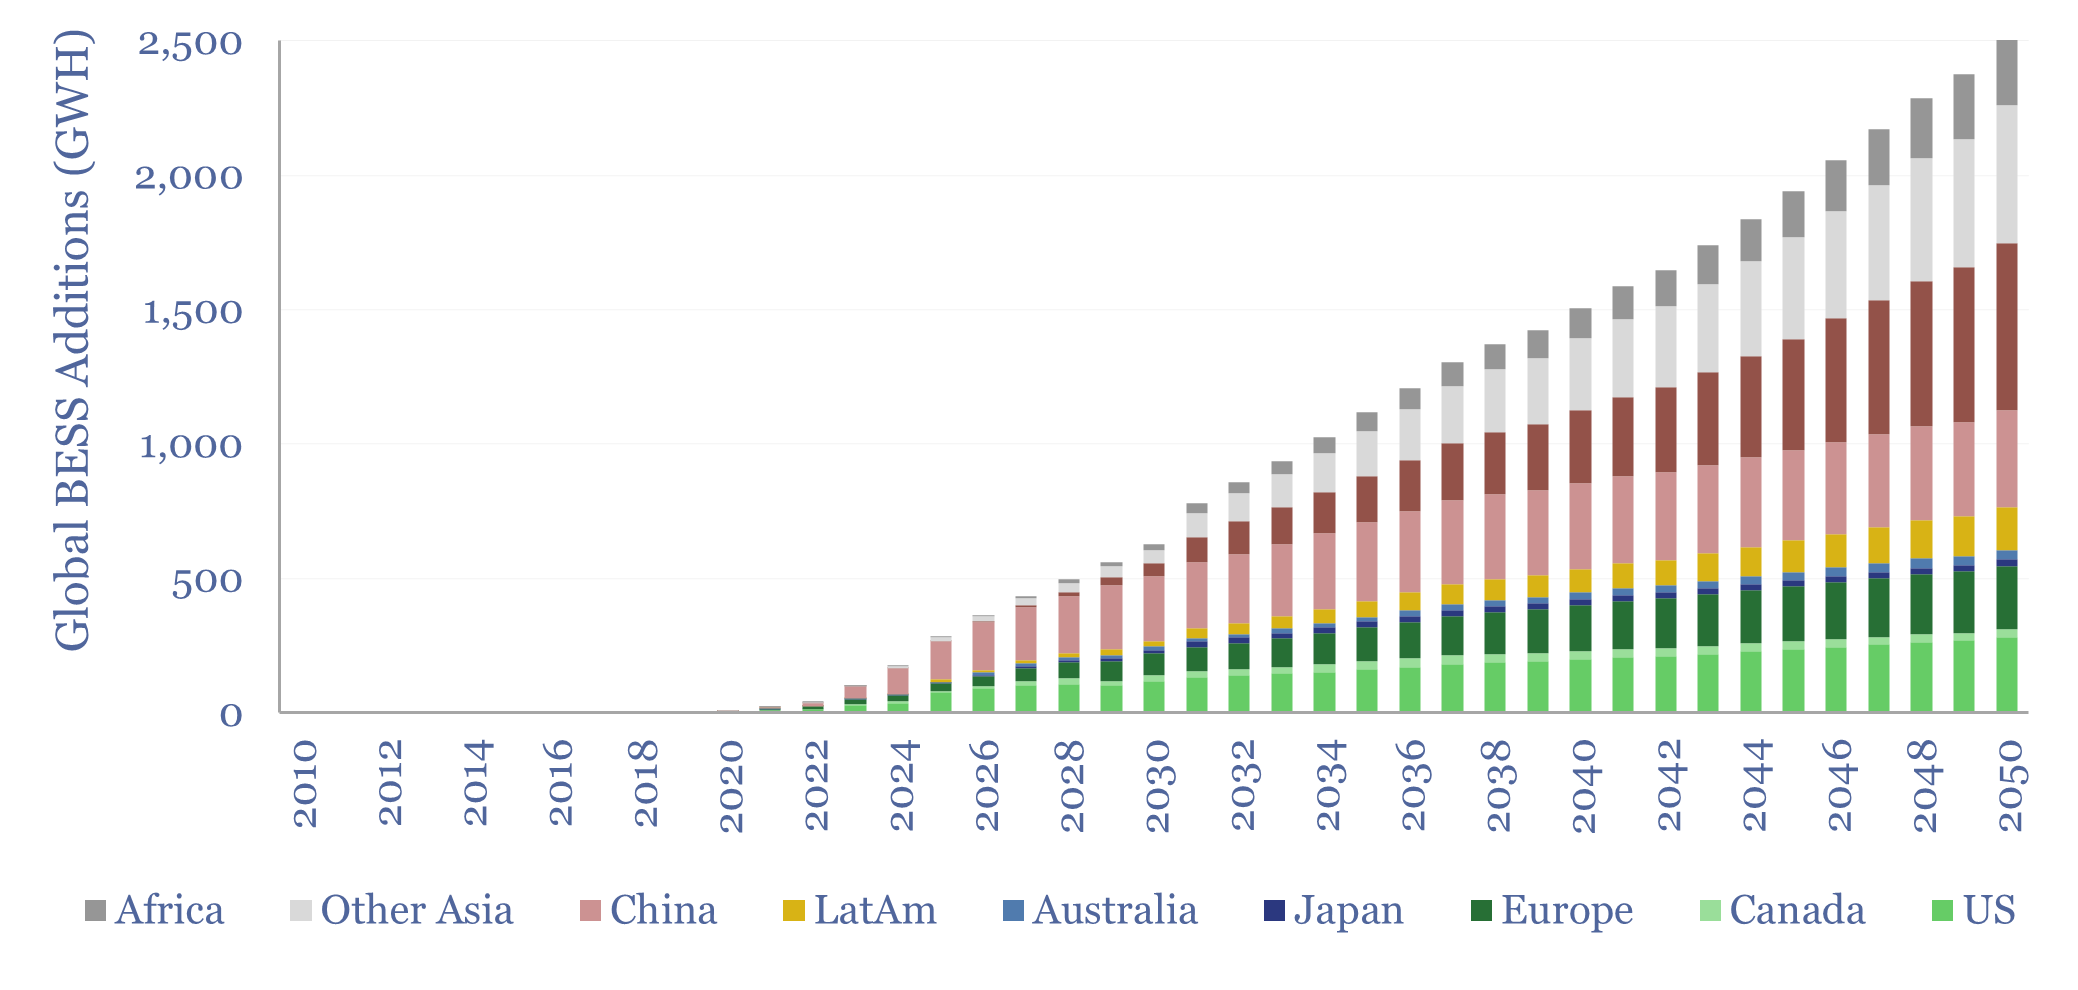
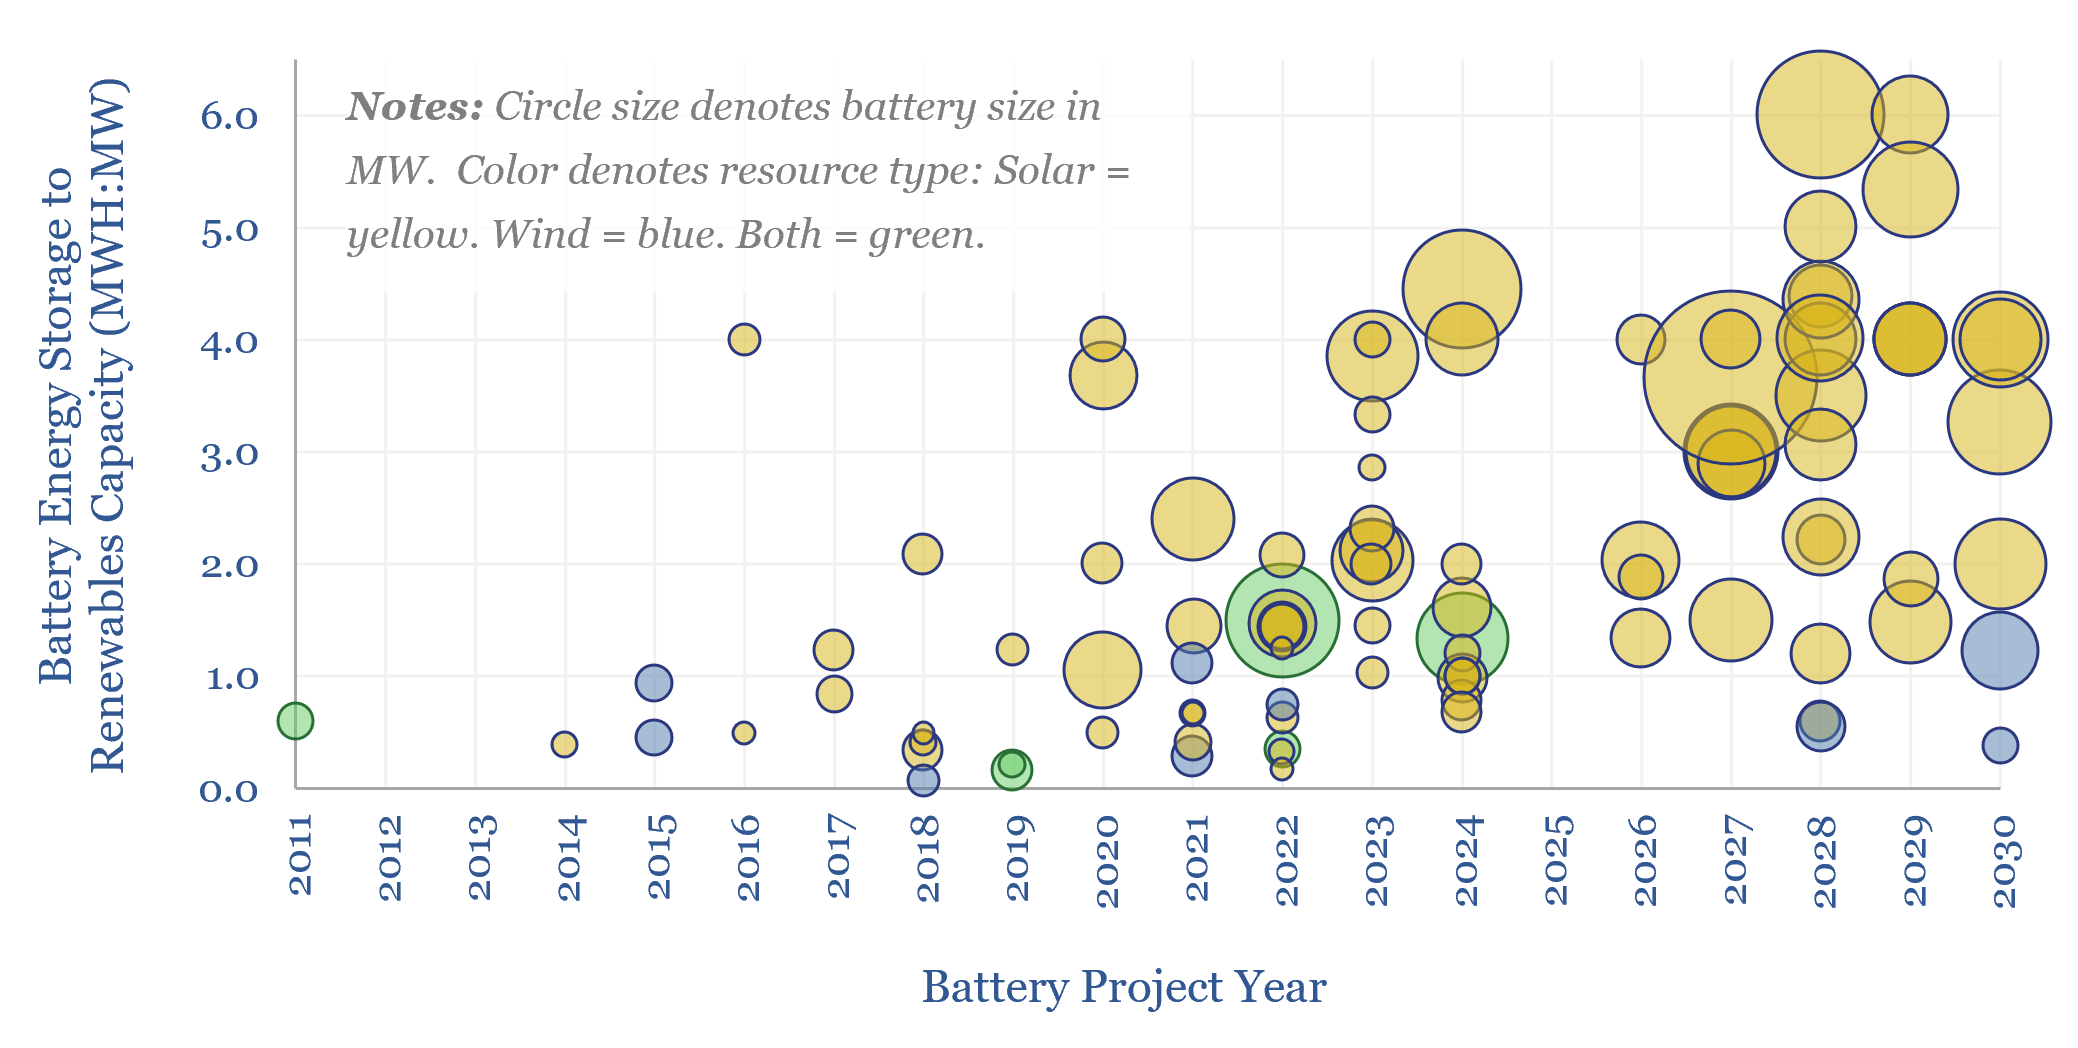
Battery energy storage systems (BESS) encompass grid-scale batteries, and smaller commercial and residential battery storage systems. Both are captured in this 100-line data-file, globally, by region, over time, in annual terms, in cumulative terms, in GWH terms and in GW terms.
Download the Model?
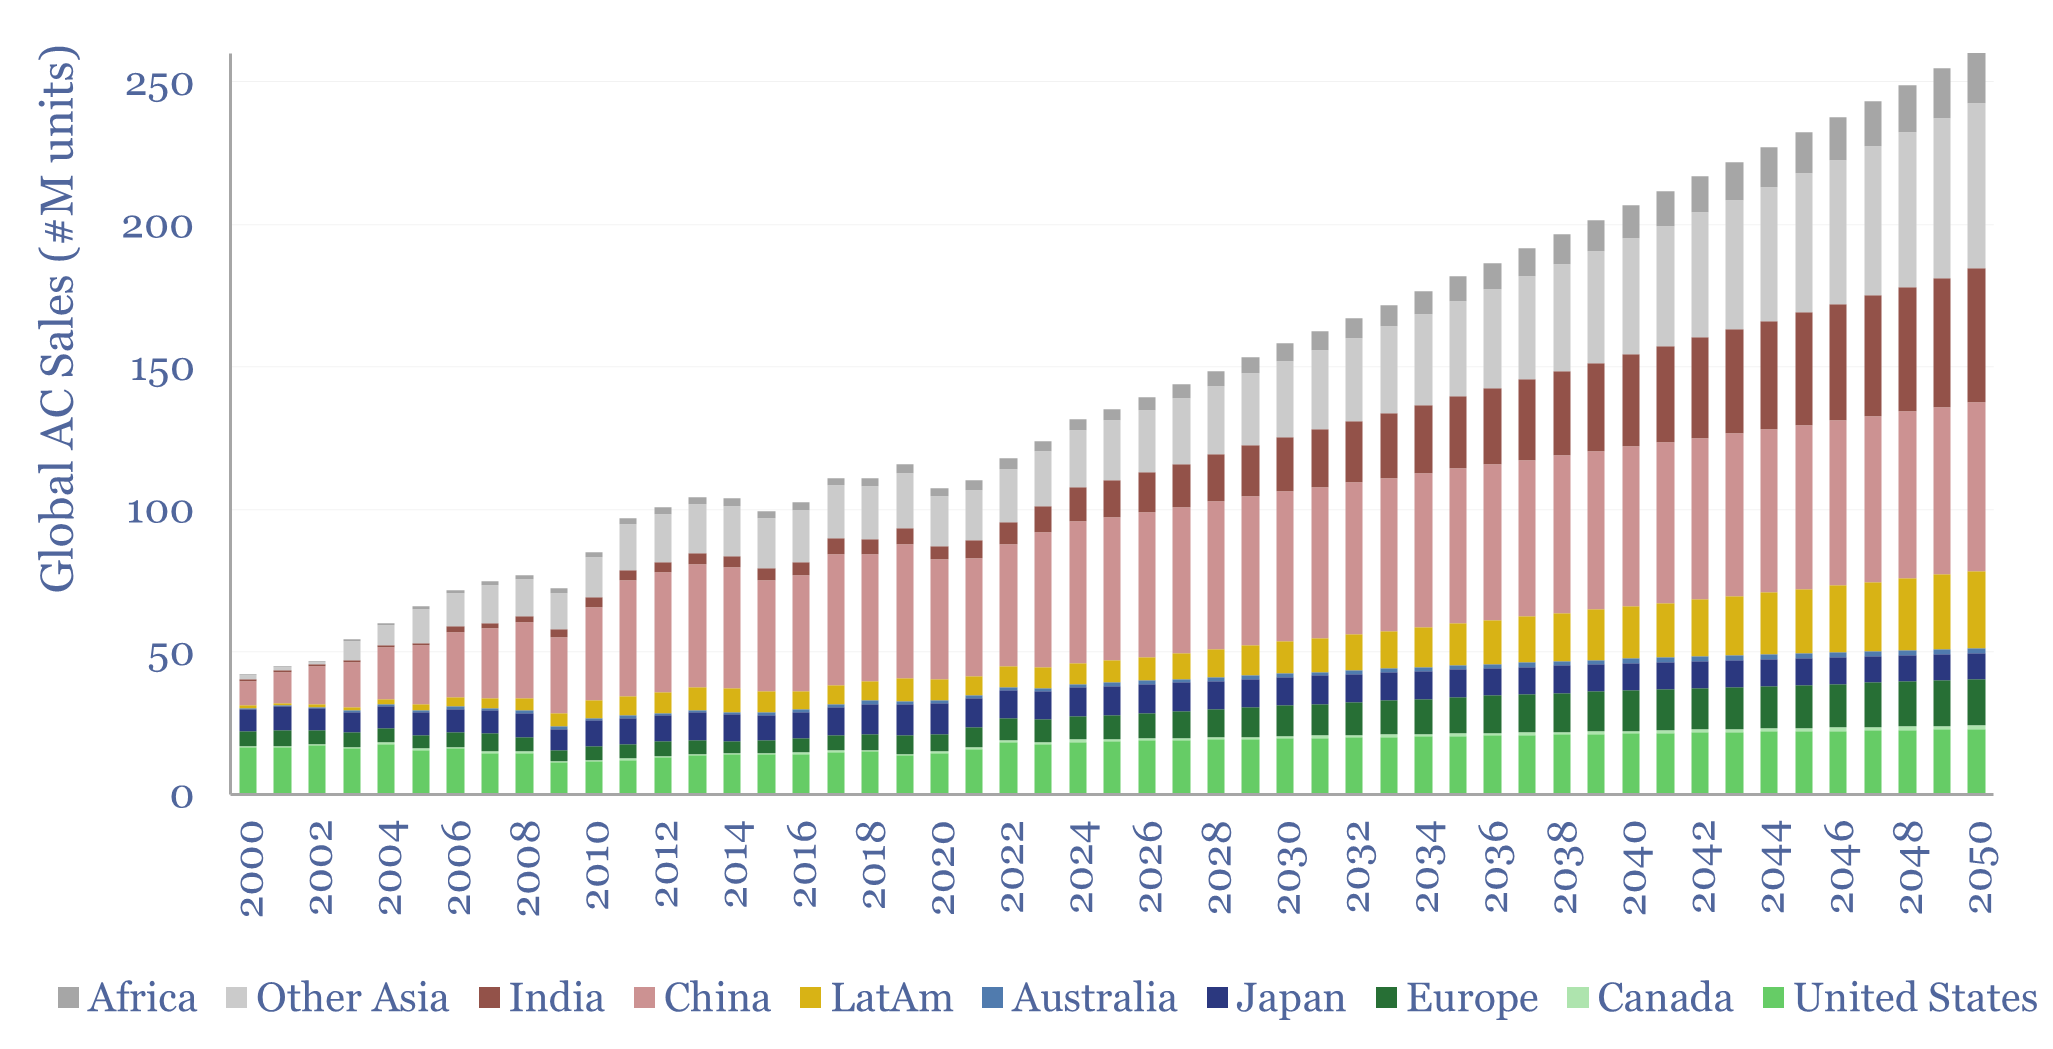
Global air conditioning consumed 2,600 TWH of electricity in 2024, which is 8% of total global electricity demand, and seen rising +3% pa to 6,000 TWH by 2050. This data-file quantifies global AC sales by country, the global AC unit stock by country, and global AC electricity demand by country, to 2050.
Download the Model?
Global demand for Rare Earth magnets was 280kTpa in 2024, of which 250kTpa was NdFeB magnets. Demand is seen rising at 9% pa to 2030, then 6% pa to 2050, reaching 1.3MTpa. The largest sources of upside are in robotics and EVs, at c30% each.
Download the Model?
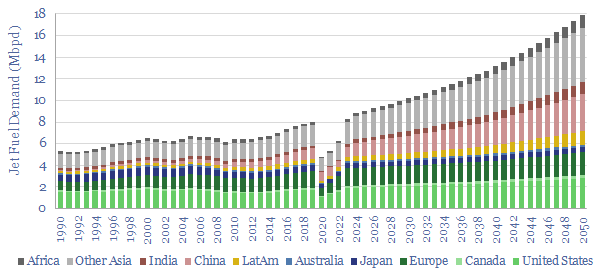
Jet fuel demand ran at 8Mbpd in 2019, the last year before COVID, and could rise to 18Mbpd by 2050, as global population rises 25%, jet fuel demand per capita doubles and fuel economy per aviation mile rises by 20%. This data file breaks down jet fuel demand by region, including our forecasts through 2050, which can be stress-tested, and feed into our global oil demand models.
Download the Model?
Power electronic devices are used to transform and control the flow of electricity, especially at large, commercial and industrial scale. Different types of power electronic equipment, their costs are described in this data-file. We see a $600bn capital goods market accelerating to an 8% CAGR and reaching $1trn pa by 2030, amidst electrification, energy transition and the rise of AI.
Download the Model?
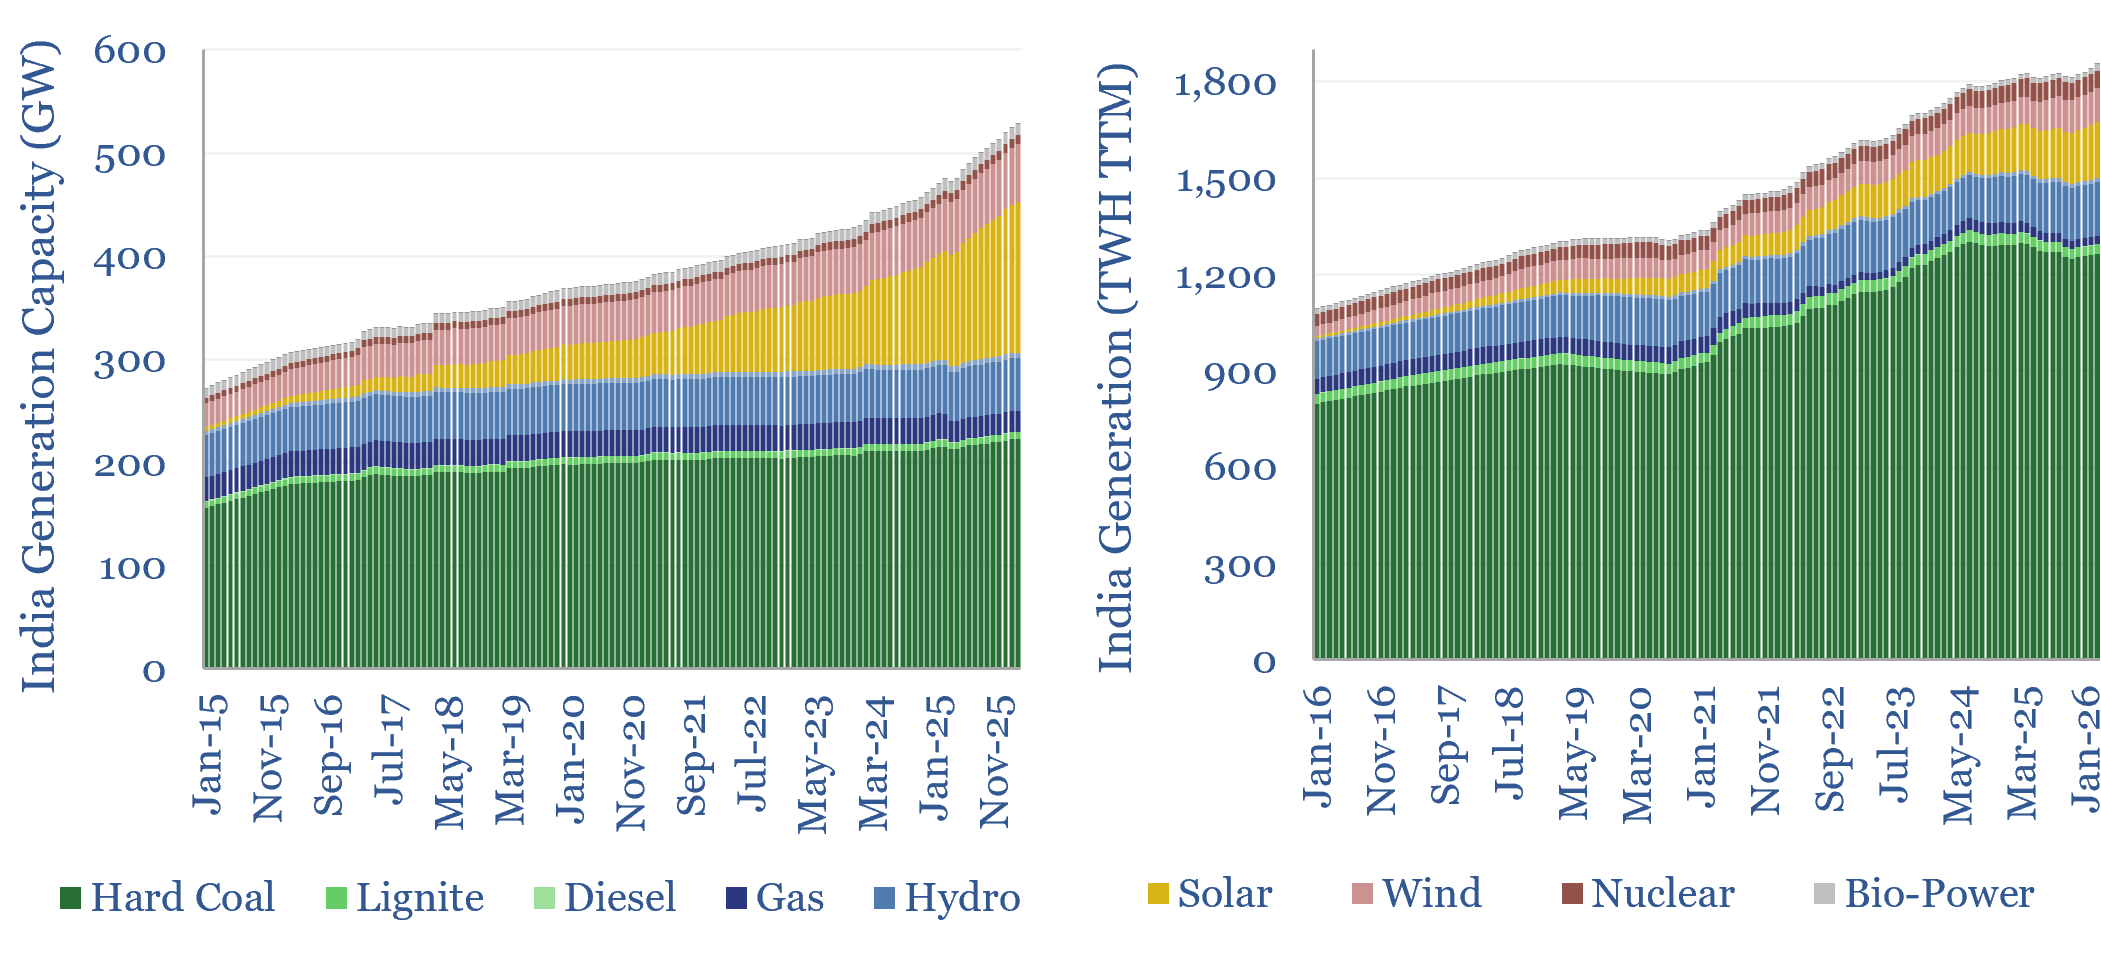
India contains 1.4bn people, generates almost $4trn pa of GDP and uses 9% of the world’s total useful energy. Will India be the first country to industrialize primarily around solar, and if so, what will this look like? This data-file captures our forecasts for India’s energy demand, and how it will evolve over time, as a useful reference, ranging across our broader models.
Download the Model?
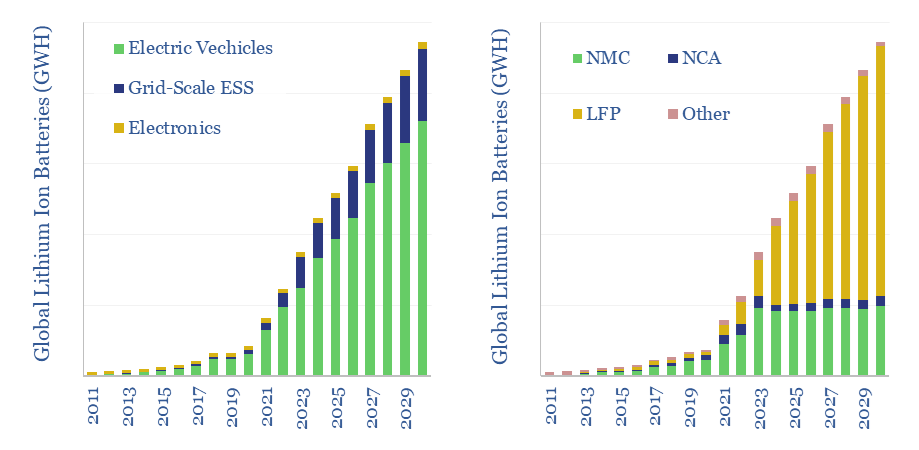
The lithium ion battery market reached 900GWH in 2023, representing 7x growth in the past half-decade since 2018, and 20x growth in the past decade since 2013. Volumes treble again by 2030. This data-file breaks down global ithium ion battery volumes by chemistry and be end use. A remarkable shift to LFP is underway, and NMC sales may even have peaked.
Download the Model?
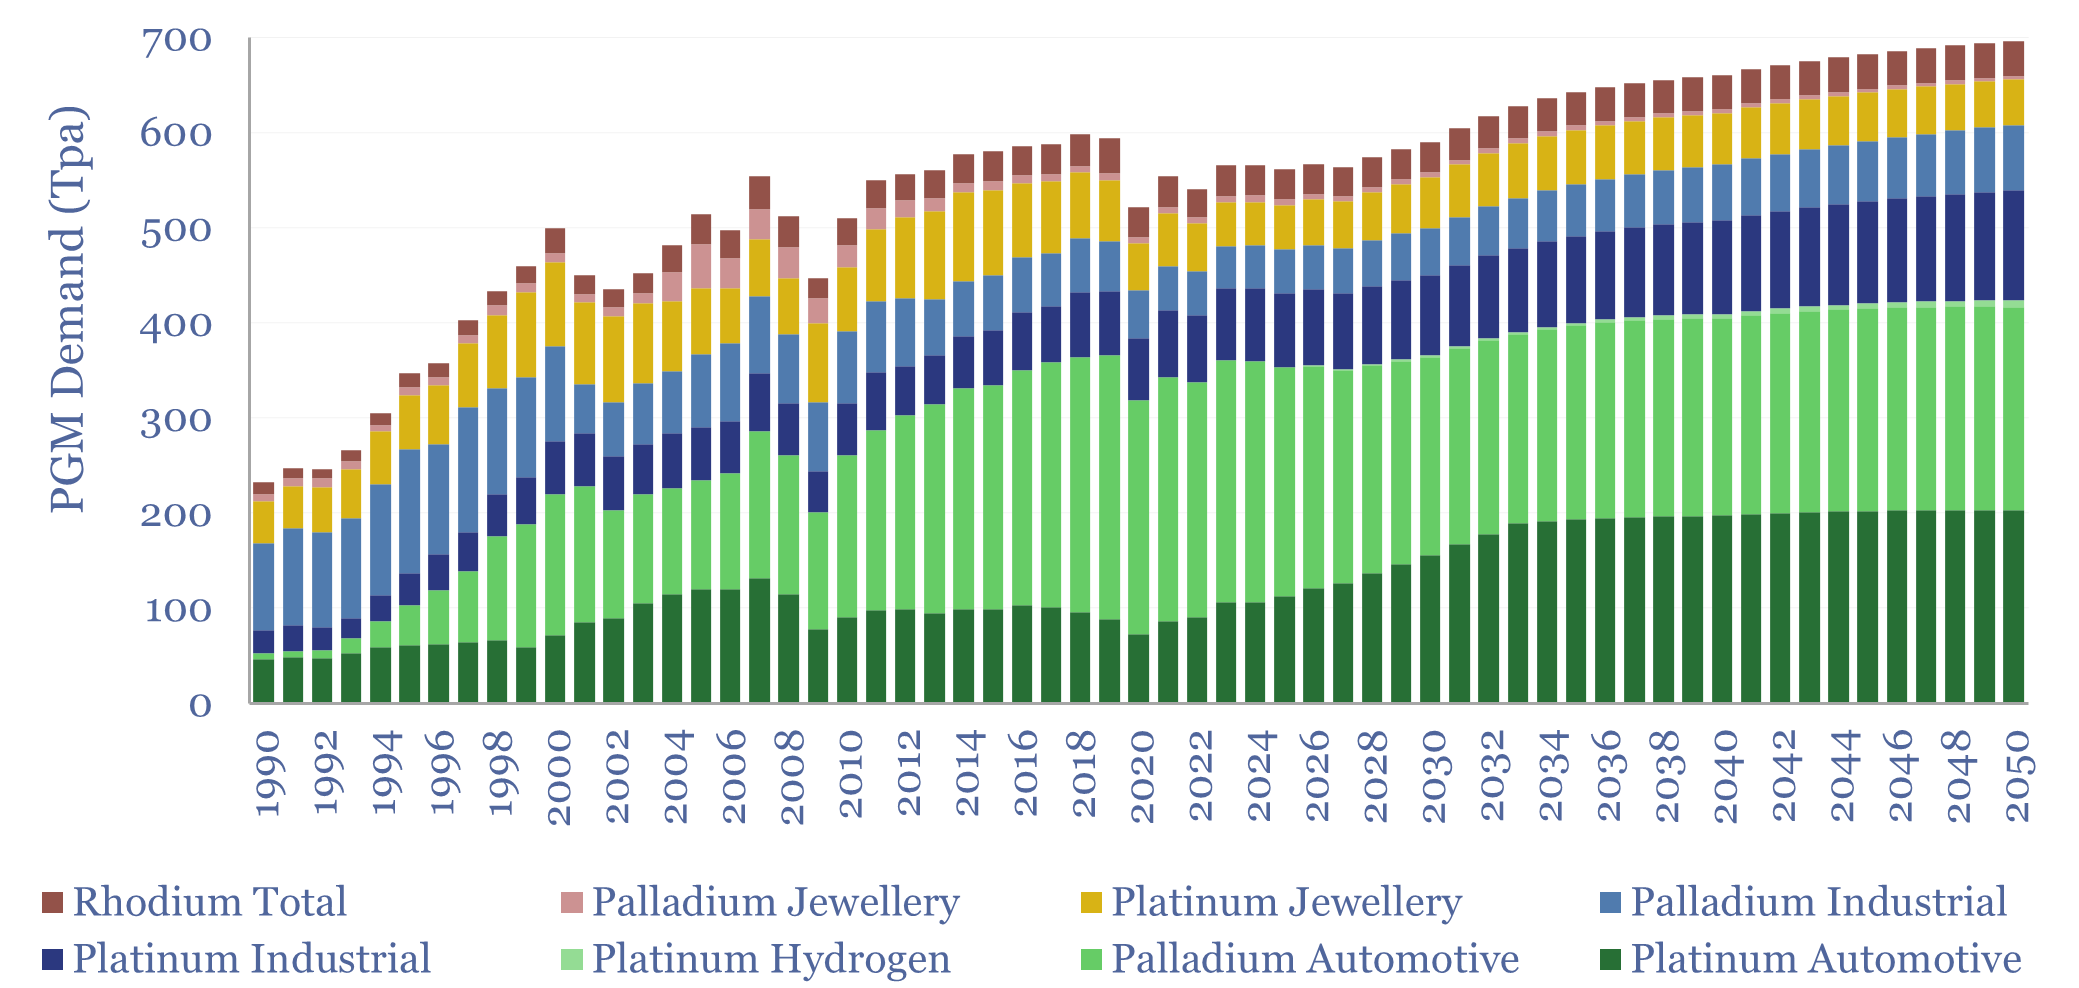
Core global PGM demand ran at 565 tons in 2023, which remains c6% lower than the all-time peak demand of 600Tpa in 2019. We model a recovery to 700 Tpa of demand for platinum, palladium and rhodium in 2030, then a long run decline to 350Tpa if EVs ultimately reach 90% of vehicle sales by 2050. Numbers can be stress-tested in this model.
Download the Model?
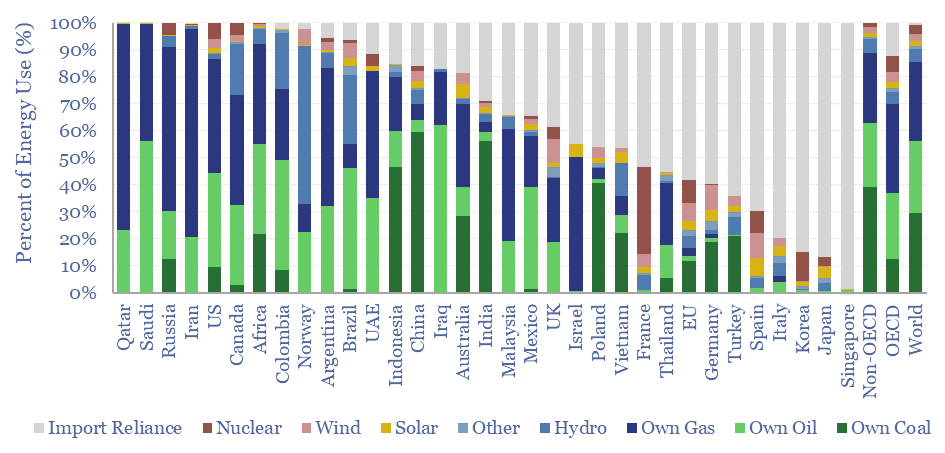
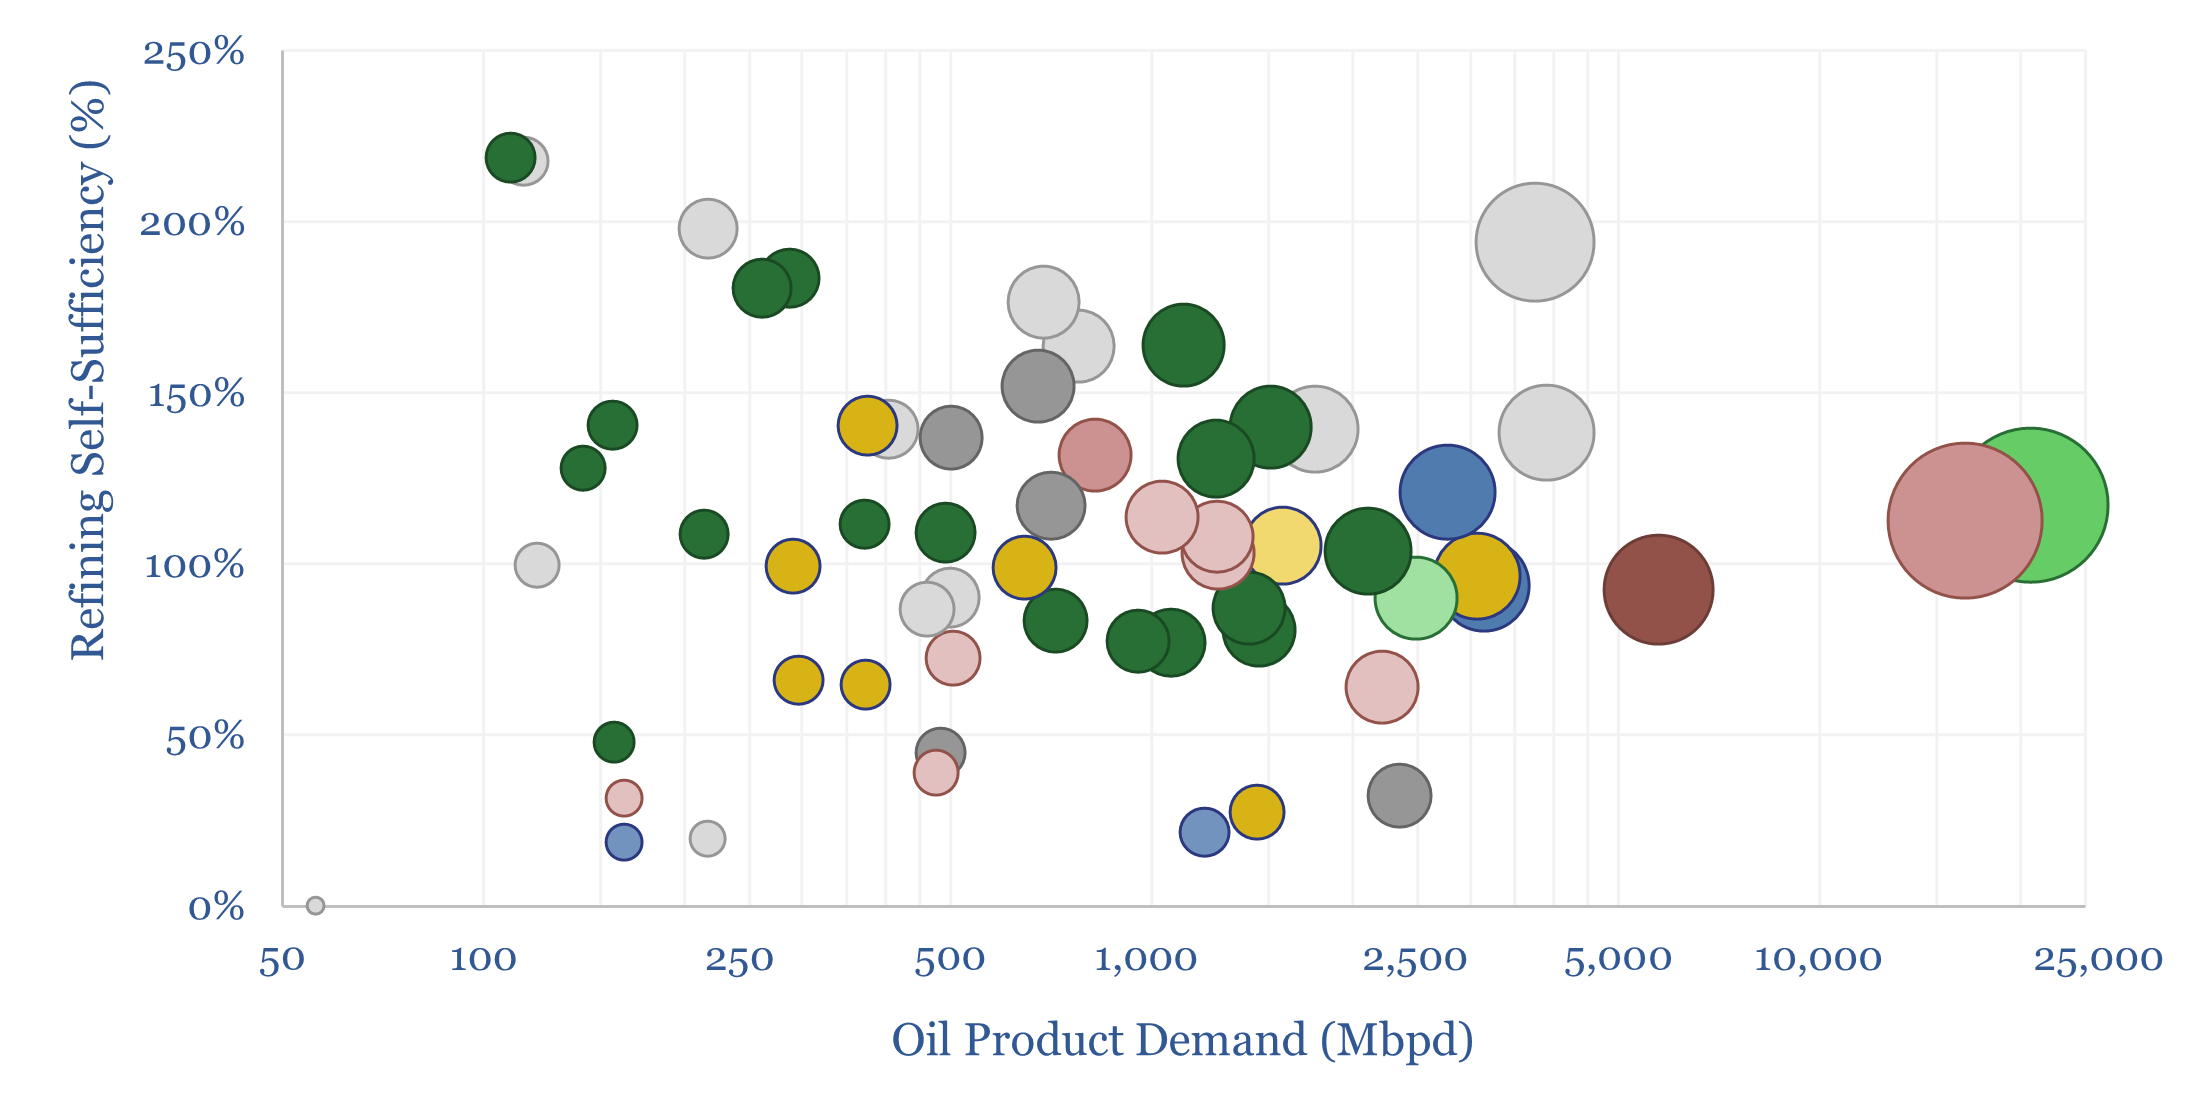
This data-file tabulates energy self-sufficiency, by country, over time, across 30 of the largest economies in the world. Among this sample, the median country generates 70% of its energy domestically, and is reliant on imports for 30% of the remainder. Energy self-sufficiency varies vastly by country.
Download the Model?
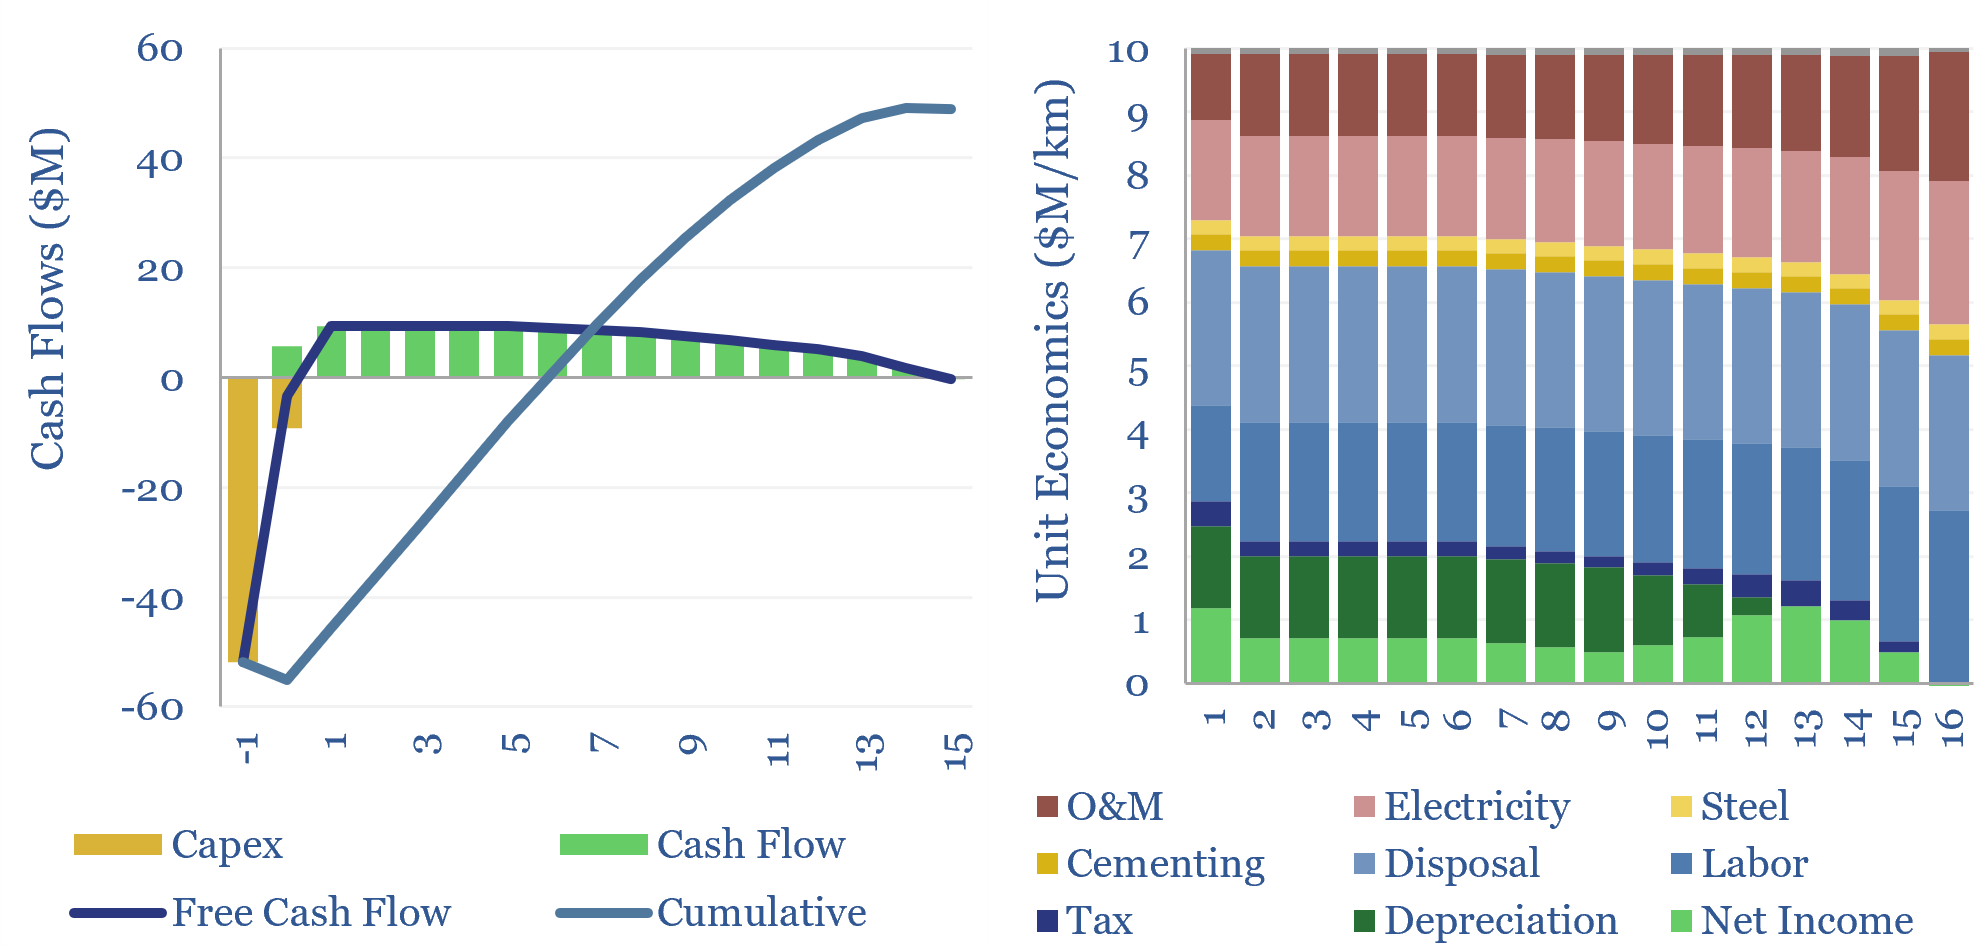
The global market for tunnel boring machines has been estimated at $7.5bn pa. But what are the costs of tunnel boring? This data-file models tunnel boring economics, estimated at $10M/km for civil infrastructure projects today, $30M/km for deep mine shafts, but will cheap solar and autonomous robots deflate costs?
Download the Model?
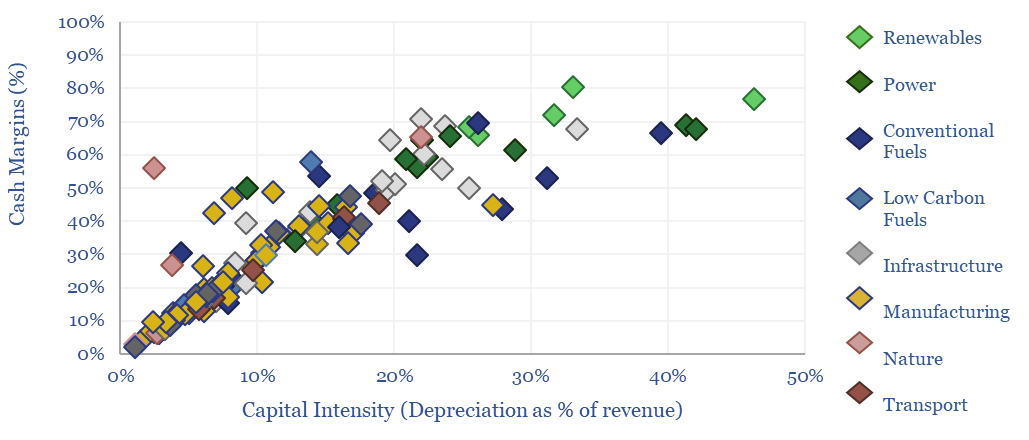
This data-file provides an overview of energy economics, across 175 different economic models constructed by Thunder Said Energy, in order to put numbers in context. This helps to compare marginal costs, capex costs, energy intensity, interest rate sensitivity, and other key parameters that matter in the energy transition.
Download the Model?
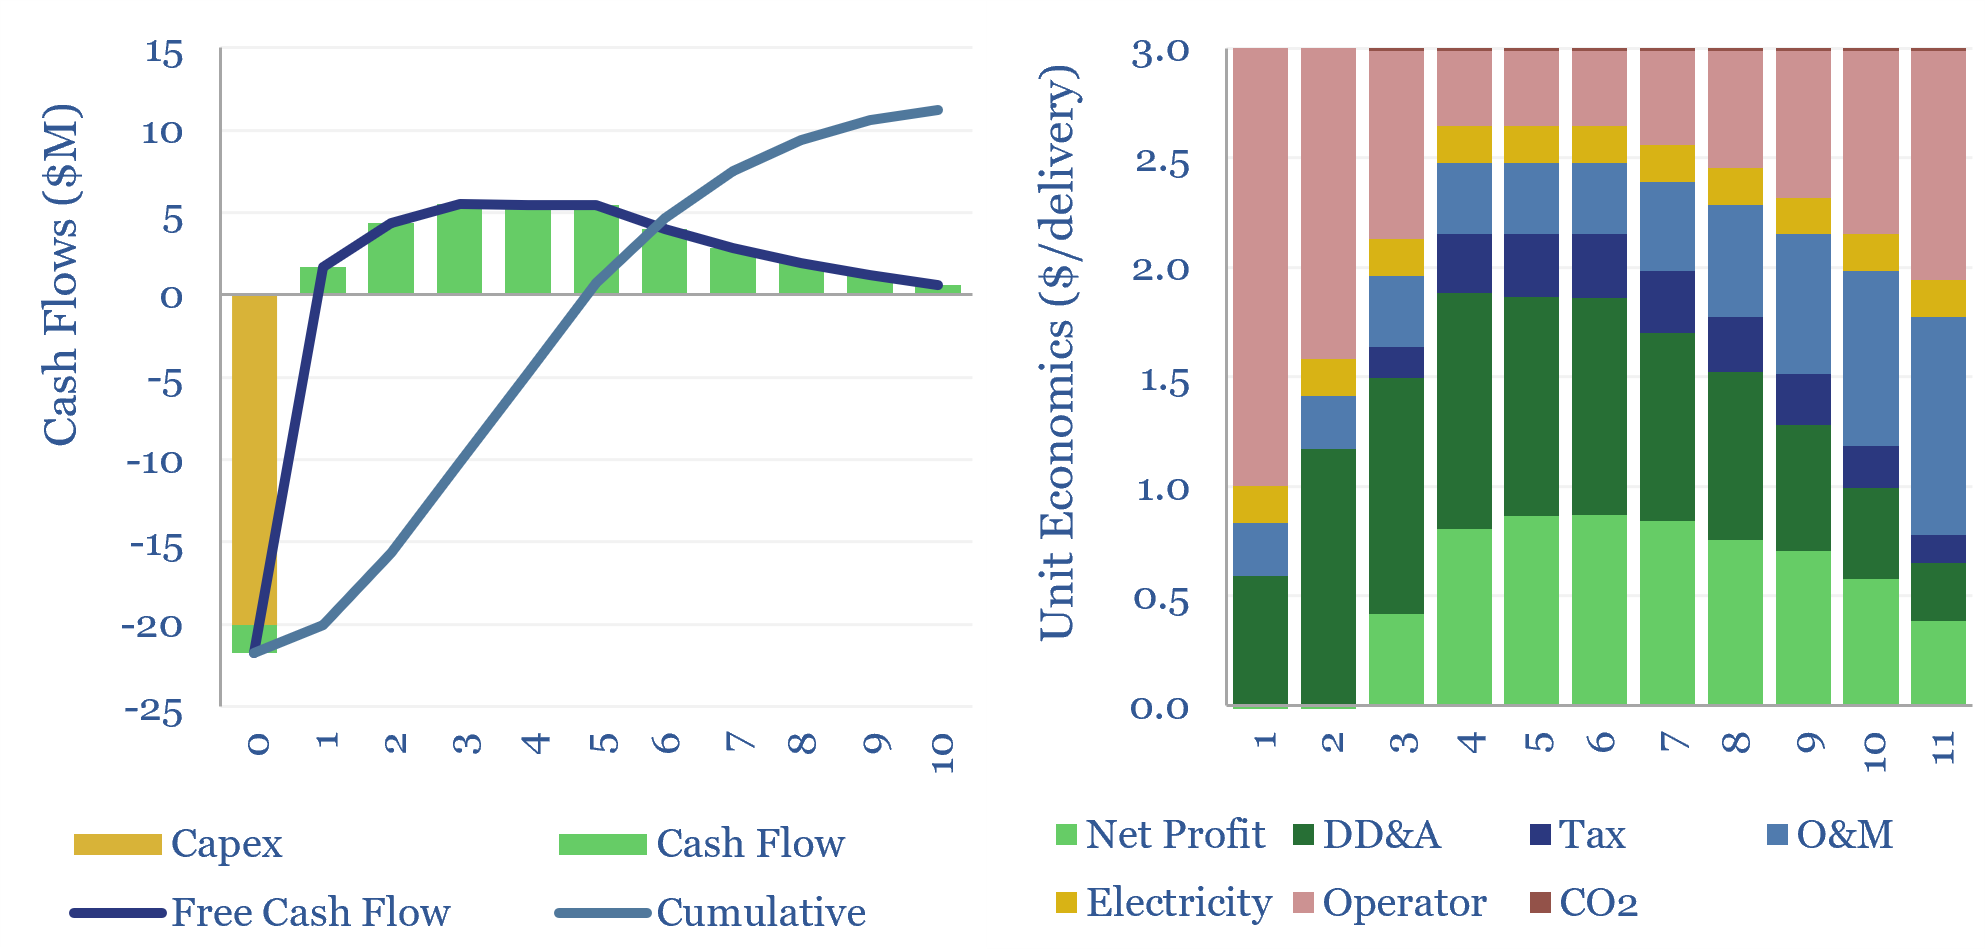
The energy economics of delivery drones, which can travel autonomously, over 30km at 100kmph, are captured in this data-file. In our base case, a delivery drone that costs $20k, and makes 8 deliveries per day, must charge a fee of $3/delivery to generate a 10% IRR. Costs, speeds and energy use can be 5-20x superior to delivery couriers.
Download the Model?
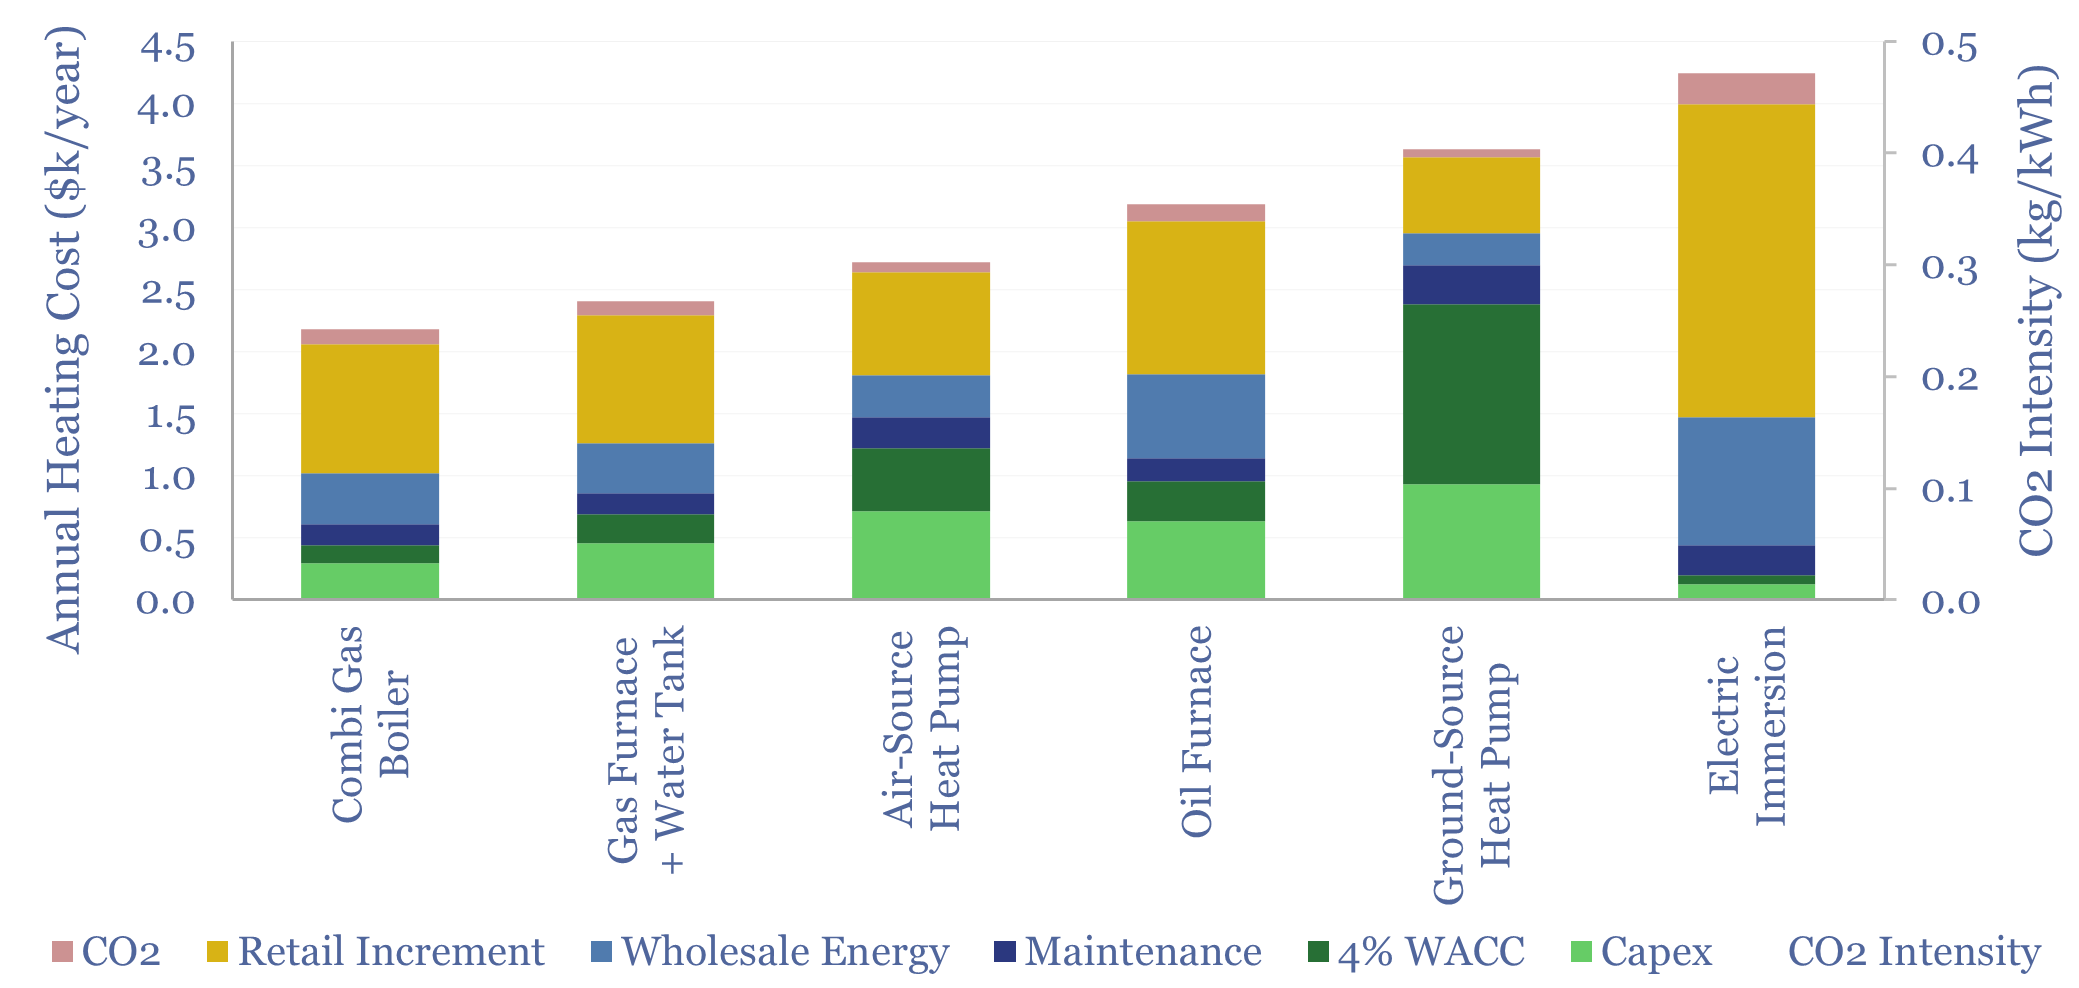
Residential heating costs are compared and contrasted in this data-file, for gas-fired combi boilers, gas furnaces and hot water tanks, oil furnaces and hot water tanks, purely electric heating systems including immersion heaters, air-source heat pumps and ground-source heat pumps. Capex, maintenance and input energy prices can be stress-tested.
Download the Model?
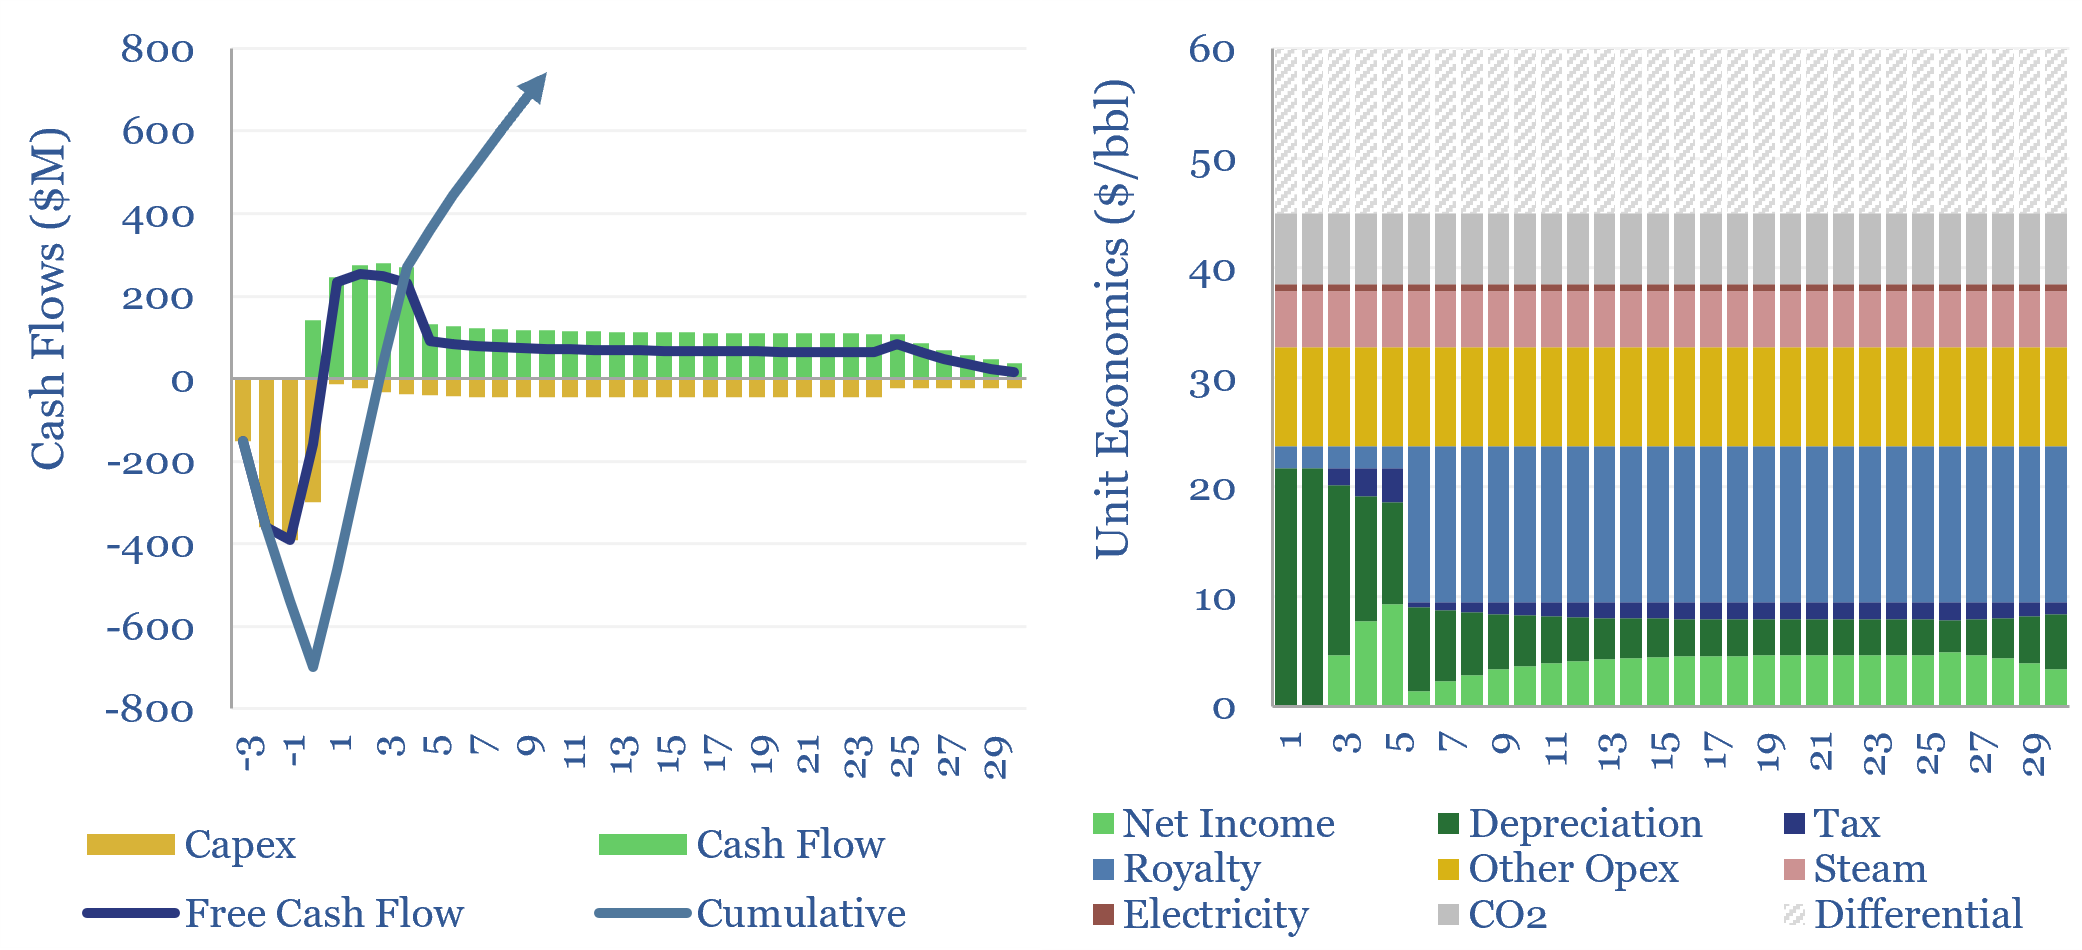
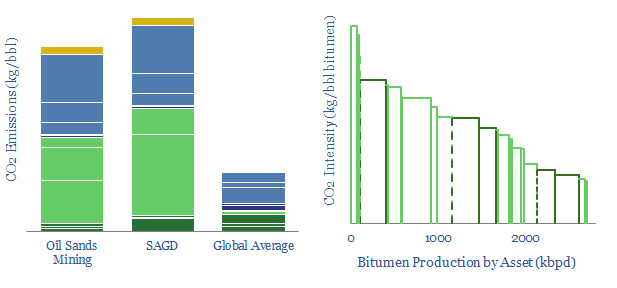
SAGD oil sands economics are modeled in this data-file, generating a 10% IRR, at $60/bbl WTI oil prices in our base case. This hinges on a 2.7 m3/m3 steam oil ratio, for a 4x EROEI. Breakevens can vary from $45-90/bbl depending on capex costs and steam oil ratios.
Download the Model?
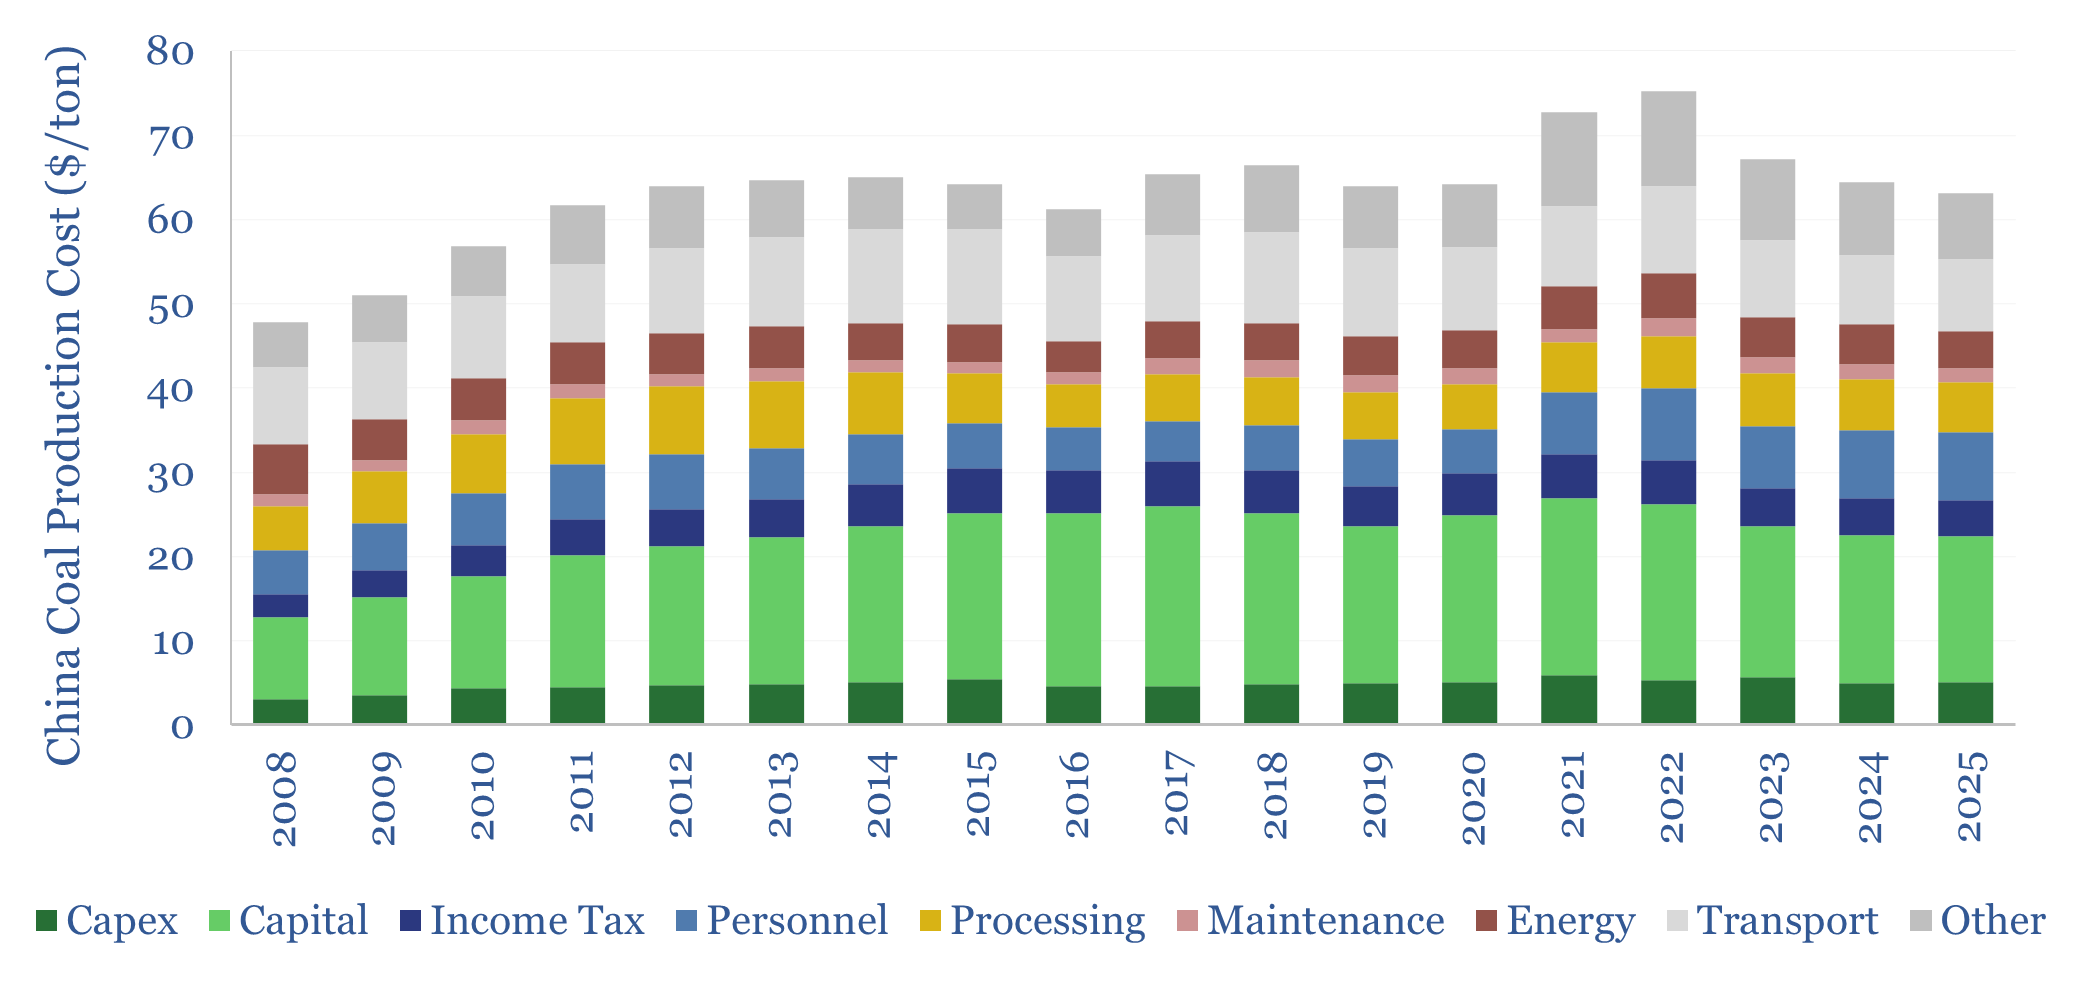
The economics of coal mining are captured in this data-file. $60/ton coal, equivalent to 1c/kWh-th, at the bottom of the global energy cost curve, can typically be unlocked by capex costs of $60/Tpa at a new coal mine, and other opex costs, tabulated in the data-file.
Download the Model?
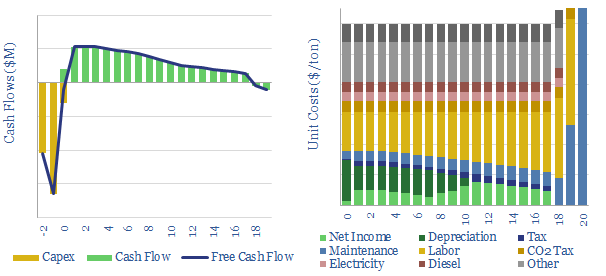
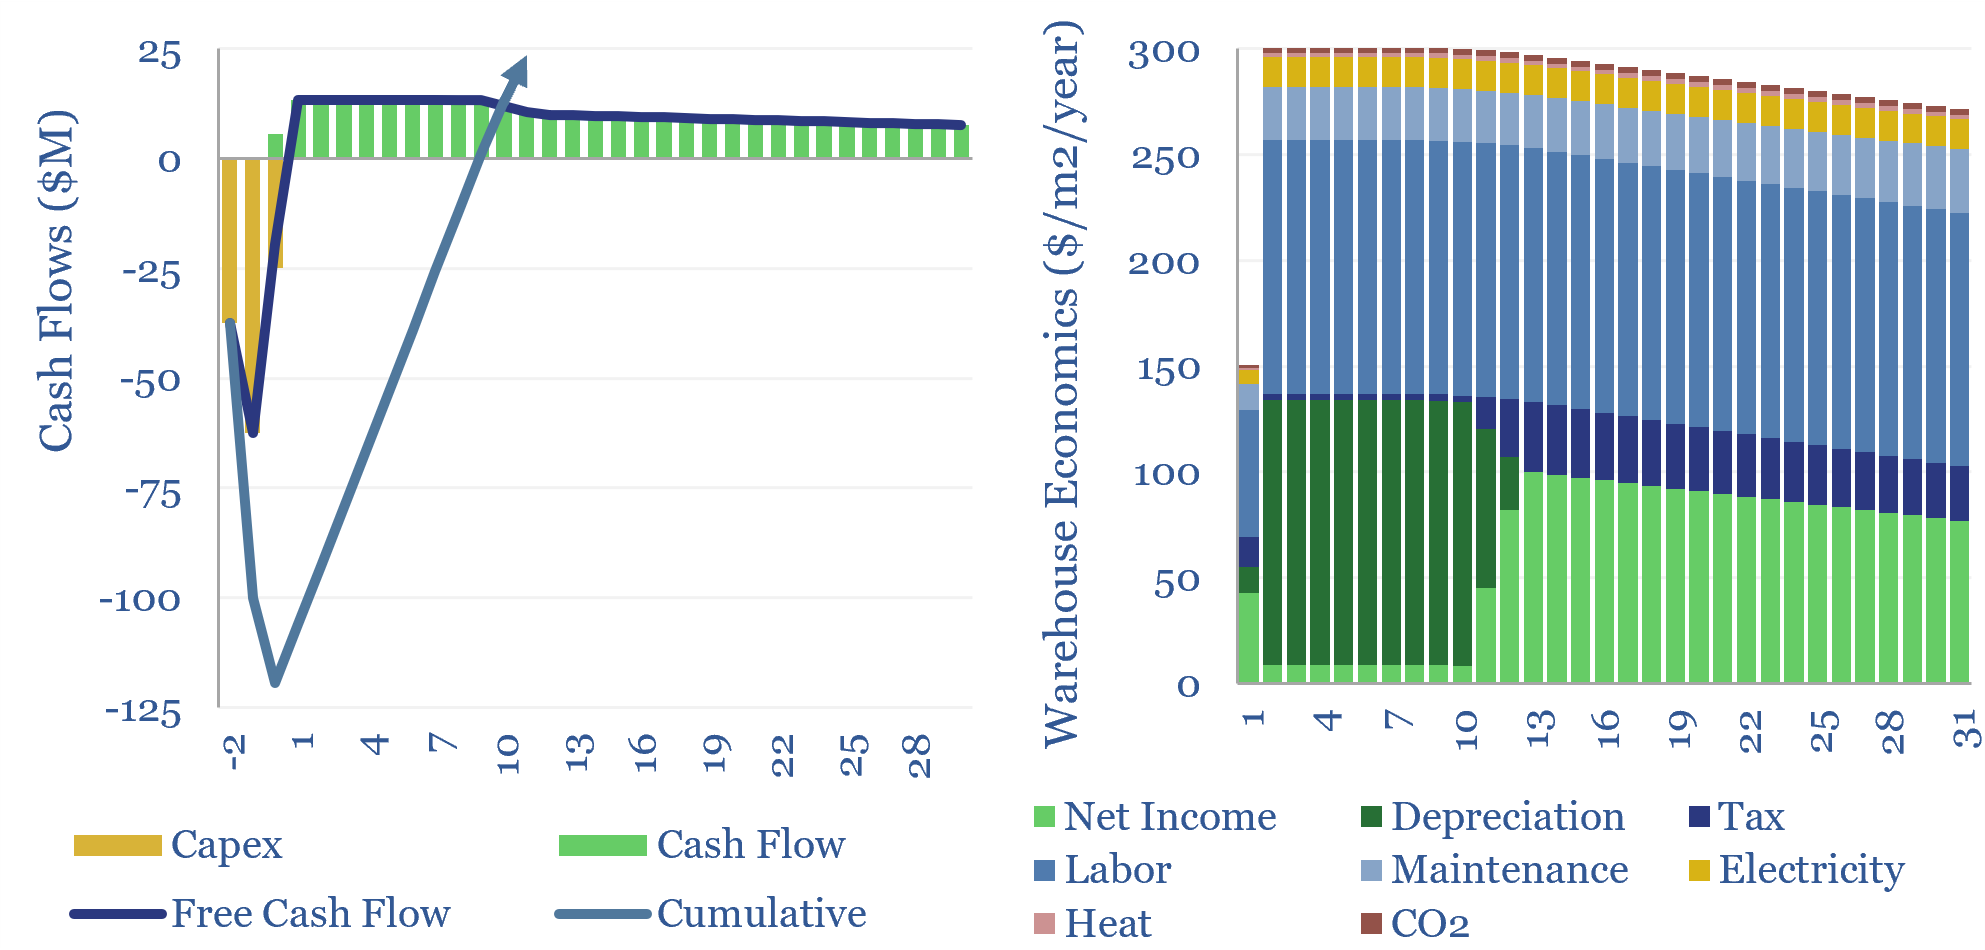
This data-file captures the economics of warehouses. A typical warehousing facility needs to charge $350 per m2 per year of storage, to earn an 8% unlevered return, on $1,250/m2 of construction capex, net of labor, electricity, heating and maintenance costs.
Download the Model?
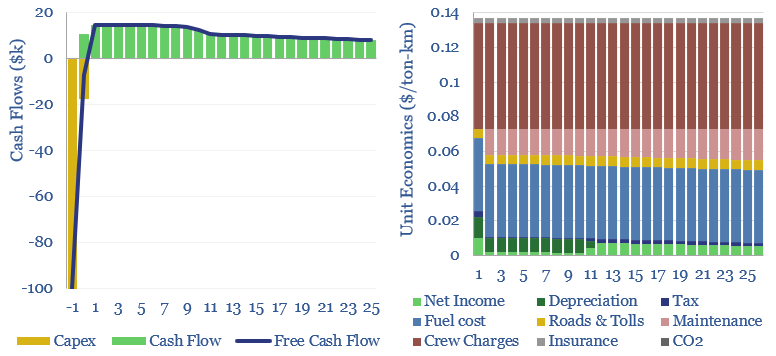
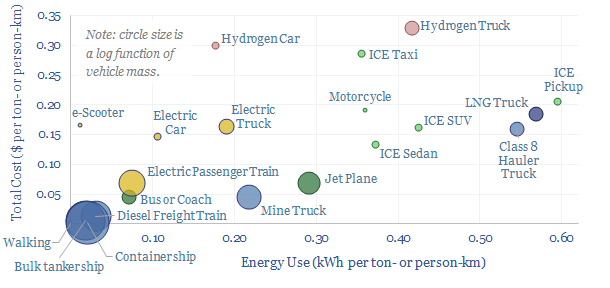
Heavy truck costs are estimated at $0.14 per ton-kilometer, for a truck typically carrying 15 tons of load and traversing over 150,000 miles per annum. Today these trucks consume 10Mbpd of diesel and their costs absorb 4% of post-tax incomes. Hydrogen trucks would be 45-75% more costly, but from 2026, we are starting to see competitive electric truck costs.
Download the Model?
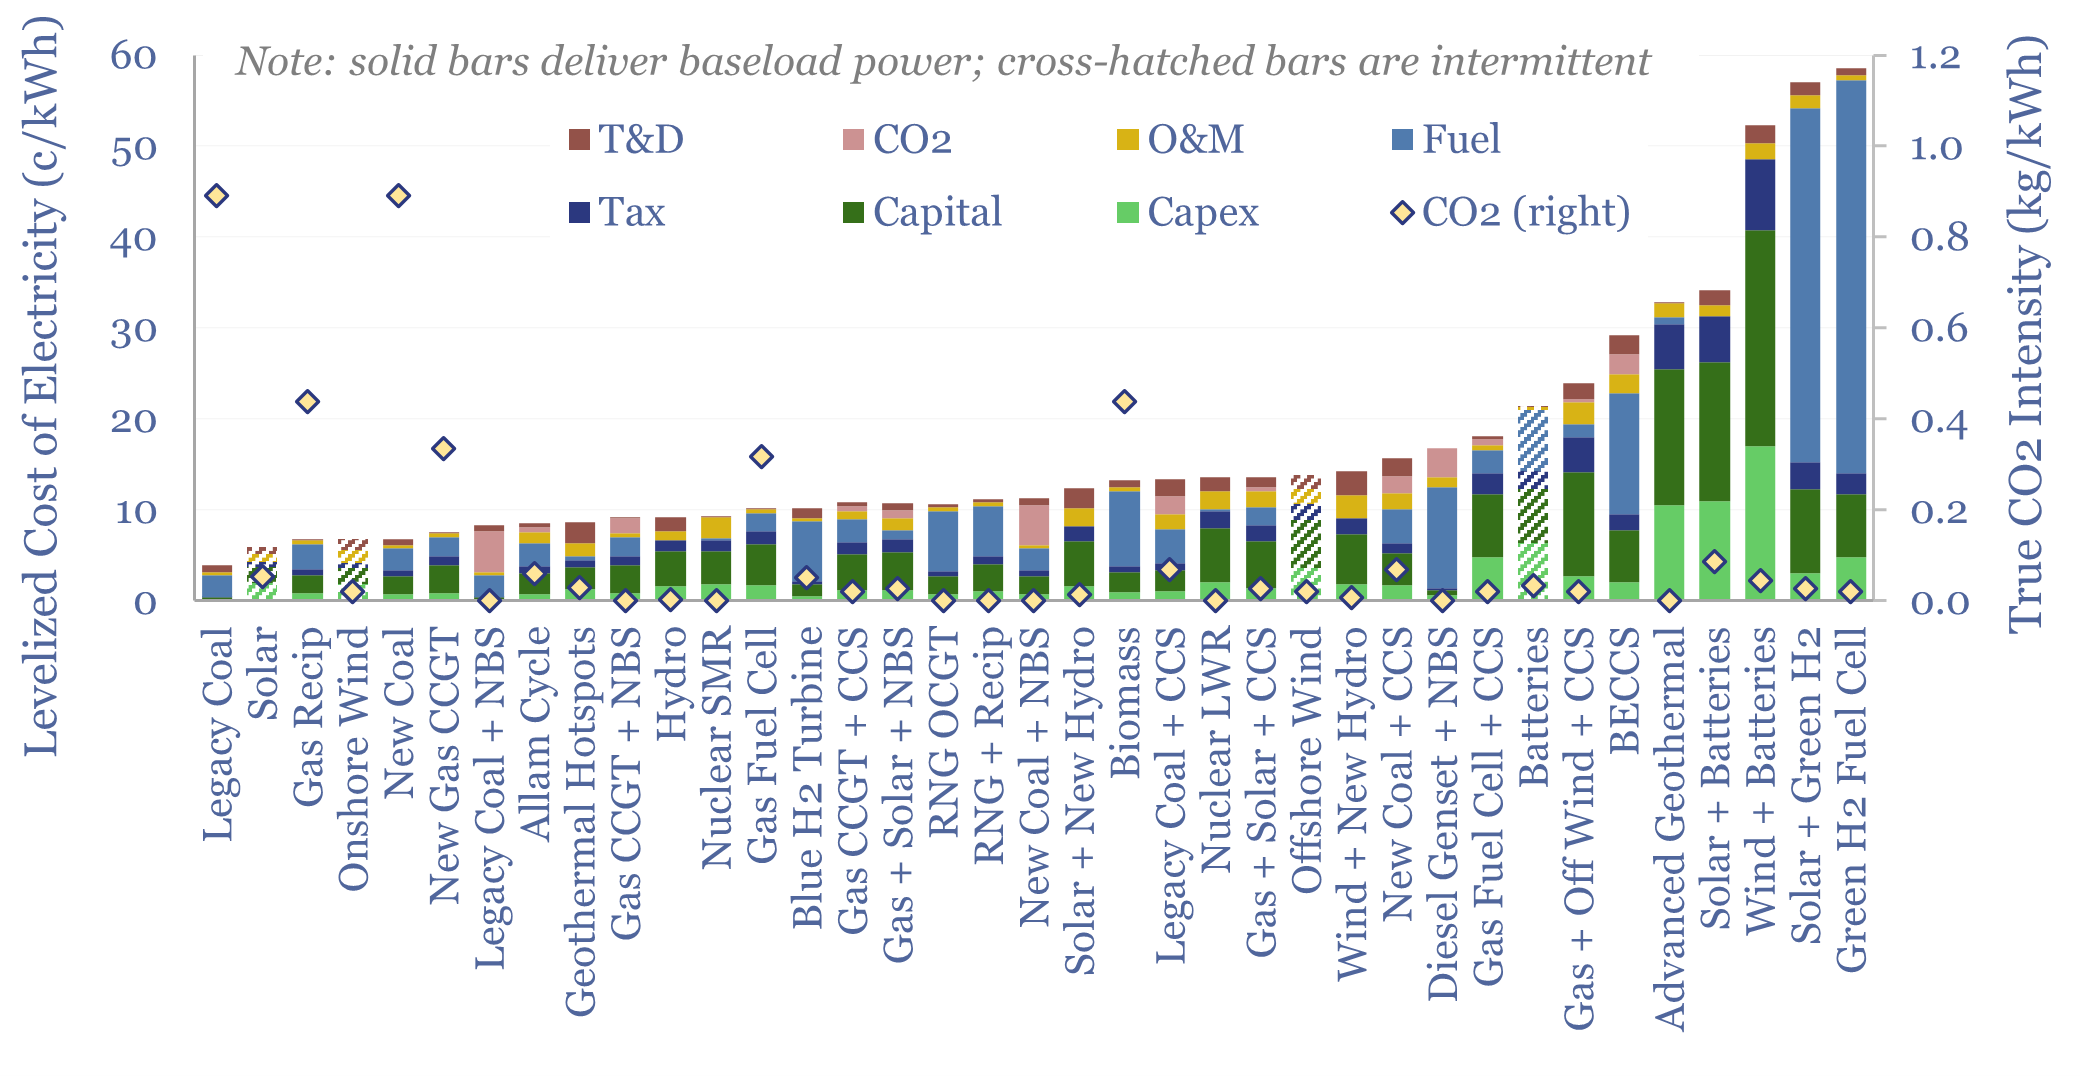
This data-file summarizes the levelized cost of electricity, across 35 different generation sources, covering 20 different data-fields for each source. Costs of generating electricity can vary from 2-200 c/kWh. The is more variability within categories than between them. Numbers can readily be stress-tested in the data-file.
Download the Model?
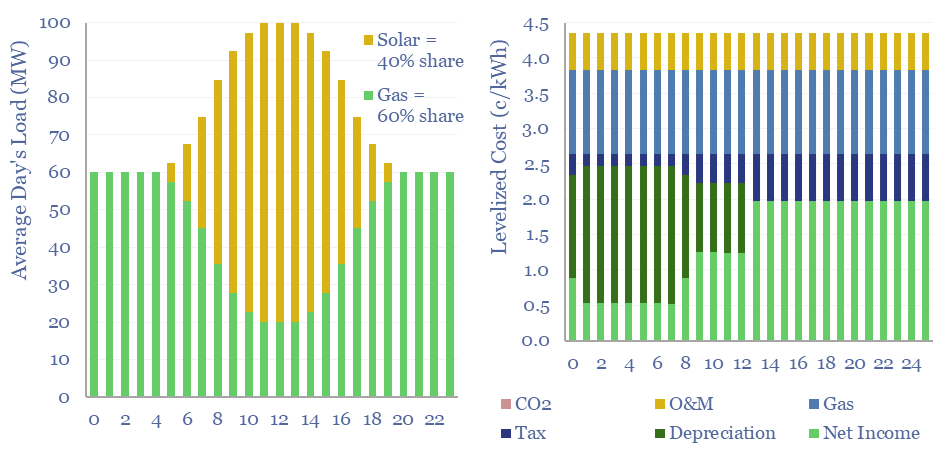
Levelized costs of electricity depend as much on the system being electrified as the energy sources used to electrify it. This data-file captures solar+gas LCOEs (in c/kWh), when meeting different load profiles, as a function of solar capex (in $/kW), gas prices (in $/mcf), and the relative utilization of solar vs gas.
Download the Model?
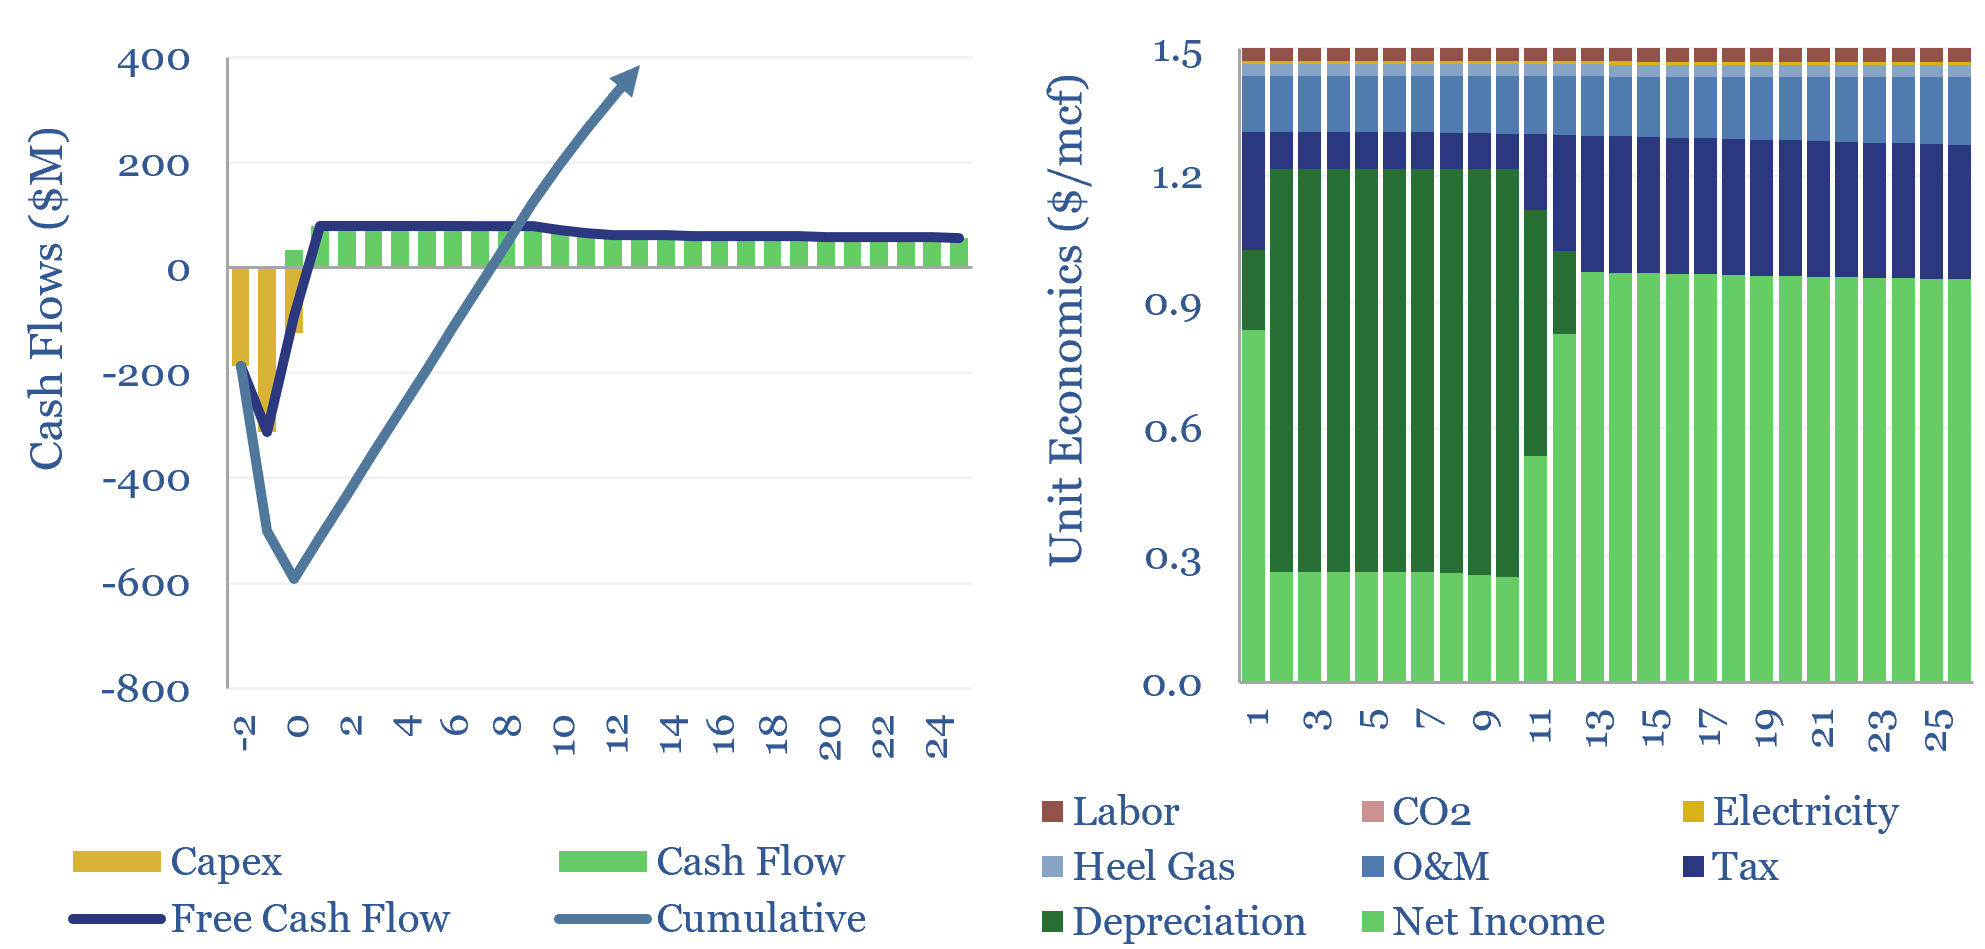
US shale gas economics are captured in this data-file, requiring a $2.5/mcf hub-level gas price, for a 10% IRR, on a large, $17M shale gas well in a basin such as the Marcellus. The marginal cost for unlocking c3% pa production growth from key shale basins is likely in a range of $3-4/mcf, but the evidence for cost reinflation is relatively mild.
Download the Model?
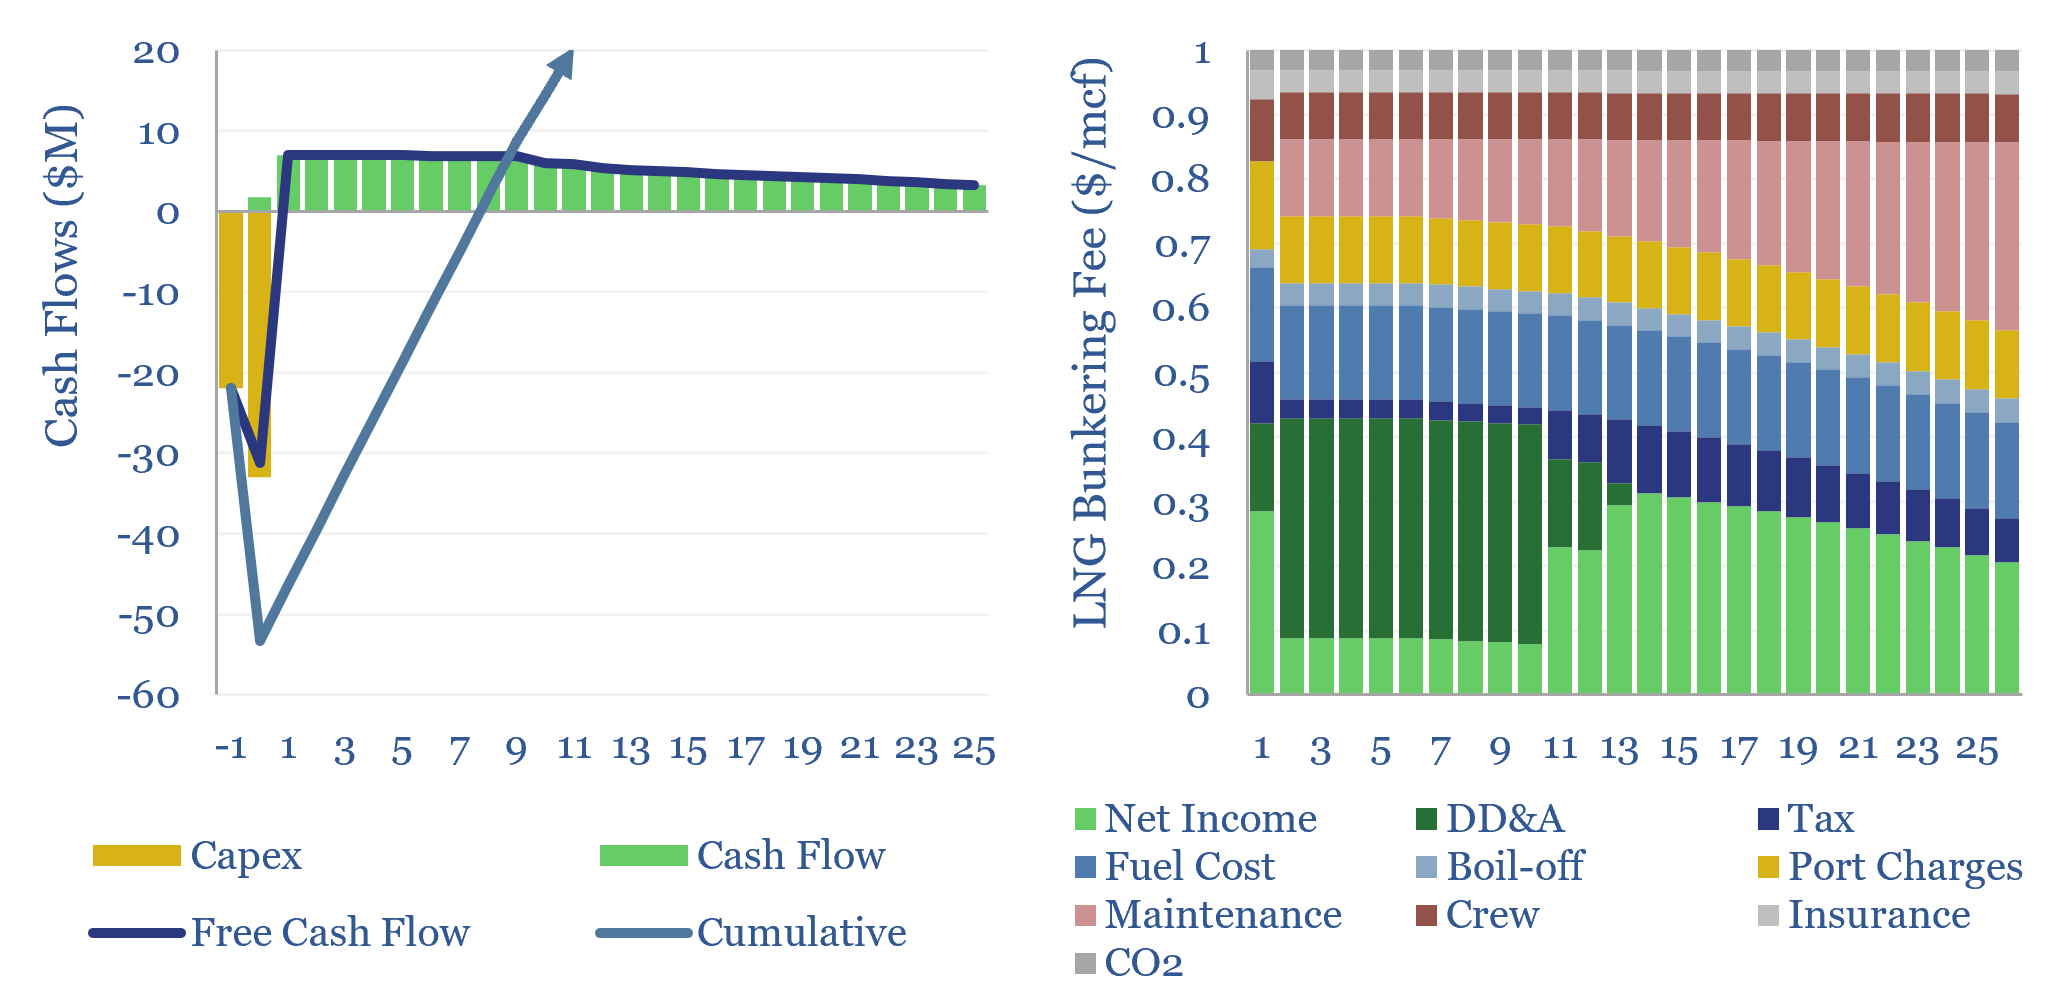
This data-file captures the economics of LNG bunkering vessels. LNG bunkering costs $1/mcf in well-utilized contexts, enabling LNG ship fueling at $8-10/mcf, which is 35% below $2/gal oil products at $70/bbl oil. A 1.5-year payback on dual-fuel vessels could thus see another 10MTpa of LNG used in shipping by 2030, displacing 250kbpd of oil?
Download the Model?
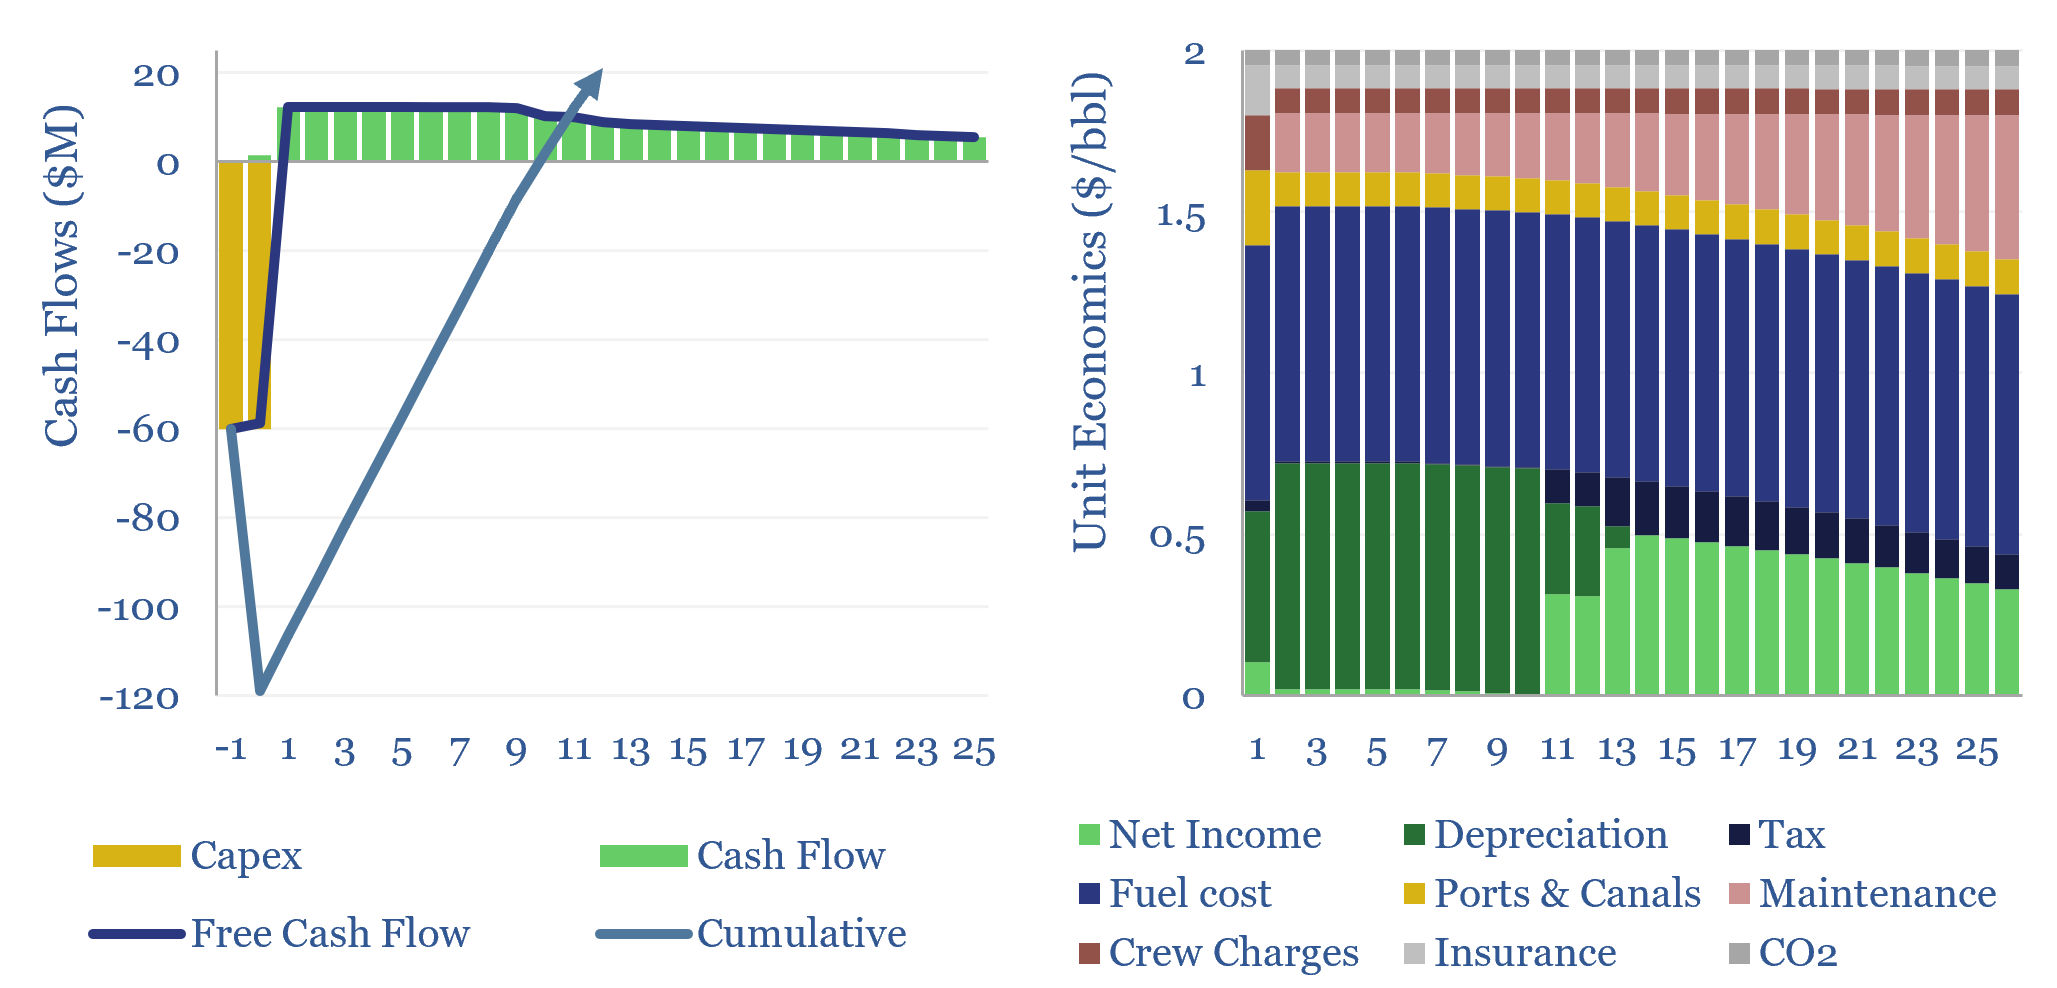
Oil tanker economics are captured in this model. A VLCC that carries 2.2Mbbls requiring a day rate of $100k/day to earn a 7-10% IRR, which equates to $2/bbl on cargoes moving from the Persian Gulf to China. Capex costs, fuel uses, engine sizes and other costs correlate with vessel size. The costs of oil tankers can be stress-tested.
Download the Model?
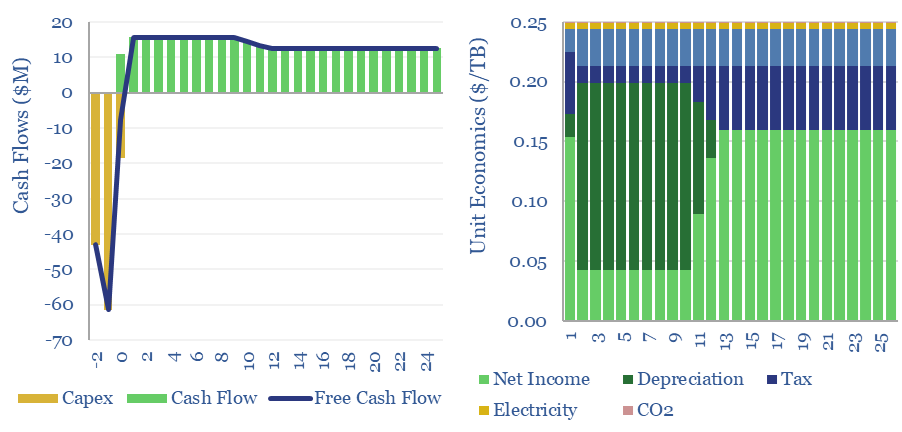
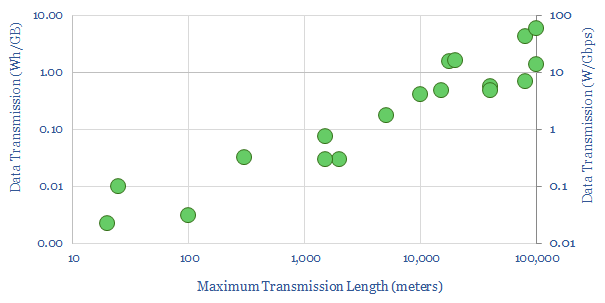
The costs of fiber optic data transmission run at $0.25/TB per 1,000km in order to earn a 10% IRR on constructing a link with $120 per meter capex costs. Capex is 85% of the total cost. This data fiber breaks down the costs of fiber optic data transmission from first principles, across capex, utilization, electricity and maintenance.
Download the Model?
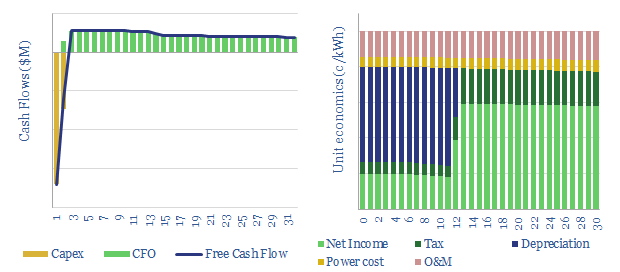
Geothermal energy costs are modelled from first principles in this data-file. LCOEs of 6c/kWh are available in geothermal hotspots. Outside of the hotspots, enhanced geothermal heat can cost 2-14c/kWh-th for a 10% IRR on $500-5,000/kW-th capex, while a rule of thumb is that geothermal electricity costs 5x geothermal heat.
Download the Model?
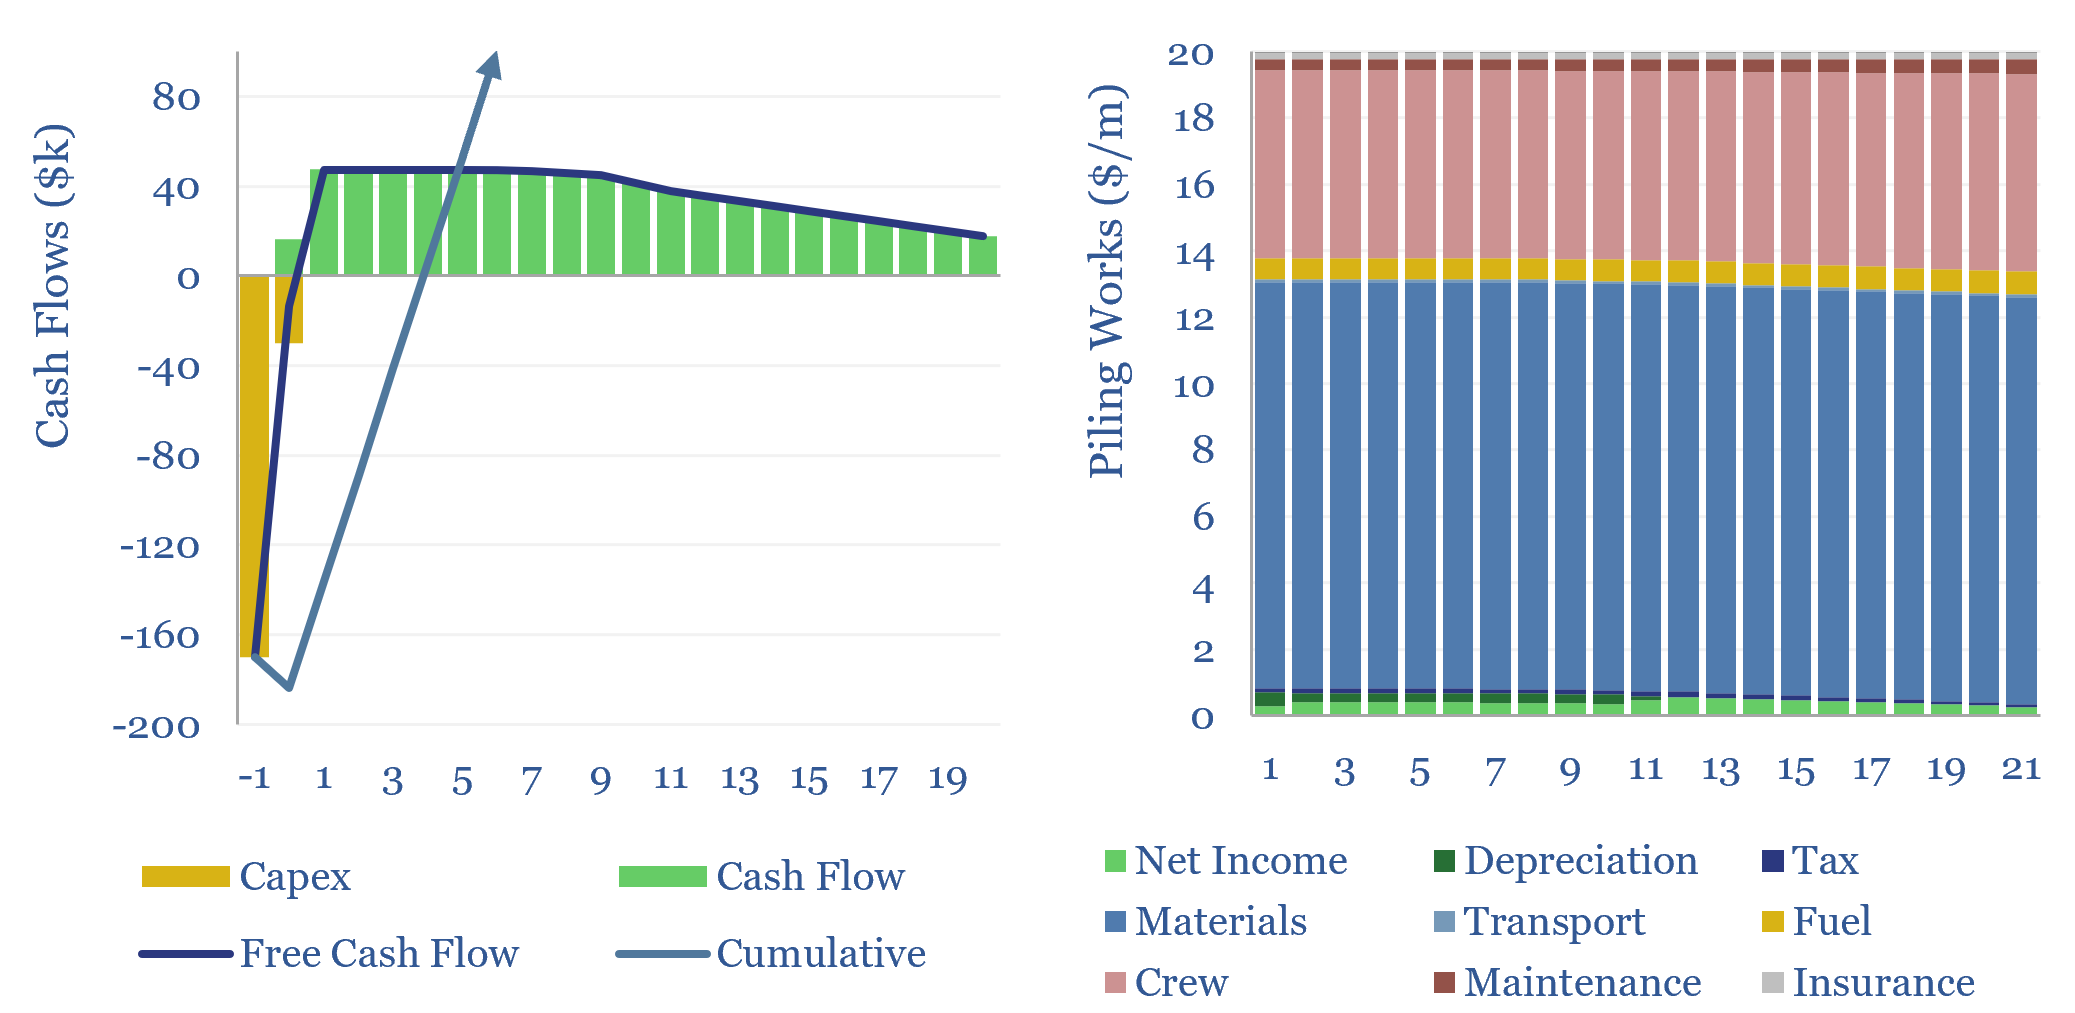
Piling works involve driving long vertical shafts into the ground, which will anchor and support a structure. The costs of piling works can run to $20-200/m, as captured in this data-file, to generate a return and cover the costs of piling operations.
Download the Model?
Grid-scale batteries are envisaged to store up excess renewable electricity and re-release it later. Grid-scale battery costs are modeled at 17c/kWh in our base case, which is the ‘storage spread’ that a LFP lithium ion battery must charge to earn a 10% IRR off c$1,000/kW installed capex costs. Other batteries can be compared in the data-file.
Download the Model?
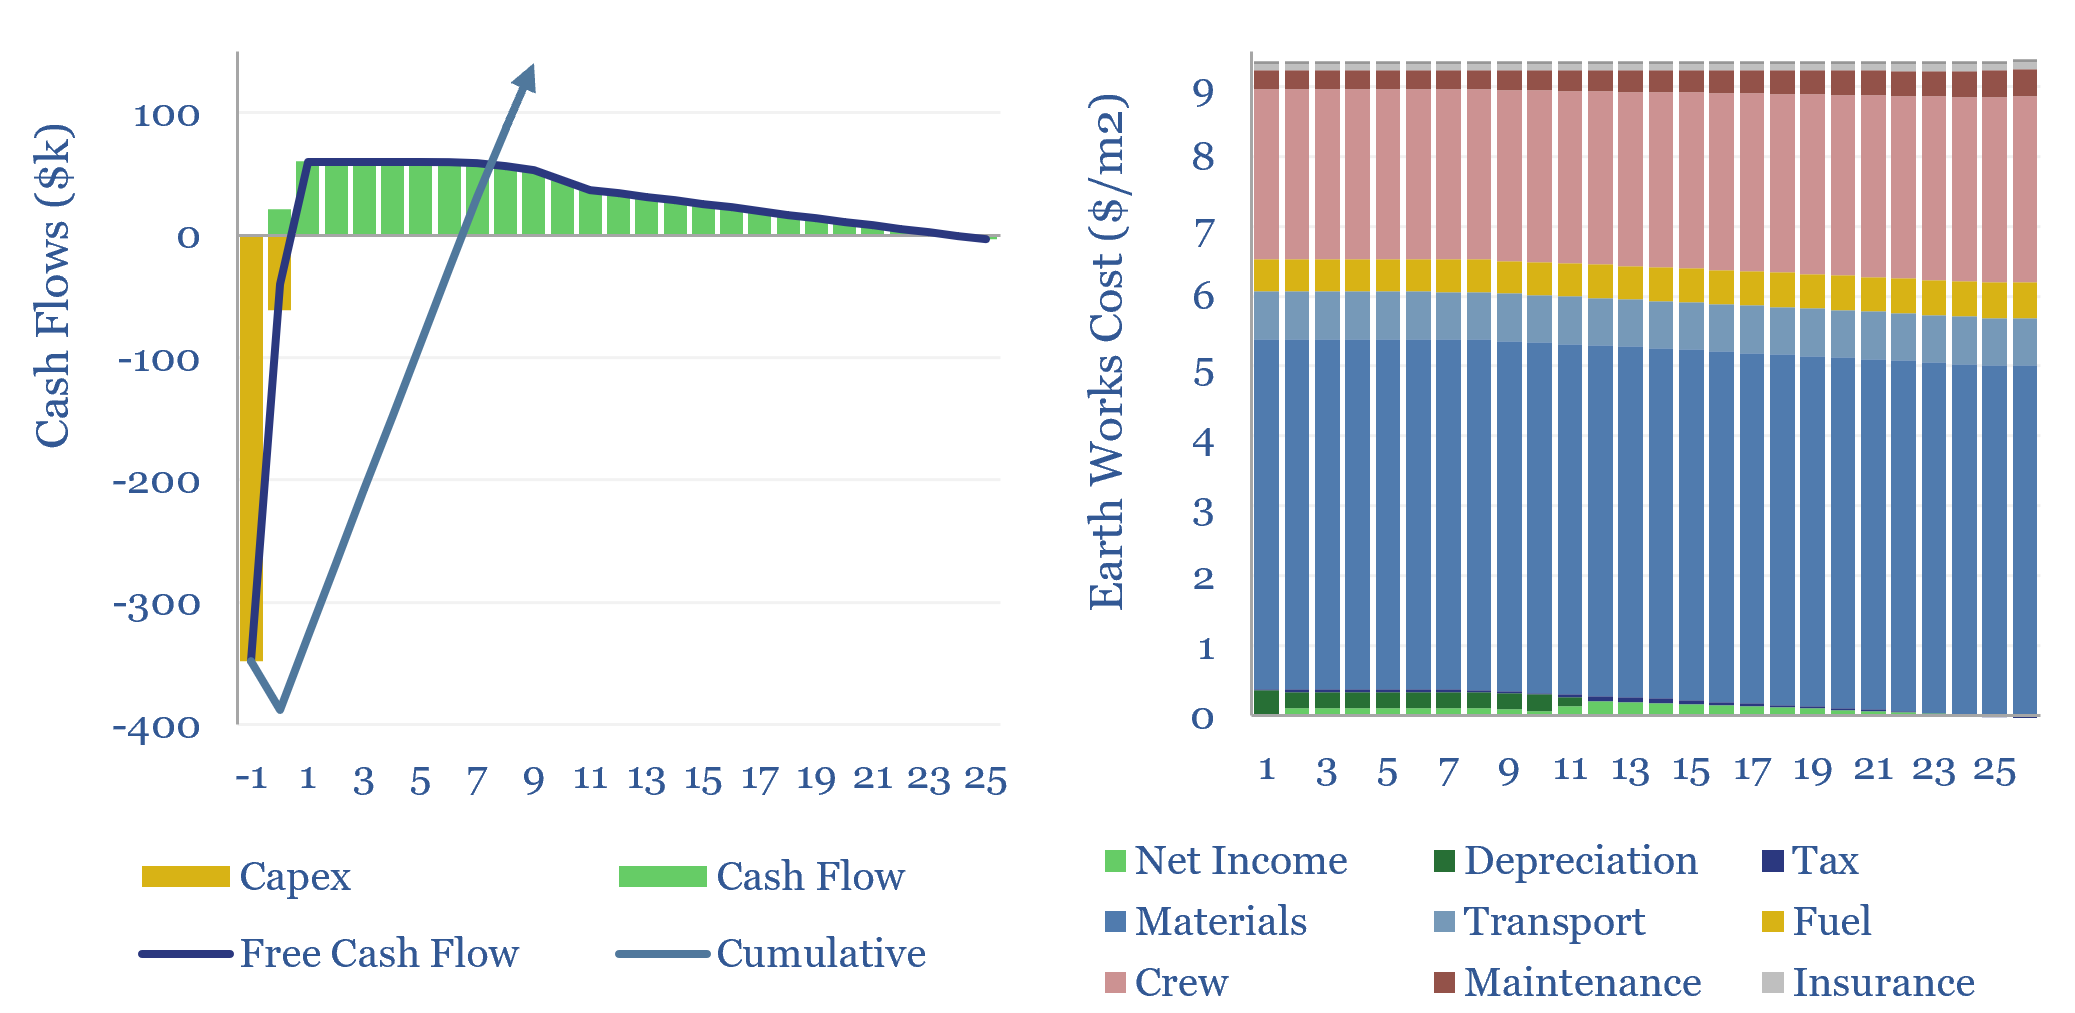
The costs of earthworks might range from $1/m2 to $300/m2 at a construction project, depending on the depth that needs to be excavated and the amount of aggregate that needs to be back-filled. This data-file estimates the costs of earthworks, across power and energy projects, which is usually around $10-15/kW.
Download the Model?
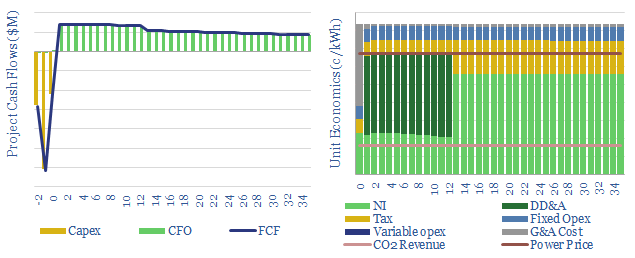
Renewable diesel economics are captured in this data-file, requiring a price of $4.5-5/gallon (about $200/bbl), for a green diesel plant costing $35M/kbpd to generate a 10% IRR while hydroprocessing $1,000/ton feedstocks. Please download the data-file to stress-test renewable diesel economics, biodiesel economics and input costs.
Download the Model?
This data-file captures helicopter economics. For an Airbus SuperPuma, which can carry c20 passengers, helicopter costs are estimated at $4,000/hour and $30/mile, for a c10% IRR on c$30M of capex costs. Economics can be stress-tested for different helicopter models and operating assumptions.
Download the Model?
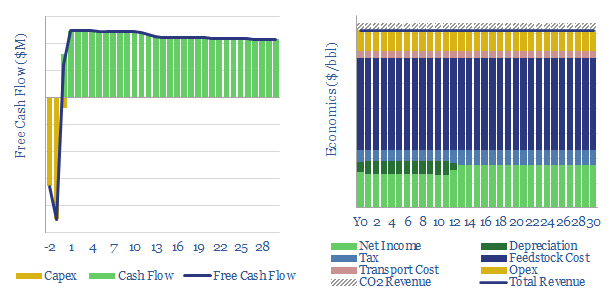
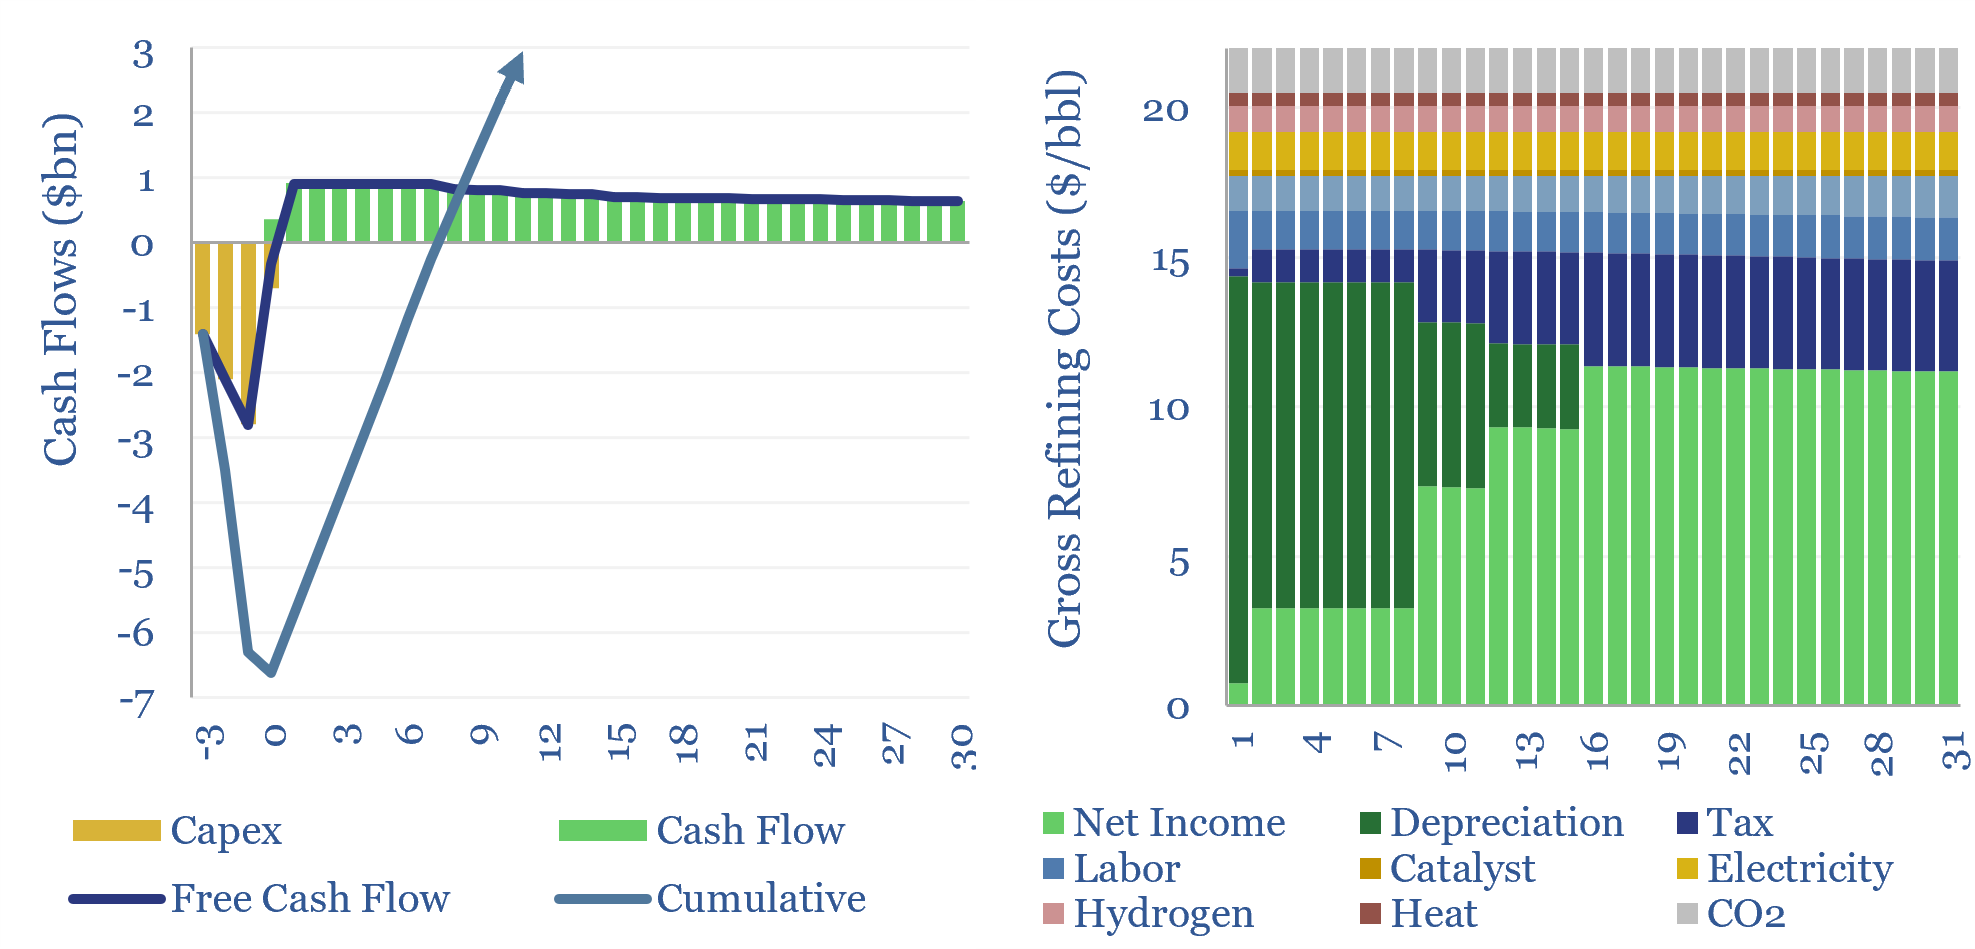
The economics of oil refining are captured in this data-file, requiring a crack spread above $20/bbl to generate a 10% IRR on a new, greenfield oil refinery in the developed world, with $35M/kbpd in capex costs. Crack spreads have run at $11/bbl in the past decade, hence capacity utilization is tightening.
Download the Model?
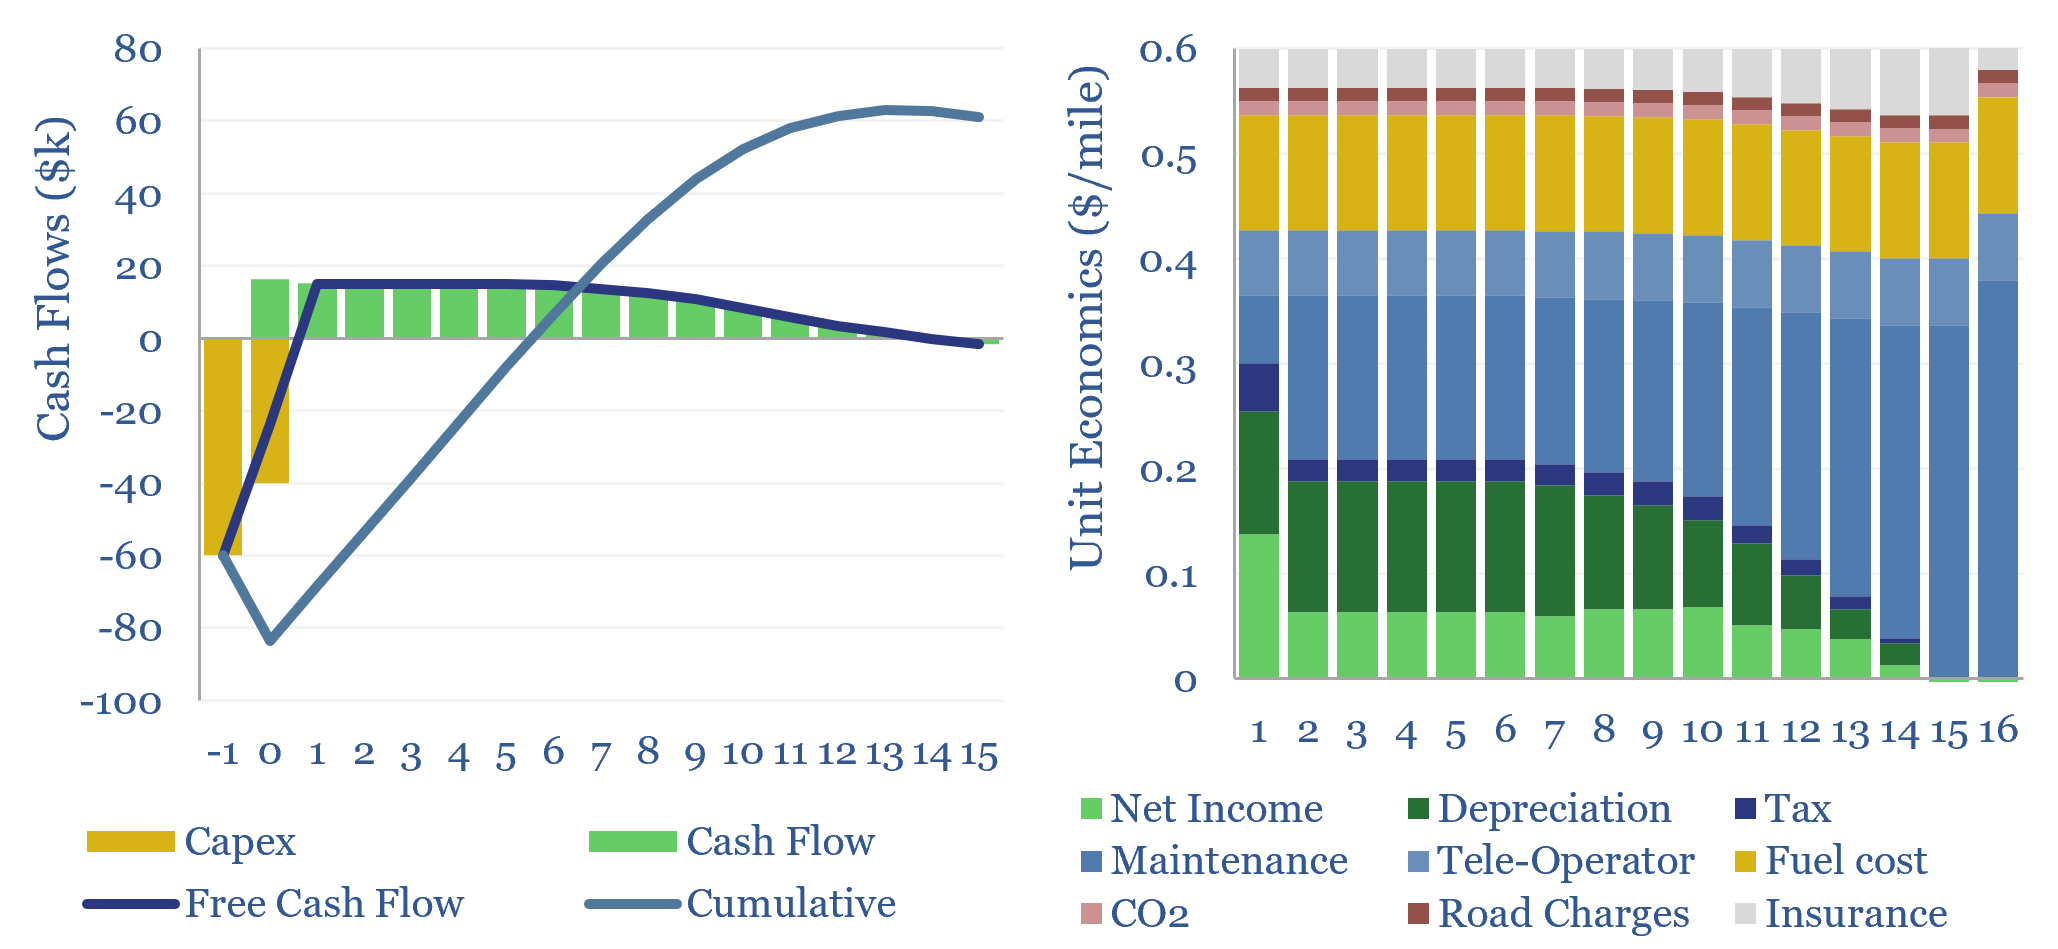
This data-file explores the costs of autonomous vehicles. An autonomous vehicle traveling c100,000 miles per year, at 20% capacity utilization, must charge a fee of $0.6/mile, in order to generate a 10% IRR on c$100k of vehicle acquisition capex.
Download the Model?
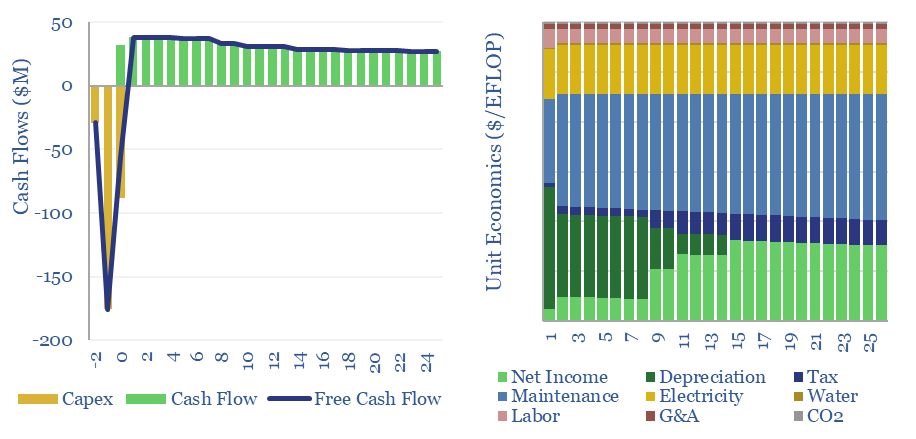
The capex costs of data-centers are typically $10M/MW, with opex costs dominated by maintenance (c40%), electricity (c15-25%), labor, water, G&A and other. A 30MW data-center must generate $100M of revenues for a 10% IRR, while an AI data-center in 2025+ may need to charge $10/EFLOP of compute.
Download the Model?
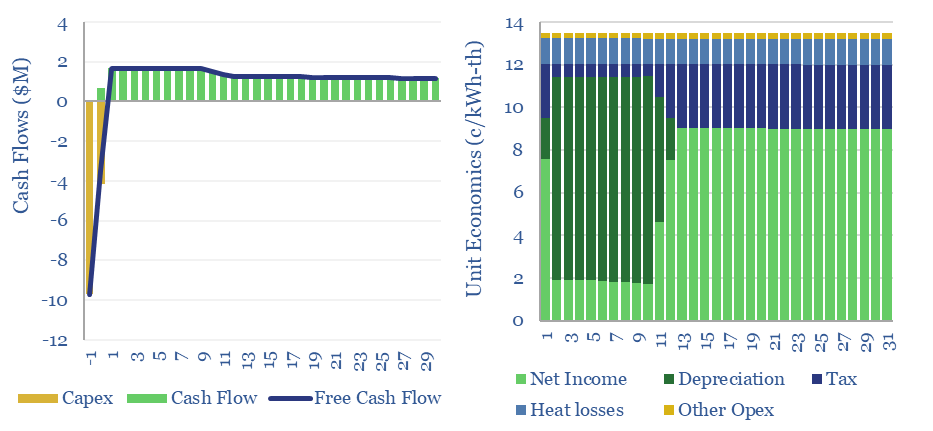
This data-file captures the costs of thermal energy storage, buying renewable electricity, heating up a storage media, then releasing the heat for industrial, commercial or residential use. Our base case requires 13.5 c/kWh-th for a 10% IRR using molten salt or sand, and as little as 5c/kWh-th when using low-cost graphite/petcoke modules.
Download the Model?
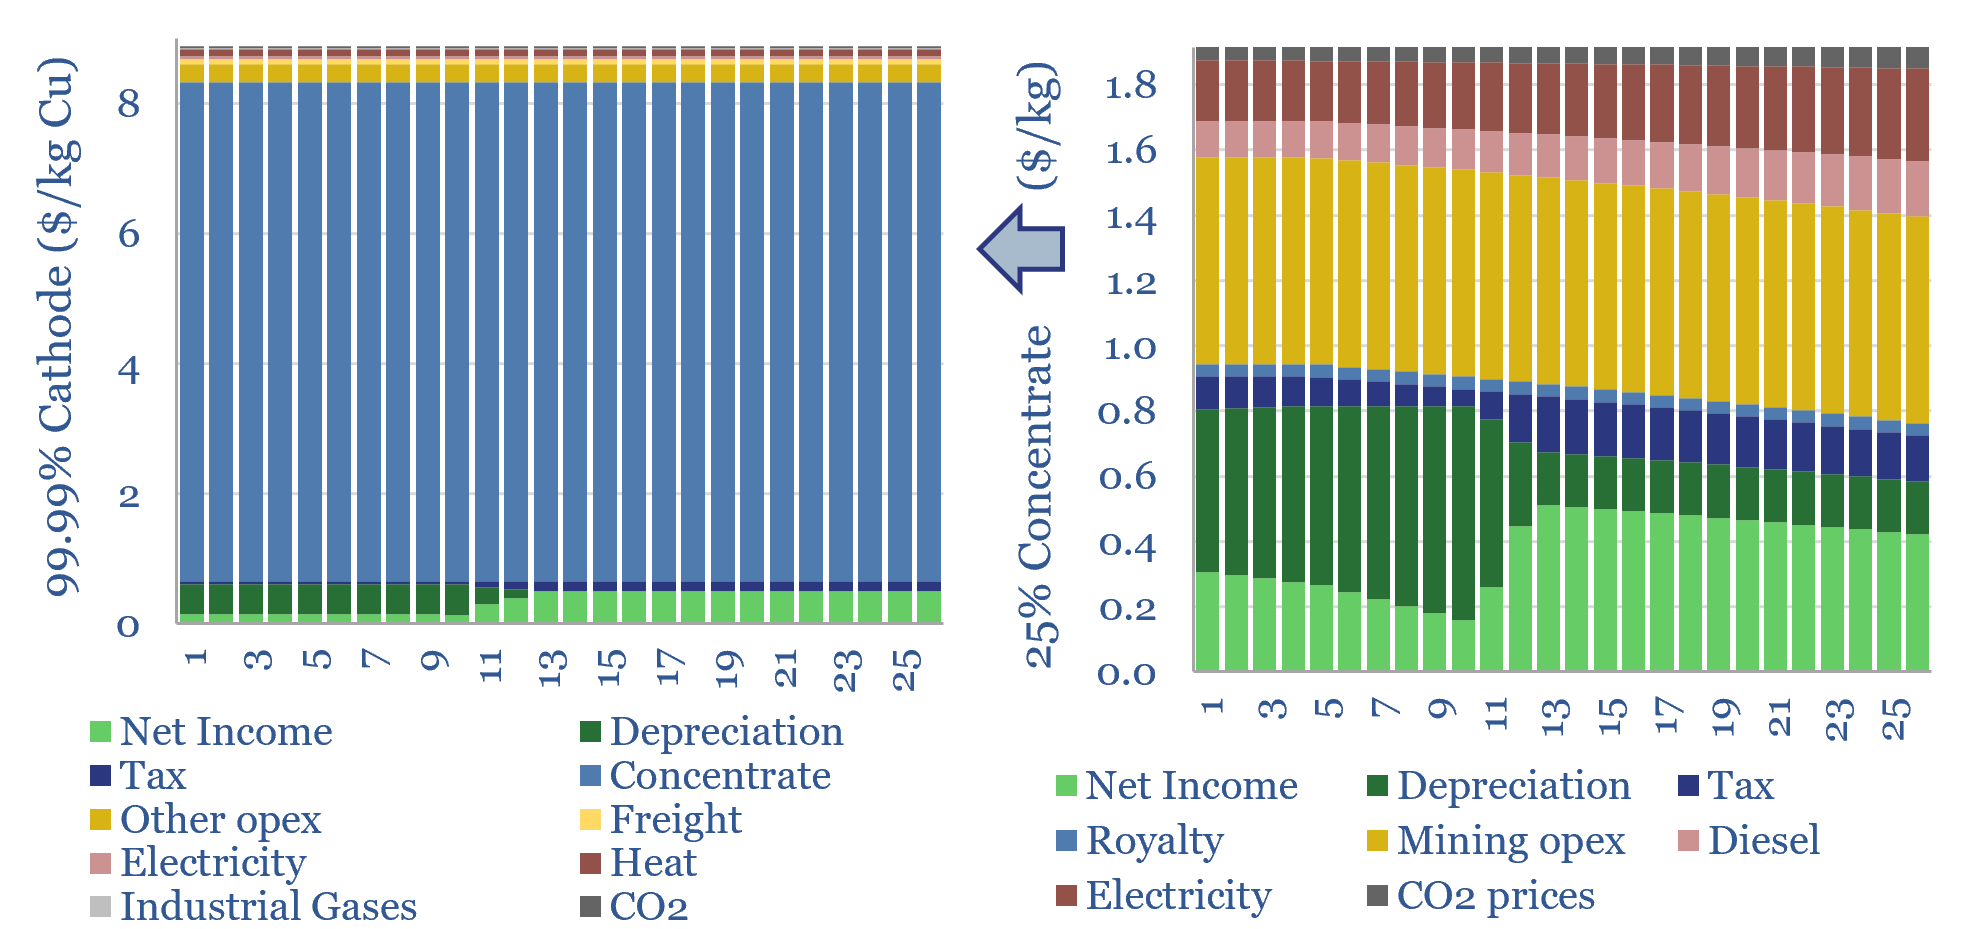
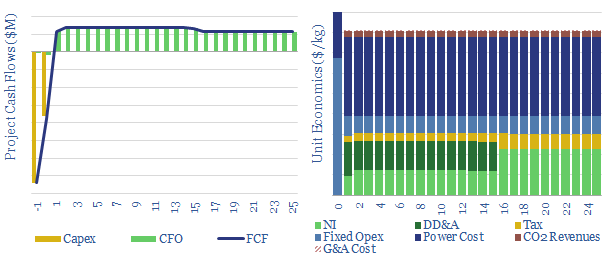
The economic cost of copper production is built up from first principles in this model, from mine, to concentrator, to smelter to 99.99% pure copper cathodes. Our base case is $9/kg copper cathode, for a 10% IRR, with 4 tons/ton CO2 intensity, after starting from an 0.45% ore grade. But higher IRRs may be needed to incentivize sufficient project development. Numbers vary sharply and can be stress-tested in the data-file.
Download the Model?
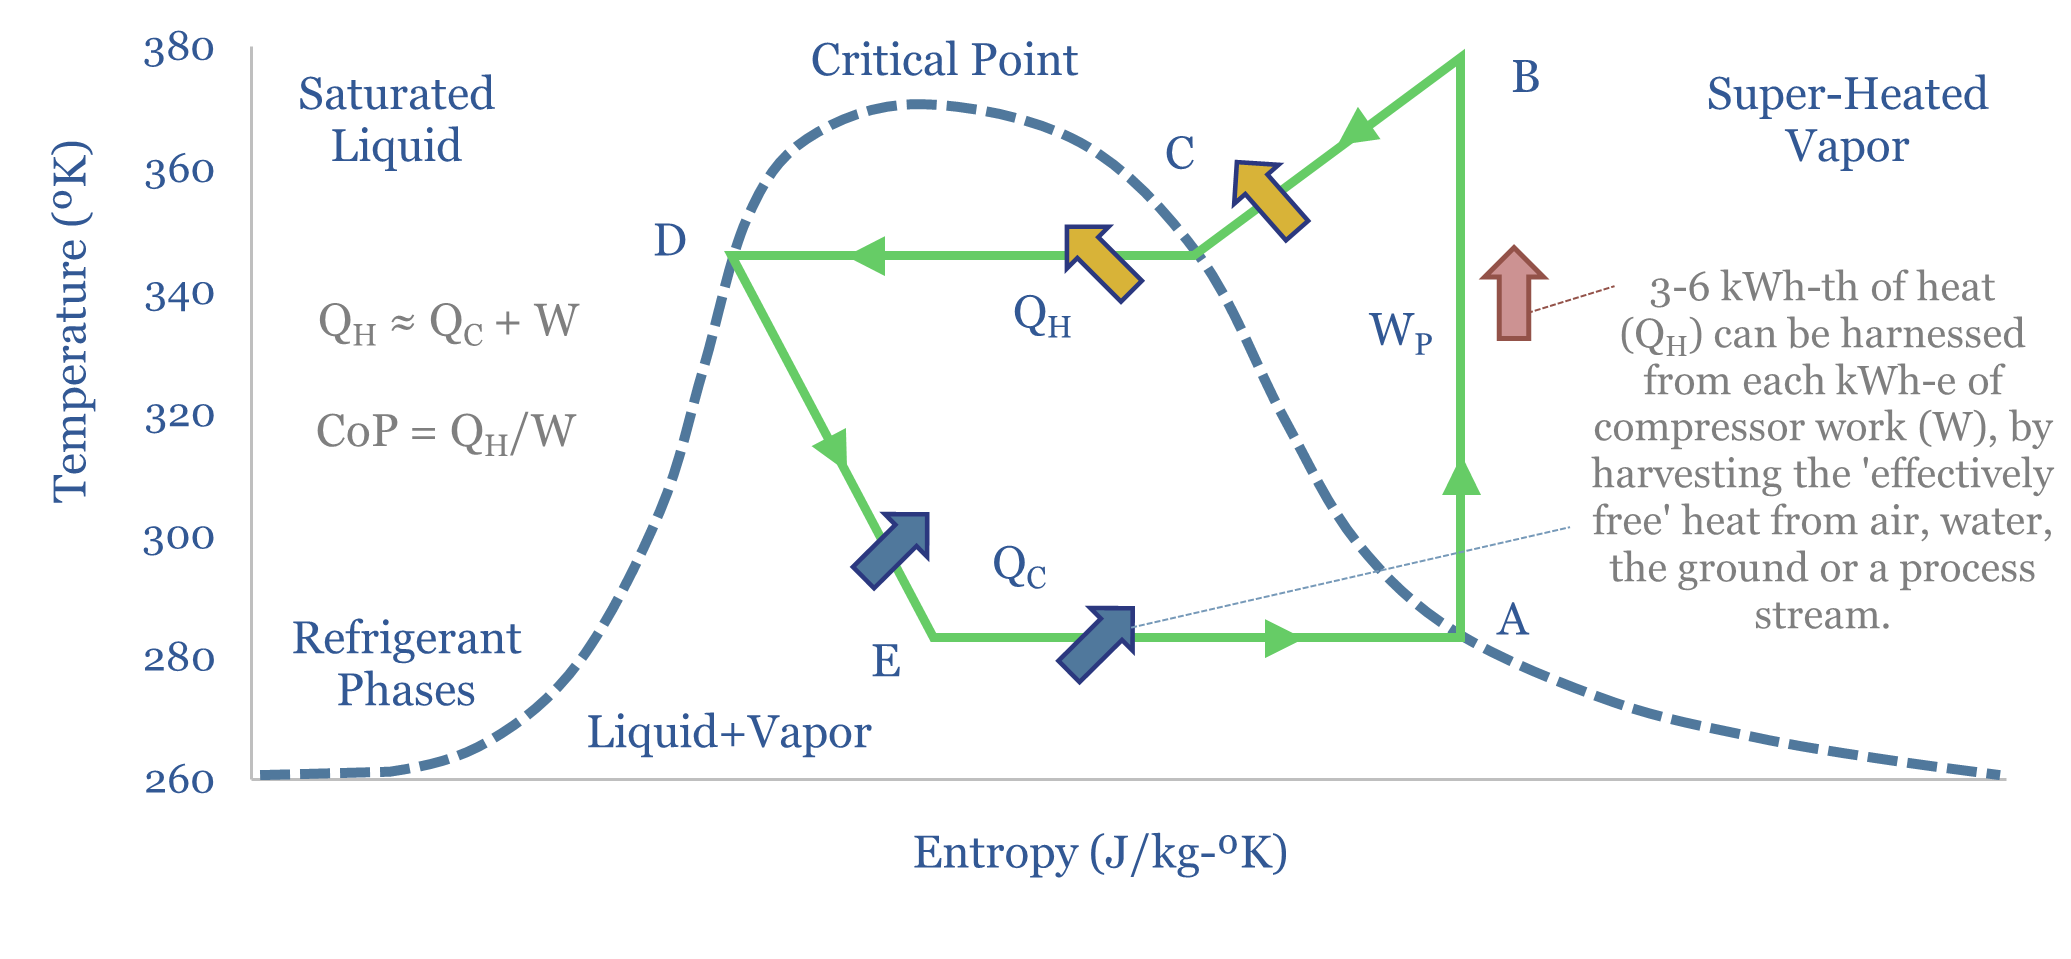
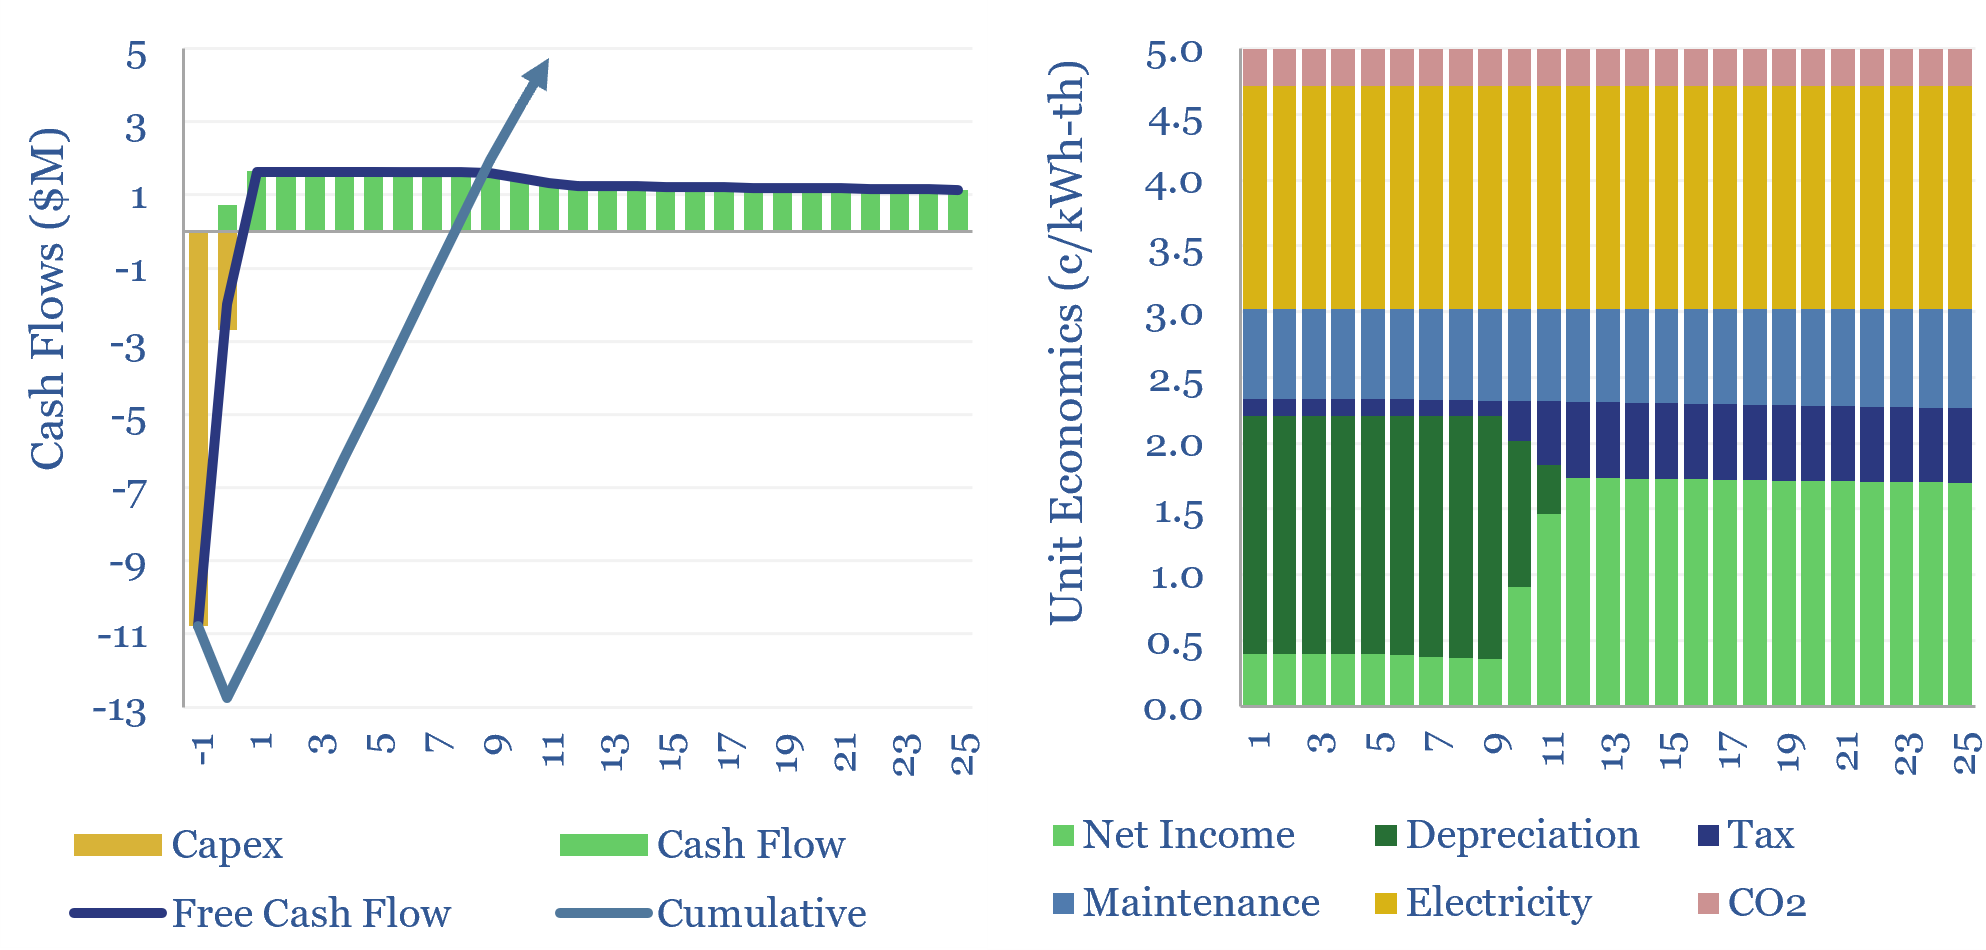
Industrial heat pump costs typically average 5c/kWh-th, when generating round-the-clock heat from 6c/kWh electricity, with a 3.5x Coefficient of Performance, and achieving a 60ºC heat lift. Our models do not yet show heat pumps, energized by excess renewables, outcompeting gas heat, especially for larger or higher-temperature applications. Costs can be stress-tested in this model.
Download the Model?
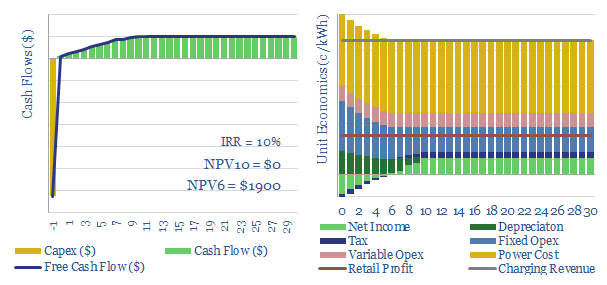
An electric vehicle charging station typically needs to charge 20-25 c/kWh, to earn a 10% return on its up-front capex costs, as it buys power for 10c/kWh and sells it on to electric vehicles with 10-50% utilization rates. Larger, fast-chargers seem most economic. Especially where retail revenues support the economics of EV-charging.
Download the Model?
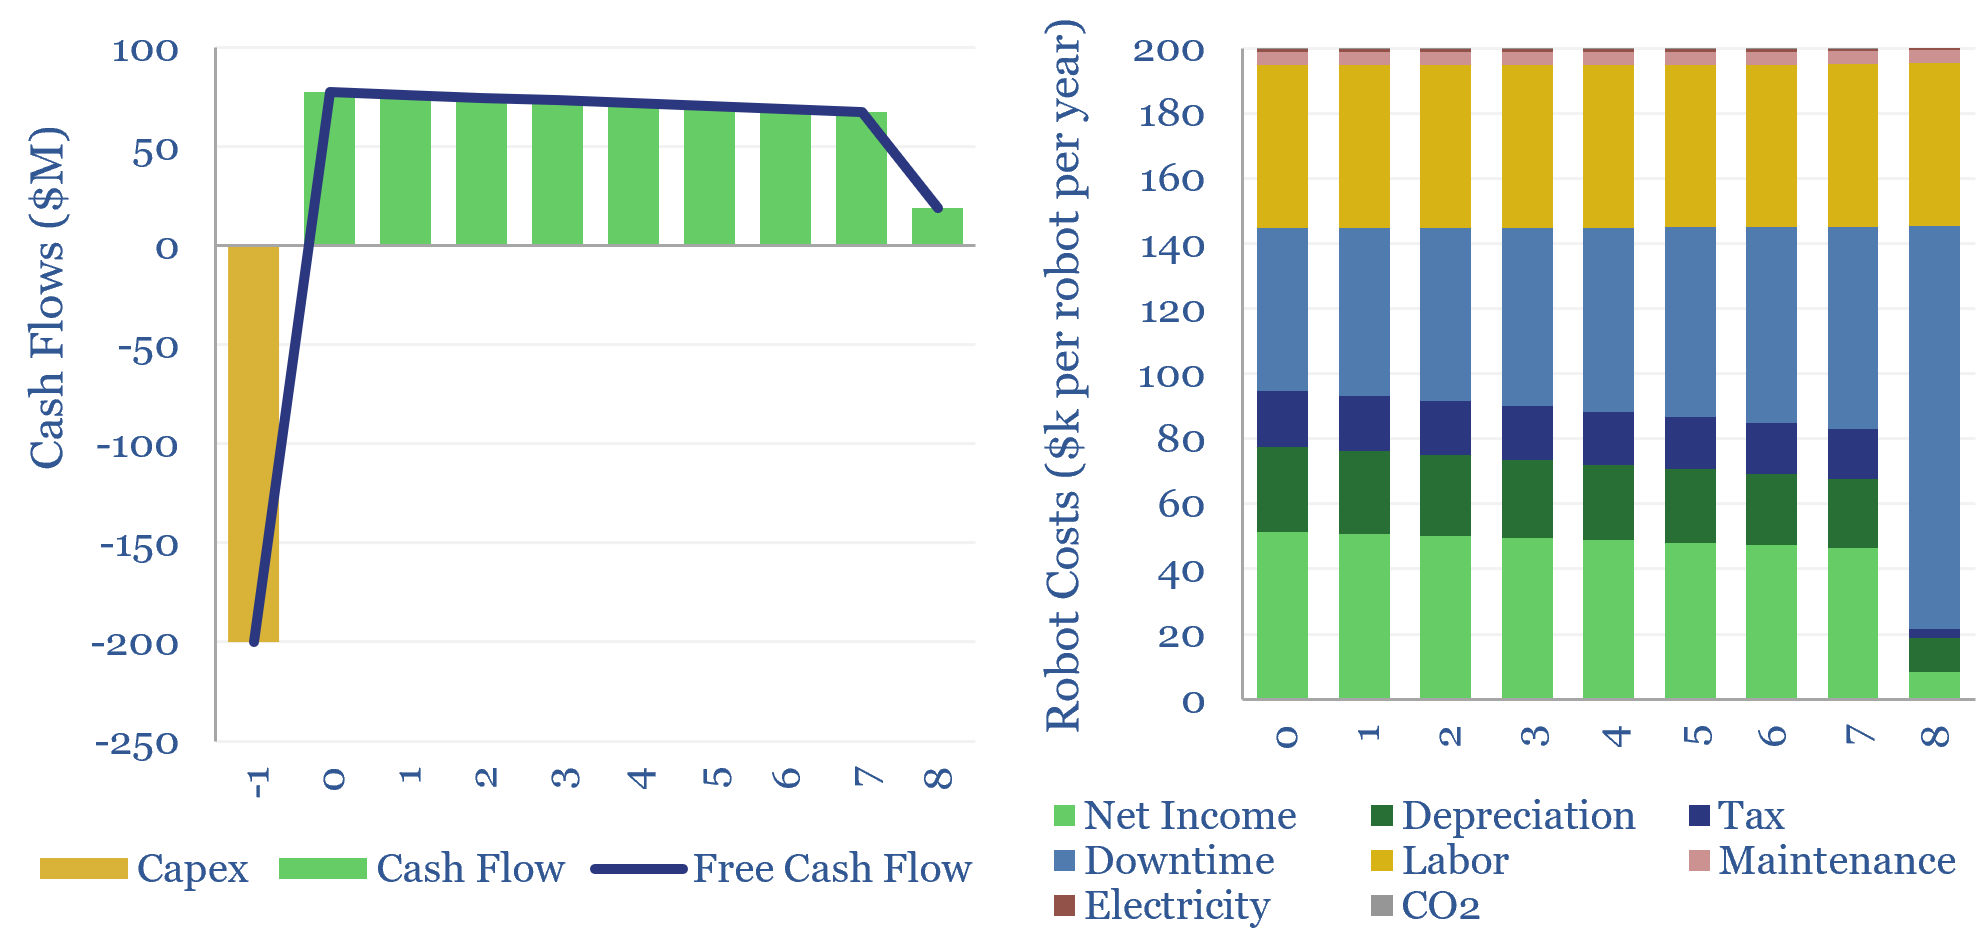
There are 5M industrial robots deployed globally. A typical example costs $130k to install, does incur costs to run, but displaces 1.3 FTE jobs, saves 50% total costs, and thus achieves a payback of 1.5-years and a project-level IRR of 65%. This data-file captures the economics of deploying industrial robots.
Download the Model?
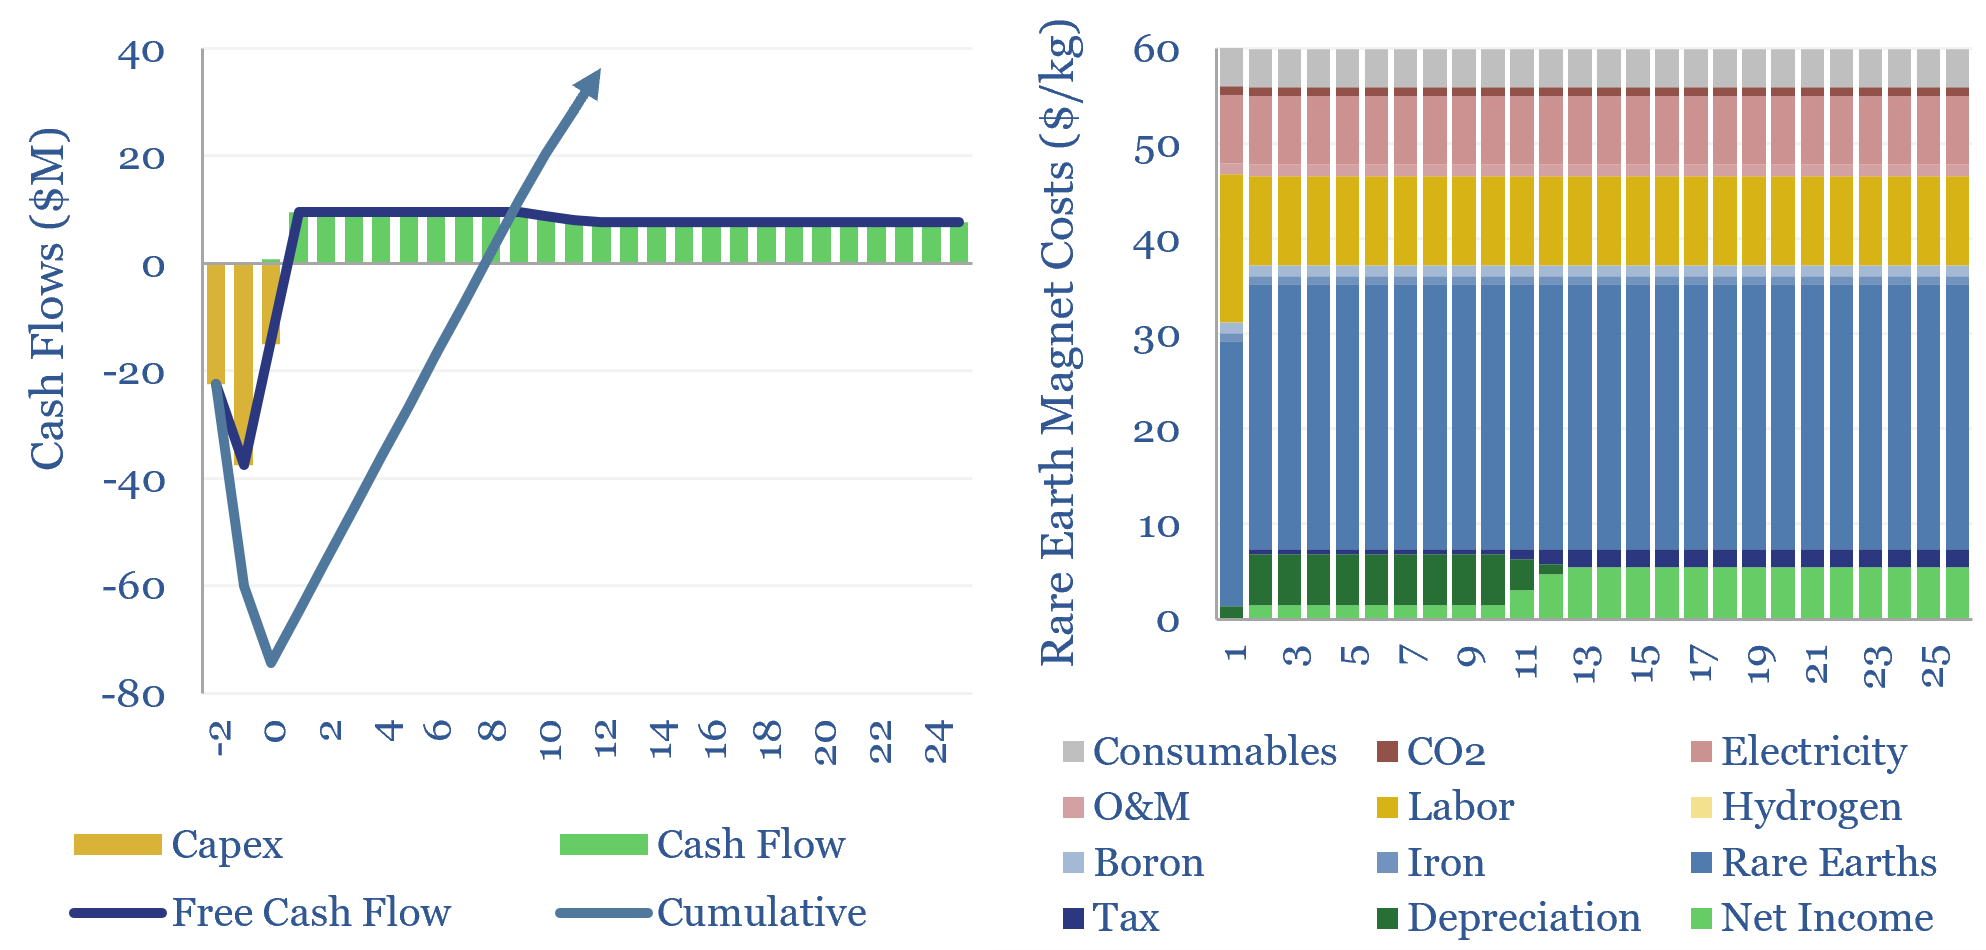
The economics of Rare Earth magnet manufacturing are captured in this data-file. A $60/kg magnet price unlocks a 10% IRR at a new facility converting Rare Earths, steel and ferroboron into sintered NdFeB magnet products, repaying capex and cover other magnet manufacturing costs.
Download the Model?
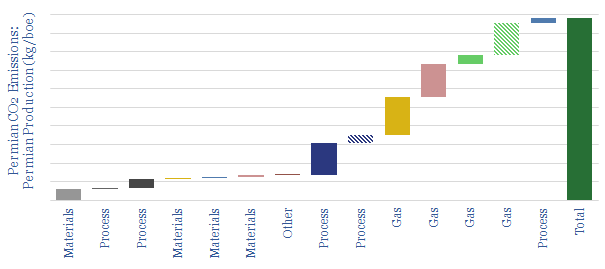
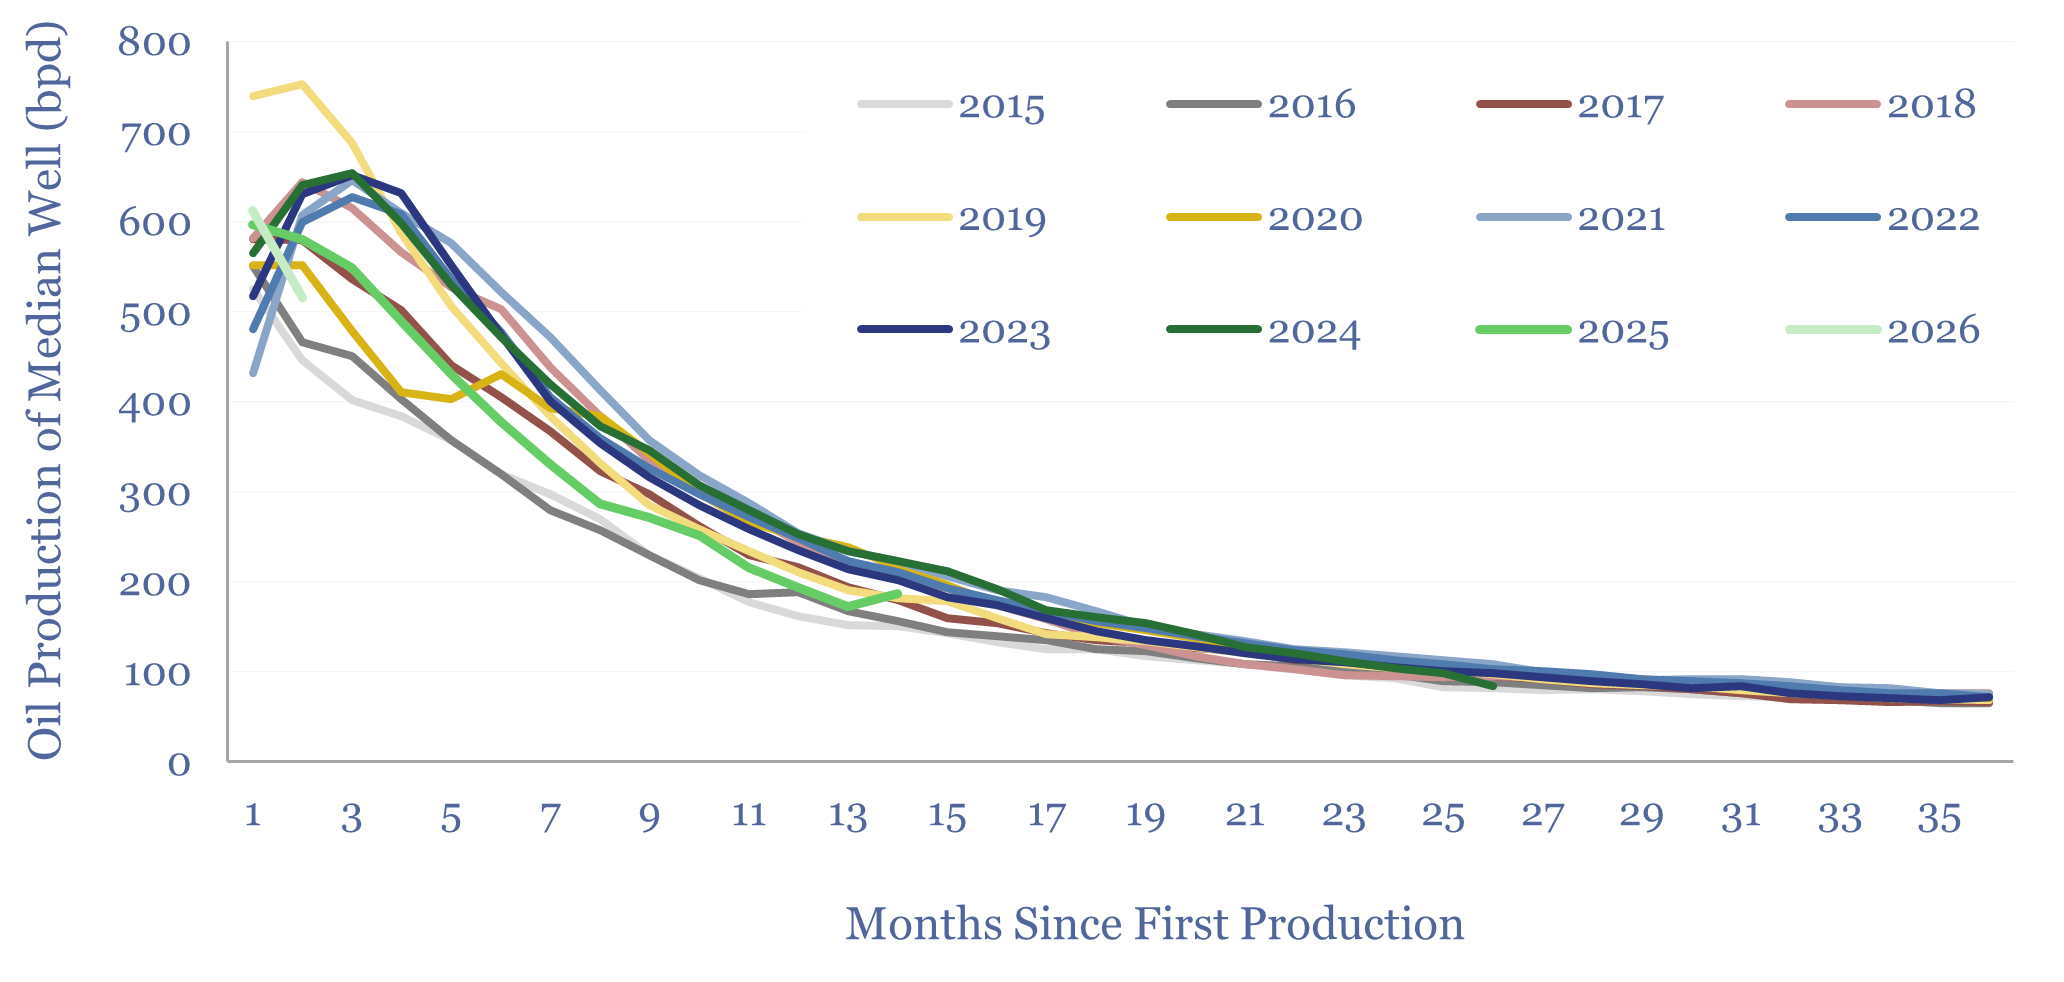
Shale oil production costs are captured in this data-file. In our base case, a $60/bbl oil price unlocks a 30% well-level IRR at a Permian-type well in 2025, costing $10M in capex, IP-ing at 1kbpd, with other costs based on technical papers and the reporting from leading US E&Ps. Shale oil economics can be stress-tested in the data-file.
Download the Model?
We have modelled the economics of a green hydrogen project, electrolysing water using renewable energy. An H2 price of $8/kg ($60/mcfe) is required to earn a 10% return. Costs data are captured. The most challenging input variable is not capex cost or efficiency, but utilization rate, if the project is to be truly green.
Download the Model?
Microgrid economics are captured in this data-file. A 20c/kWh levelized cost of electricity is needed to generate a 10% IRR on a typical $5,000/kW system, sourced by solar, batteries and gas generation, plus controllers, switchgear and instrumentation.
Download the Model?
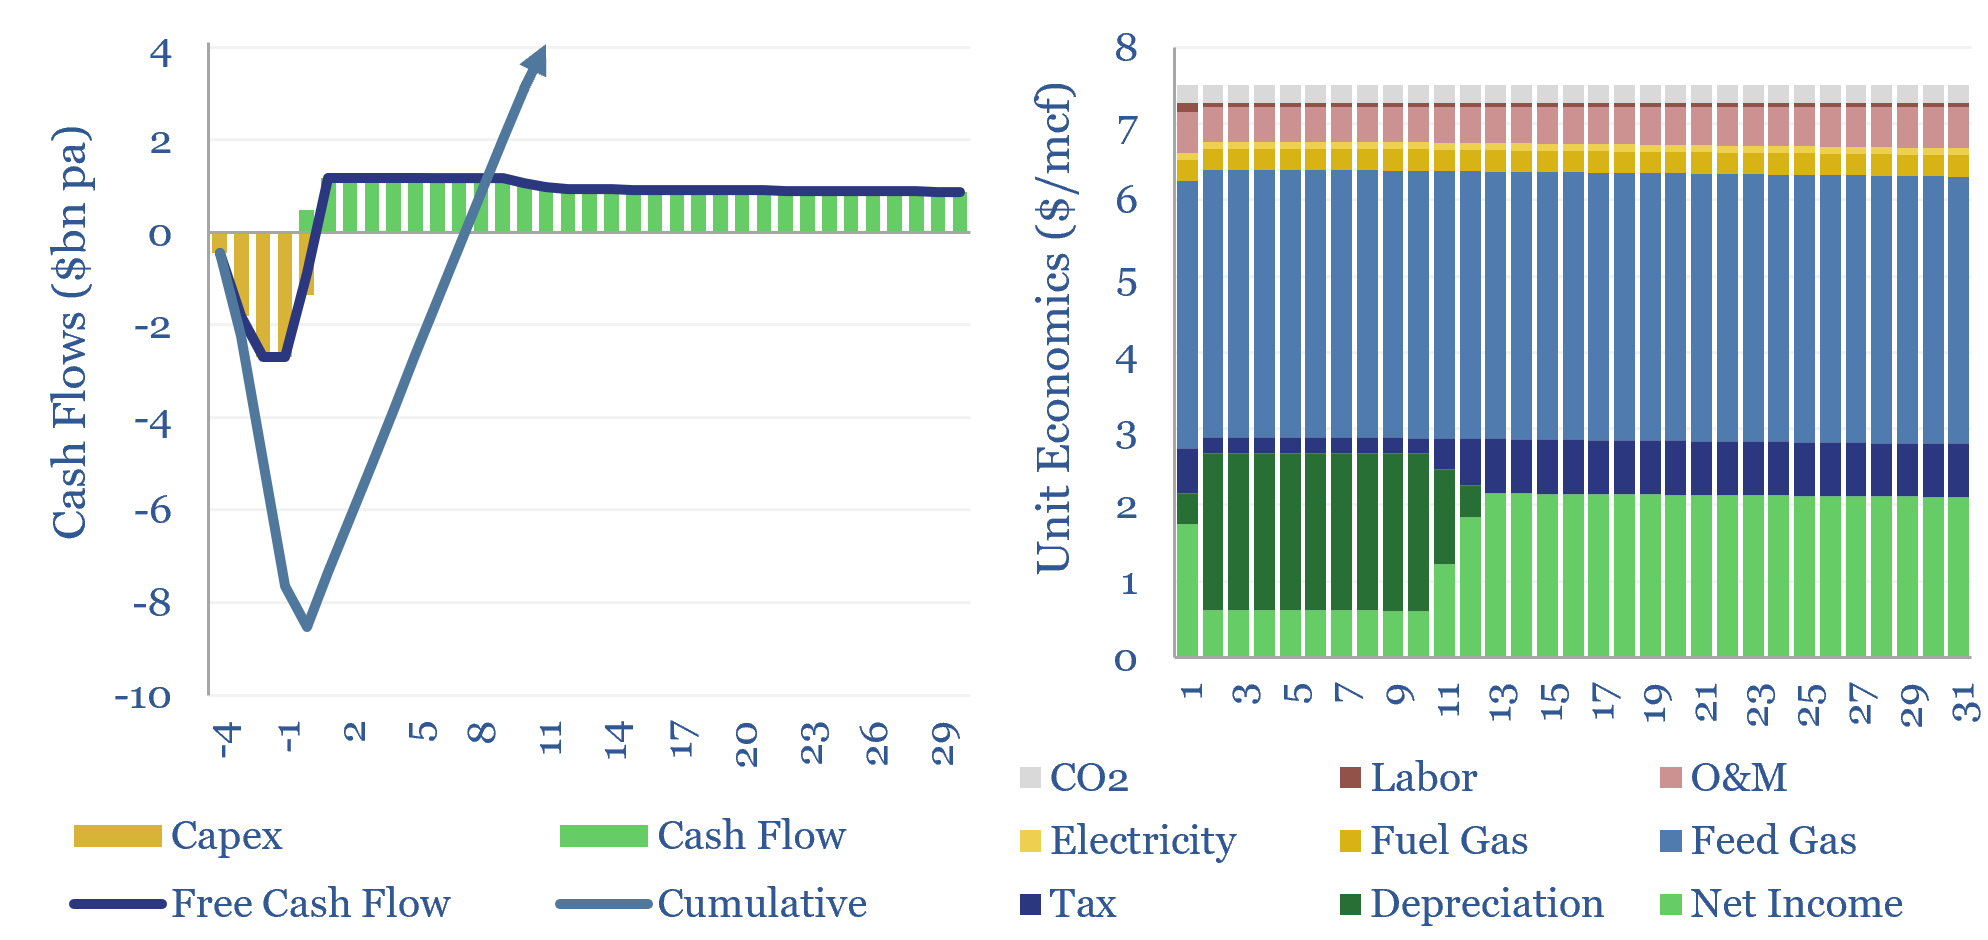
This model captures the economics of a typical LNG liquefaction project. In our base case, a greenfield LNG project costing $900/Tpa in capex must charge a $4/mcf liquefaction spread for a 10% IRR. $3.5/mcf input gas prices thus result in $7.5/mcf LNG on the water. Numbers can be stress-tested in the file.
Download the Model?
Gas storage economics are captured in this data-file. In our base case, a 30bcf underground storage facility, which cycles 2mcf per year of gas per mcf of gas capacity, requires a storage spread of $1.5/mcf to generate a 10% IRR off $19/mcf of capex. Effectively, this is inter-seasonal energy storage for 0.5c/kWh-th.
Download the Model?
Alaska LNG project economics are captured in this data-file, capable of landing gas into Asia at $9/mcf while also earning a 10% project-level IRR, as long as the total project can be delivered on time and on budget at $44bn. Inflation to $60bn erodes the IRR to 6% or requires a $12/mcf landed price into Asia.
Download the Model?
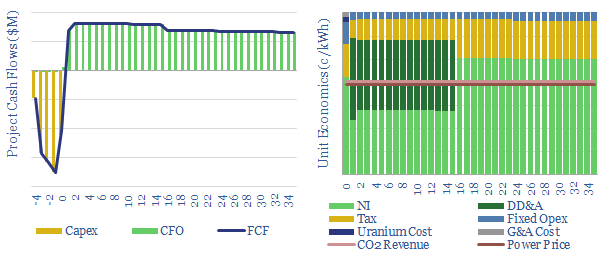
This data-file models the costs of nuclear power project, based on technical papers and past projects around the industry. An up-front capex cost of $6,000/kW might yield a levelized cost of 15c/kWh. But 6-10c/kWh is achievable via a renaissnace in next-generation nuclear.
Download the Model?
This data-file captures the economics of LPG exports, ethane exports, and/or propane exports from North America to Europe and Asia. Capex costs of LPG exports are c50% below LNG. Recent pricing underpins project-level c30% IRRs. The project pipeline is growing, but the data in this model of LPG exports do suggest strong returns for existing LPG exporters, and those with near-term expansions.
Download the Model?
The costs of supercapacitors are tabulated in this data-file, with a typical system storing 15-seconds of electricity, for a capex cost around $10,000/kWh of energy but just $40/kW of power. Hence for short-duration, but very frequent and fast-acting voltage regulation, supercapacitors may be highly competitive with lithium ion batteries and flywheels. Numbers can be stress-tested in this model.
Download the Model?
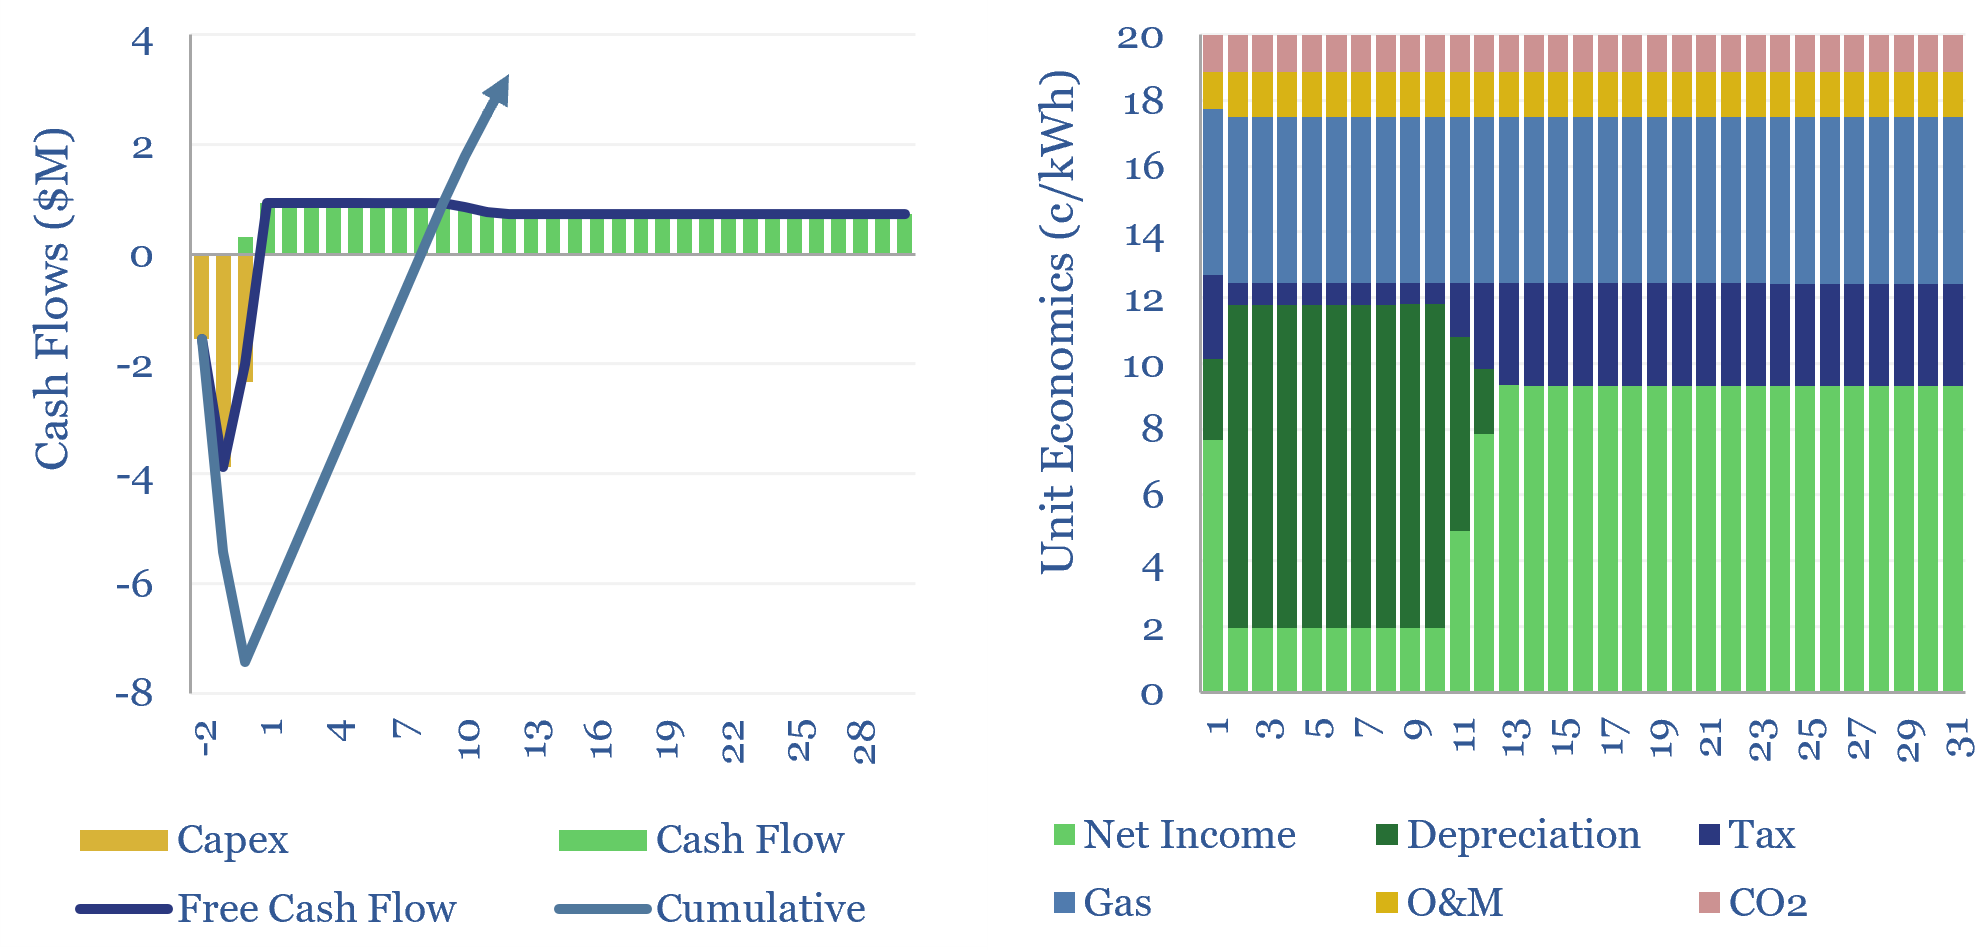
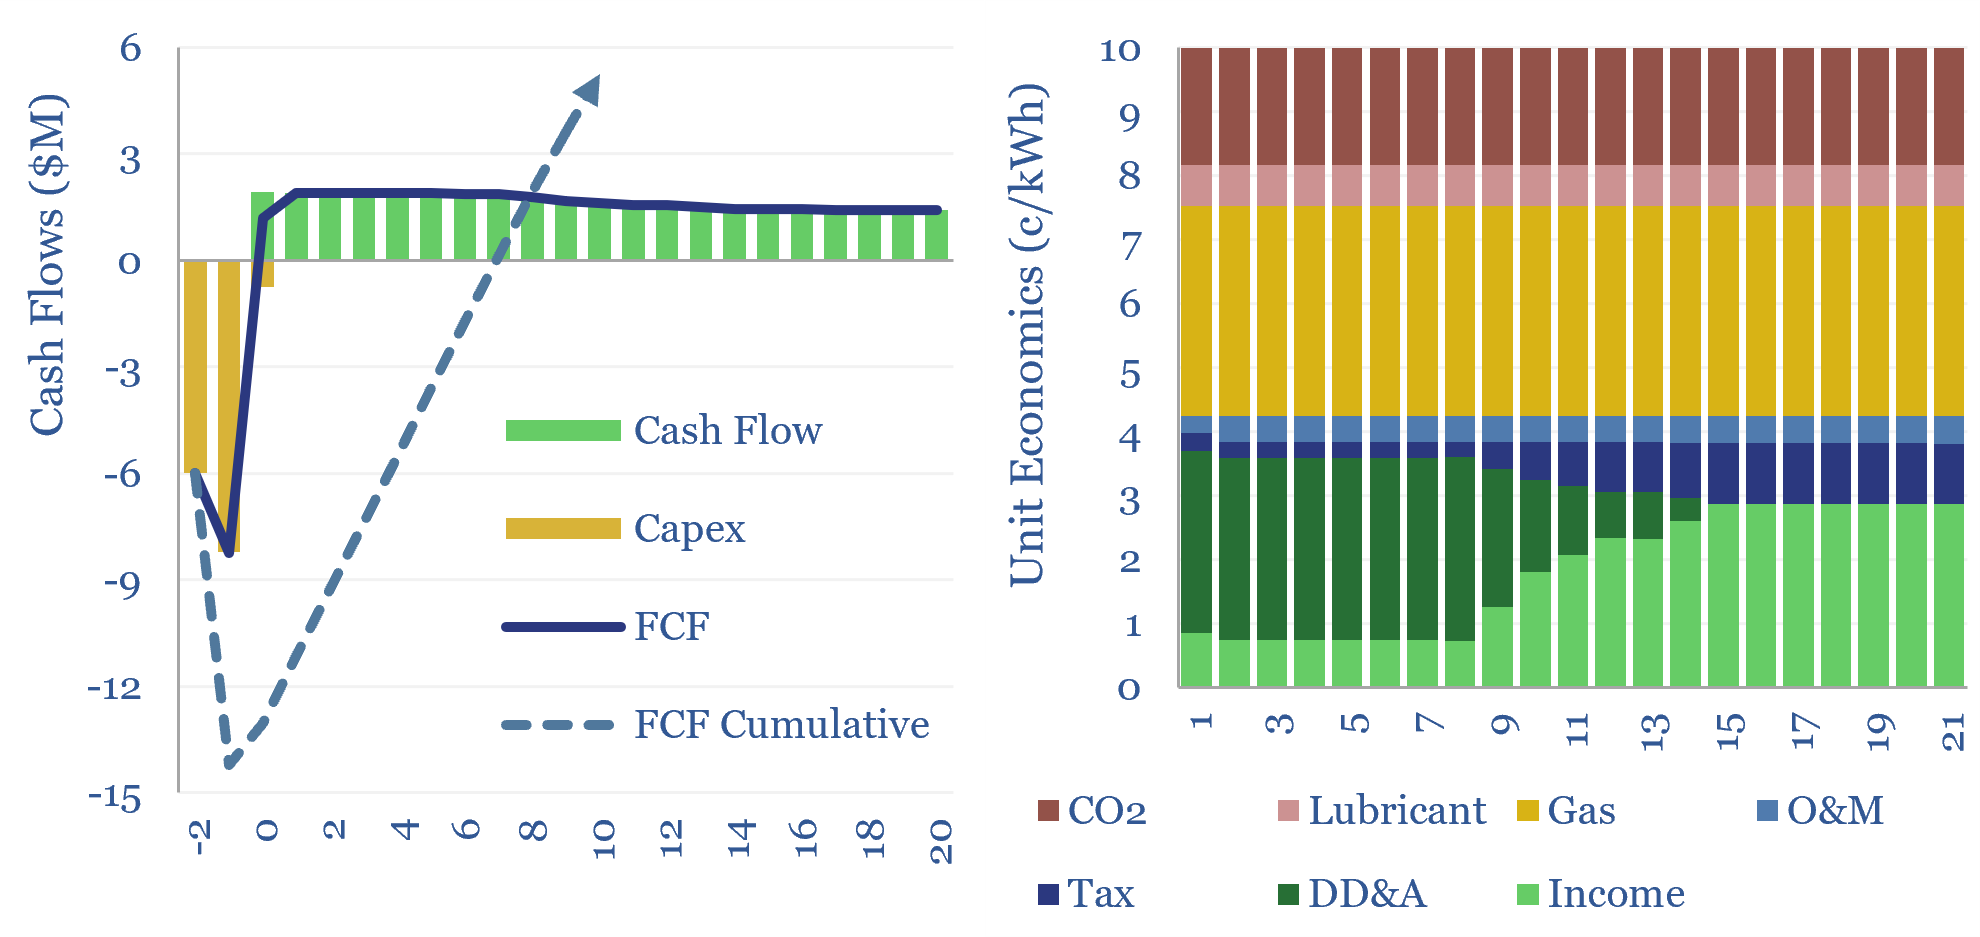
The economics costs of reciprocating gas engines are captured in this data-file. As a rule of thumb, a 5MW recip that costs $1,500/kW, runs with 60% utilization, and 40% efficiency, requires a 8-10c/kWh power price (or levelized cost) to generate a 10% IRR, depending on the CO2 price. Capex costs are derived from prior case studies in a backup tab.
Download the Model?
The levelized cost of onshore wind is estimated in this economic model, at 5-7c/kWh to generate 5-10% levered IRRs on new wind projects costing $1,000-3,000/kW. The model also contains a granular breakdown of wind capex costs, operating costs, and other economic assumptions for wind projects.
Download the Model?
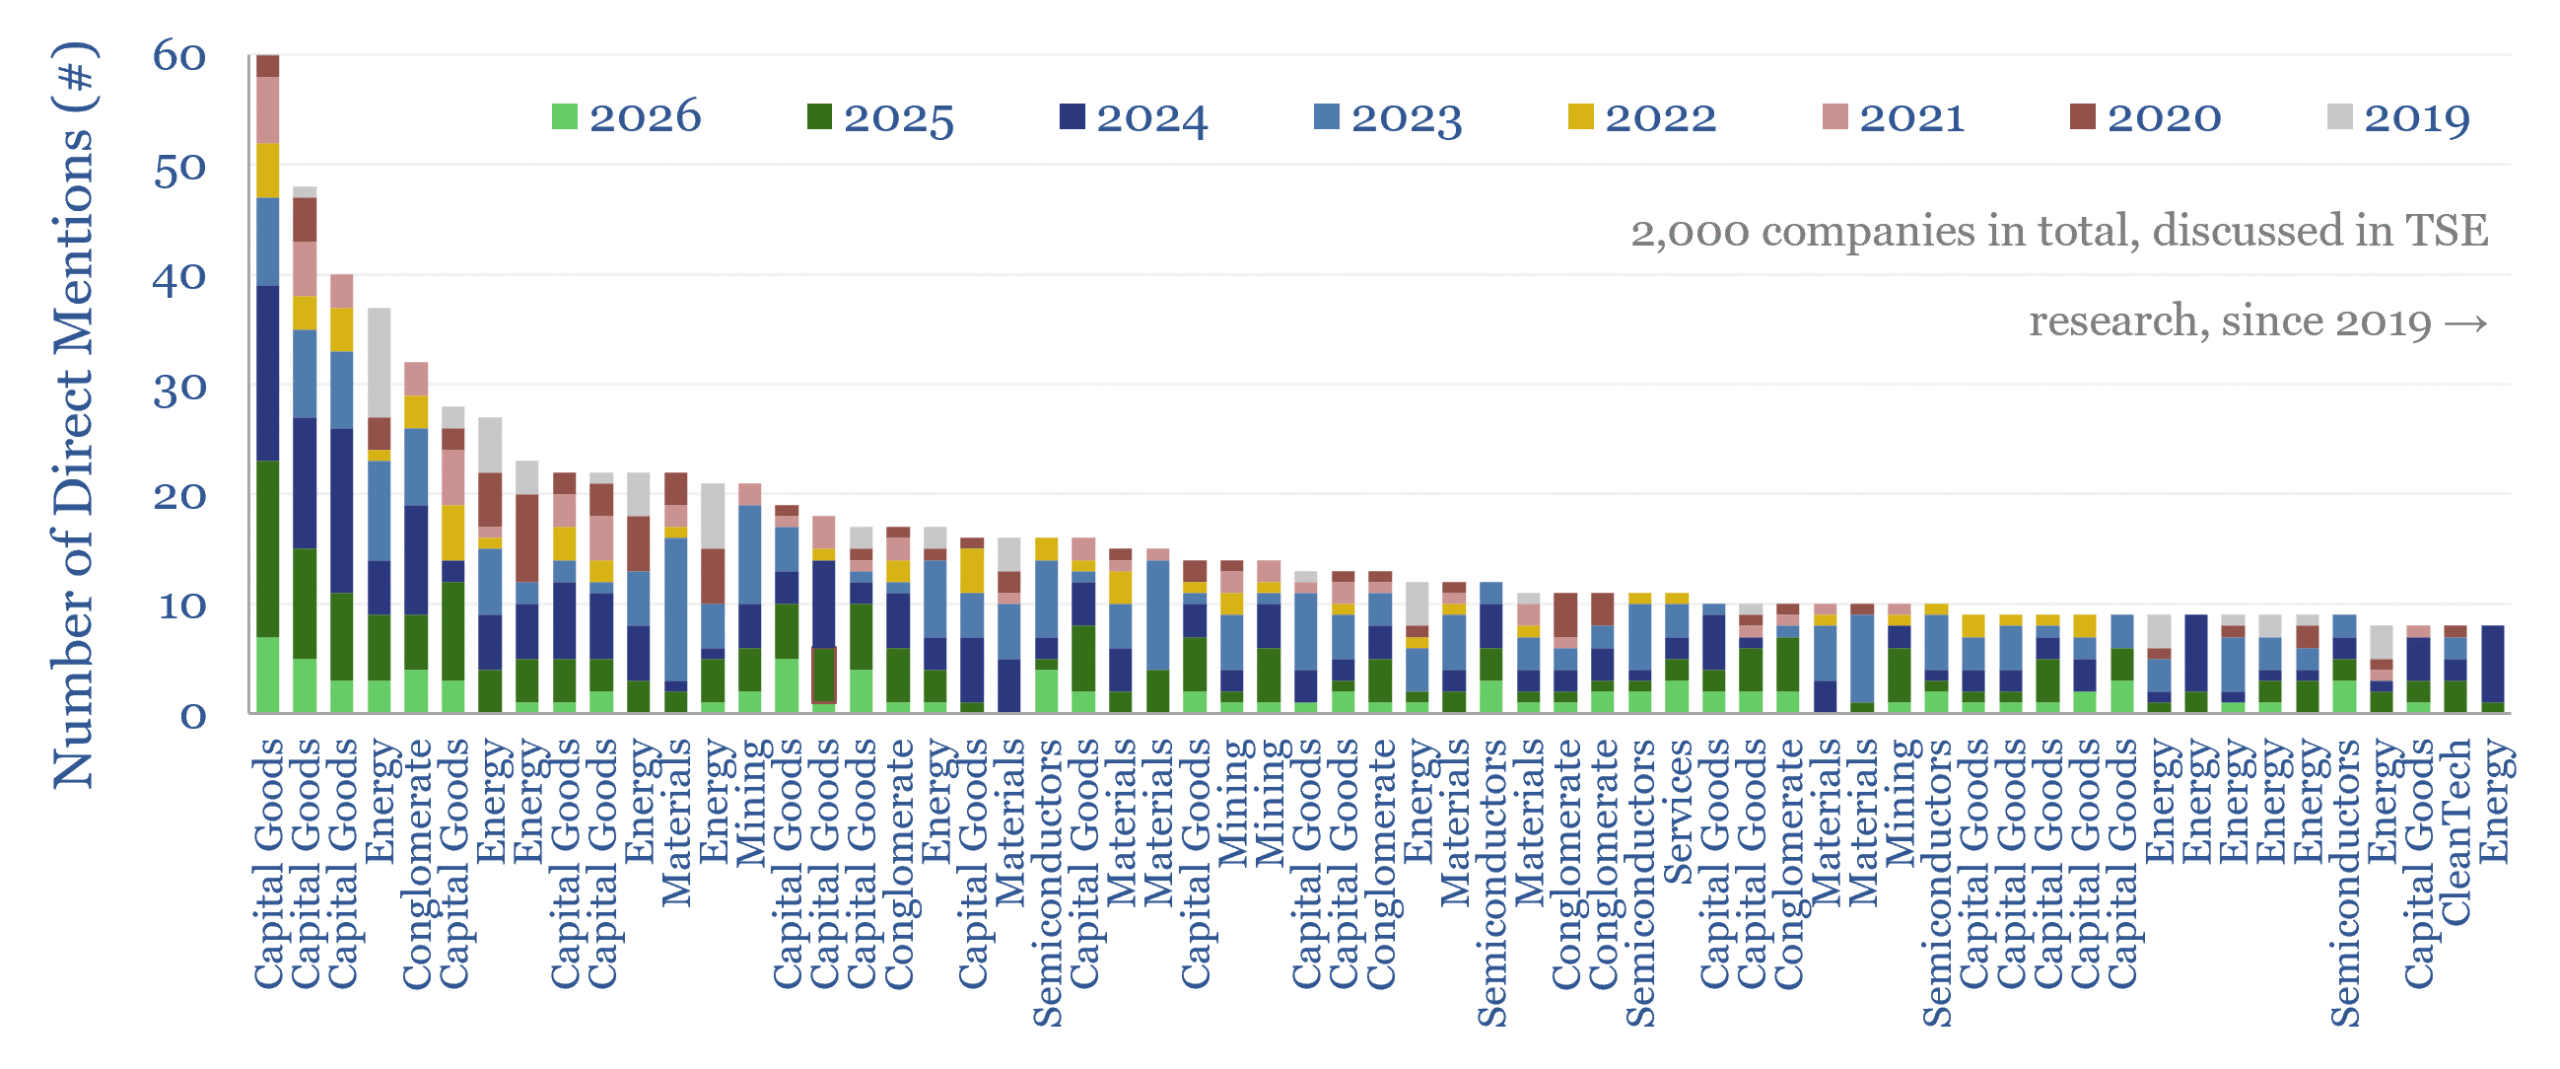
This database contains a record of every company that has ever been mentioned across Thunder Said Energy’s energy technology research, as a useful reference for TSE’s clients. As of July-2026, the database summarizes 4,000 mentions of 2,000 energy transition companies, broader energy producing and consuming companies; their size, focus and a summary of our key conclusions, plus links to further research.
Download the Screen?
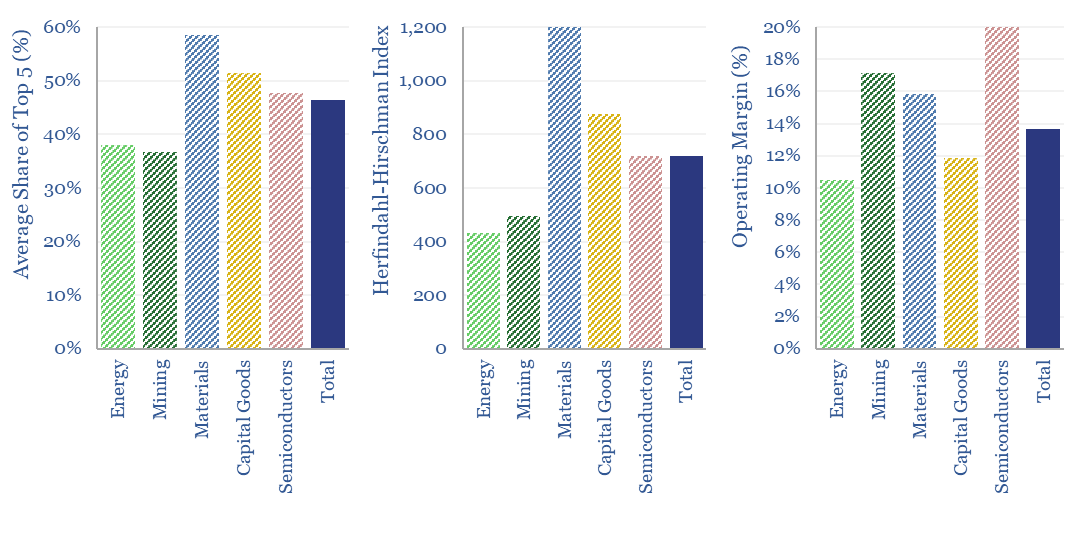
What is the market concentration by industry in energy, mining, materials, semiconductors, capital goods and other sectors that matter in the energy transition? The top five firms tend to control 45% of their respective markets, yielding a ‘Herfindahl Hirschman Index’ (HHI) of 700.
Download the Screen?
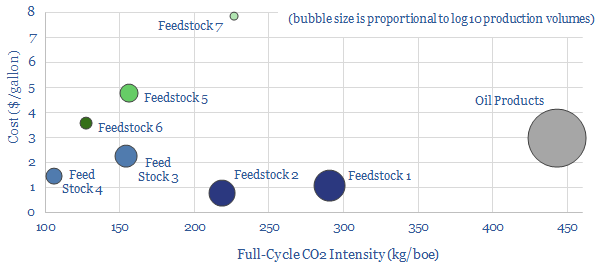
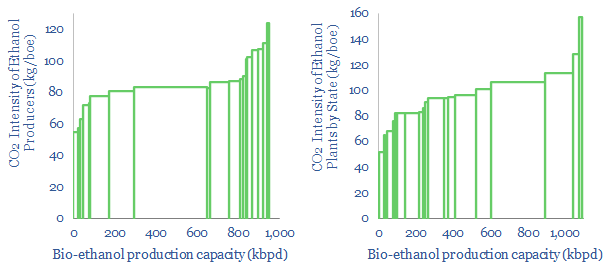
Biofuels are currently displacing 3.5Mboed of oil and gas. But they are not carbon-free, and their weighted average CO2 emissions are only c50% lower. This data-file breaks down the biofuels market across seven key feedstocks, to help identify which opportunities can scale for the lowest costs and CO2, versus others that require further technical progress.
Download the Screen?
Vehicles transport people and freight around the world, explaining 70% of global oil demand, 30% of global energy use, 20% of global CO2e emissions. This overview summarizes all of our research into vehicles, and key conclusions for the energy transition.
Download the Screen?
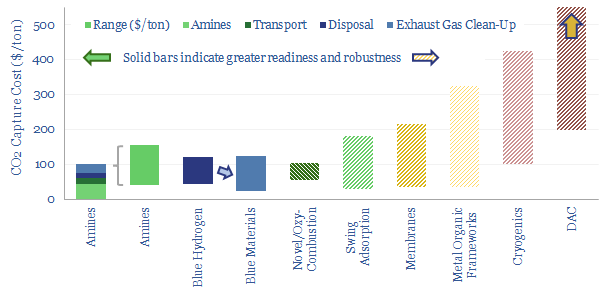
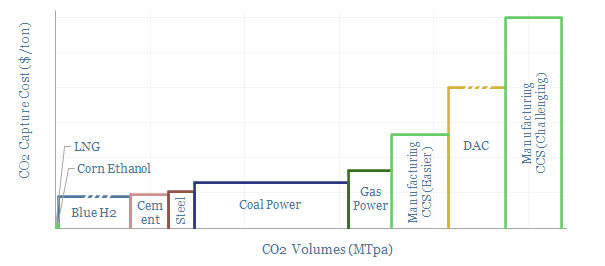
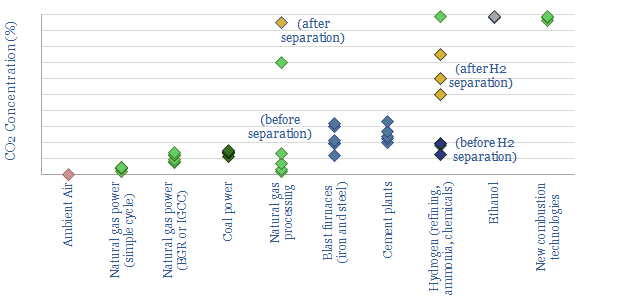
Carbon capture and storage (CCS) prevents CO2 from entering the atmosphere. Options include the amine process, blue hydrogen, novel combustion technologies and cutting edge sorbents and membranes. Total CCS costs range from $80-130/ton. This article summarizes conclusions from our carbon capture and storage research.
Download the Screen?
How long will boom times last in capital goods categories, including for AI data center construction? To answer this question, we have started tracking book-to-bill ratios, across 40 capital goods categories, from companies quarterly results. Booms occur when book-to-bill exceeds 1.5x, and typically last 2-years.
Download the Screen?
We have reviewed 20 humanoid robot concepts and robotics companies. The average example costs $80k, weighs 60kg, carries 17kg, with 40 degrees of freedom, moves at 6kmph, uses 500W of power, of which 10% is for 640 TOPs of onboard compute, while a 1.3kWh battery gives 3+ hours of endurance. Details for each humanoid robot concept and robotics company are in the data-file.
Download the Screen?
Iron ore is the sixth most produced commodity in the world, at 2.7GTpa. This data file breaks down global iron ore production by company over time. Since 2019, average realizations for the largest producers have risen at 1.6% pa, while costs have risen at 5% pa. What outlook from here?
Download the Screen?
This data-file is a screen of Canadian upstream companies and Canadian shale producers, especially focused on the fast-growing Montney-Duvernay shale plays. Key themes are rising shale oil and gas production, low-capex wells, high well-level IRRs, performance improvements and consolidation via M&A.
Download the Screen?
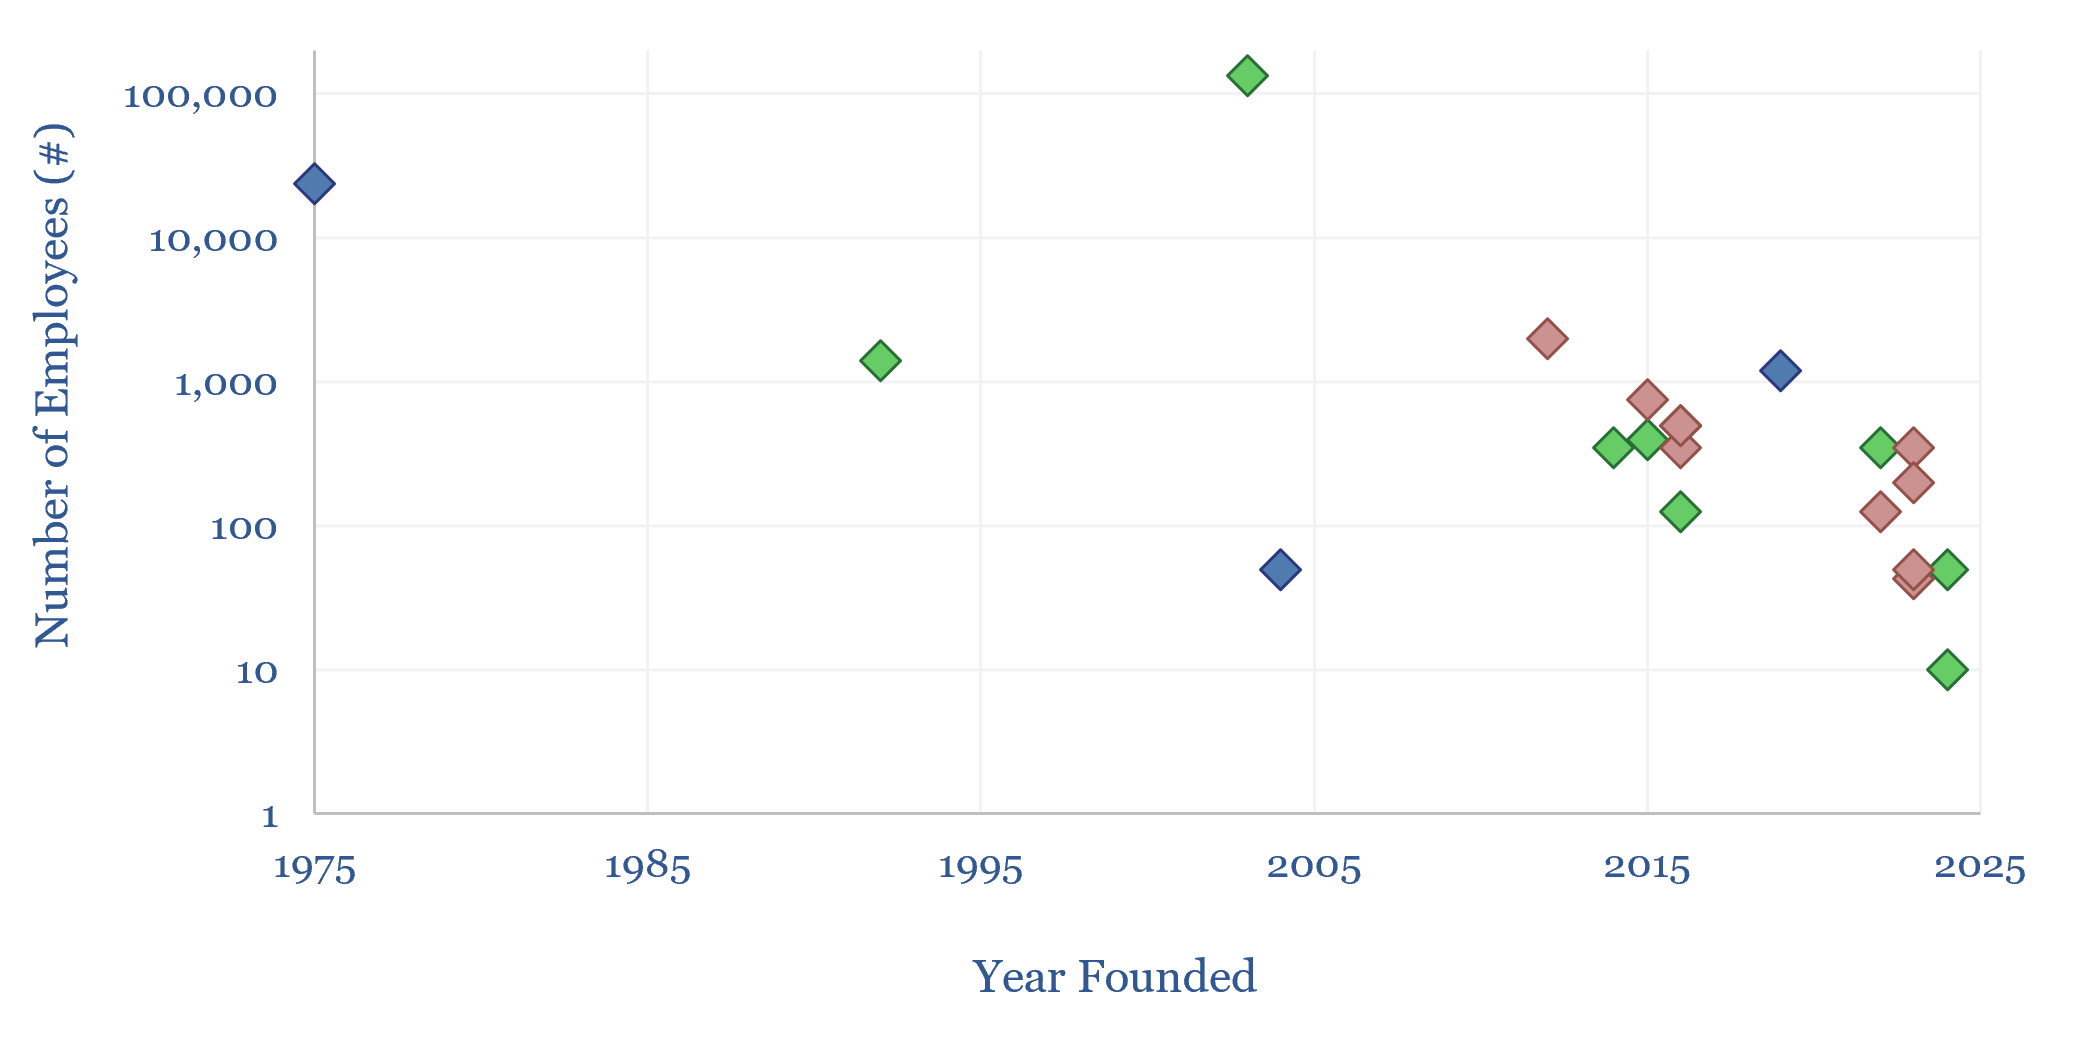
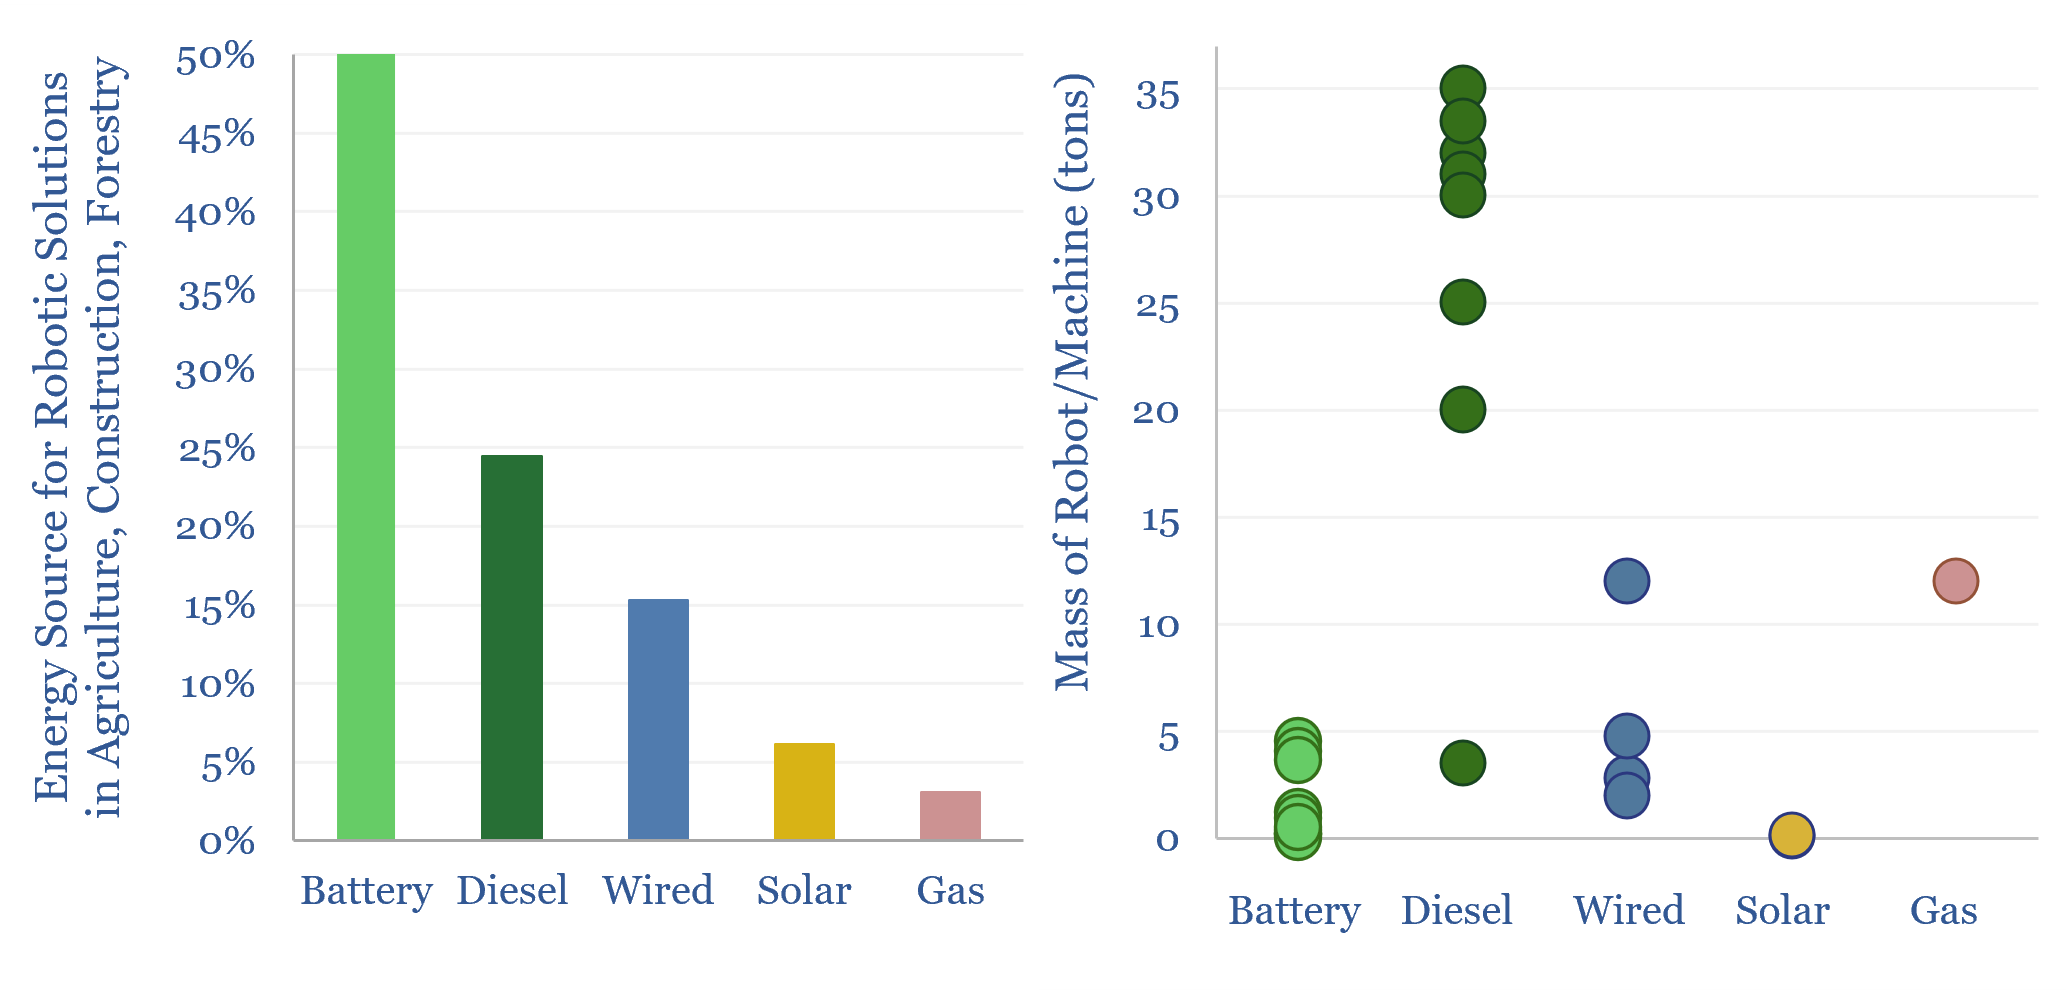
Mobile robotics companies are screened in this data-file, finding transformational impacts in construction, agriculture, forestry, and solar installation. The average robot operates 50% faster and at 50% lower cost than manual methods. 50% of the robots are battery powered, 25% are diesel and 15% are wired. Interesting companies are in the data-file.
Download the Screen?
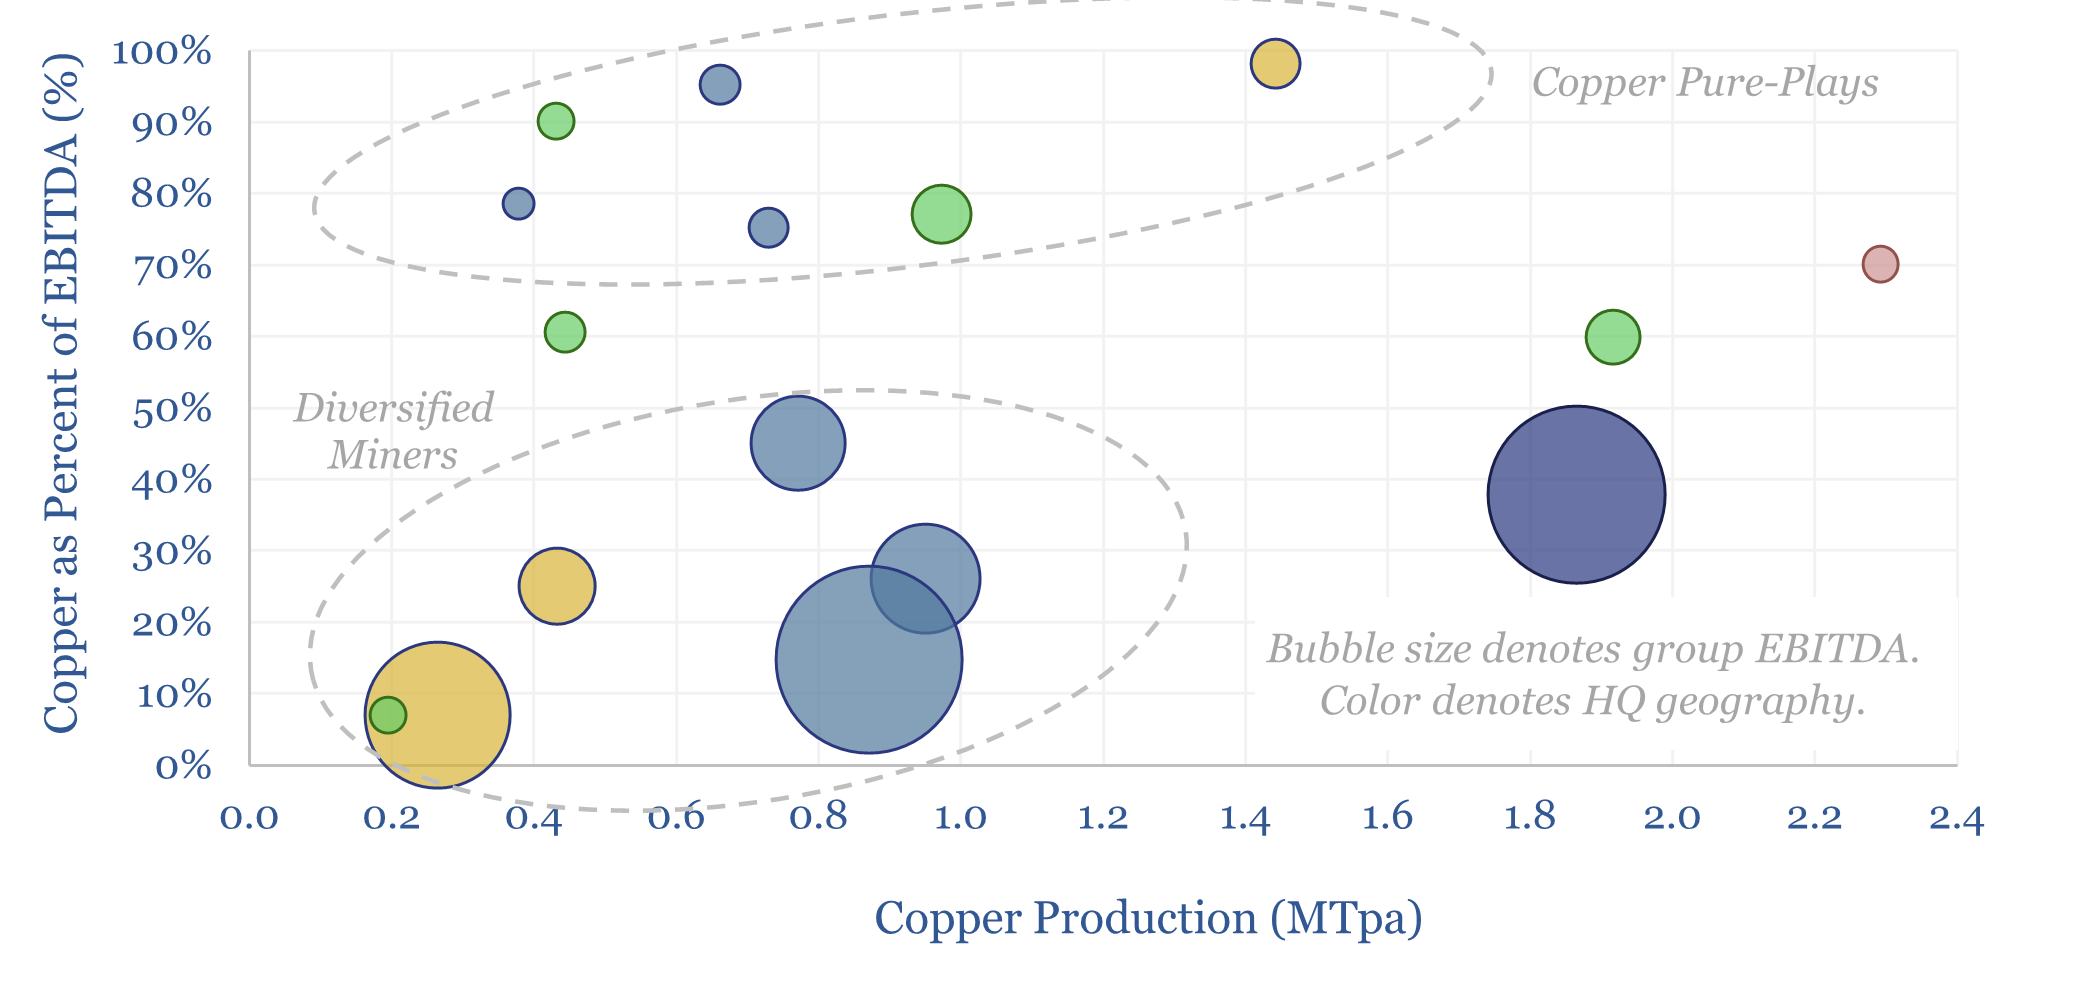
This data-file is a screen of the world’s largest copper companies, across c15 miners and producers that produce half of the global market, averaging 0.9MTpa each, deriving 35% of their EBITDA from copper, at 35% EBITDA margins, with a reserve life of 29-years. Summary details are given for each copper company, and their recent AI initiatives, in the data-file.
Download the Screen?
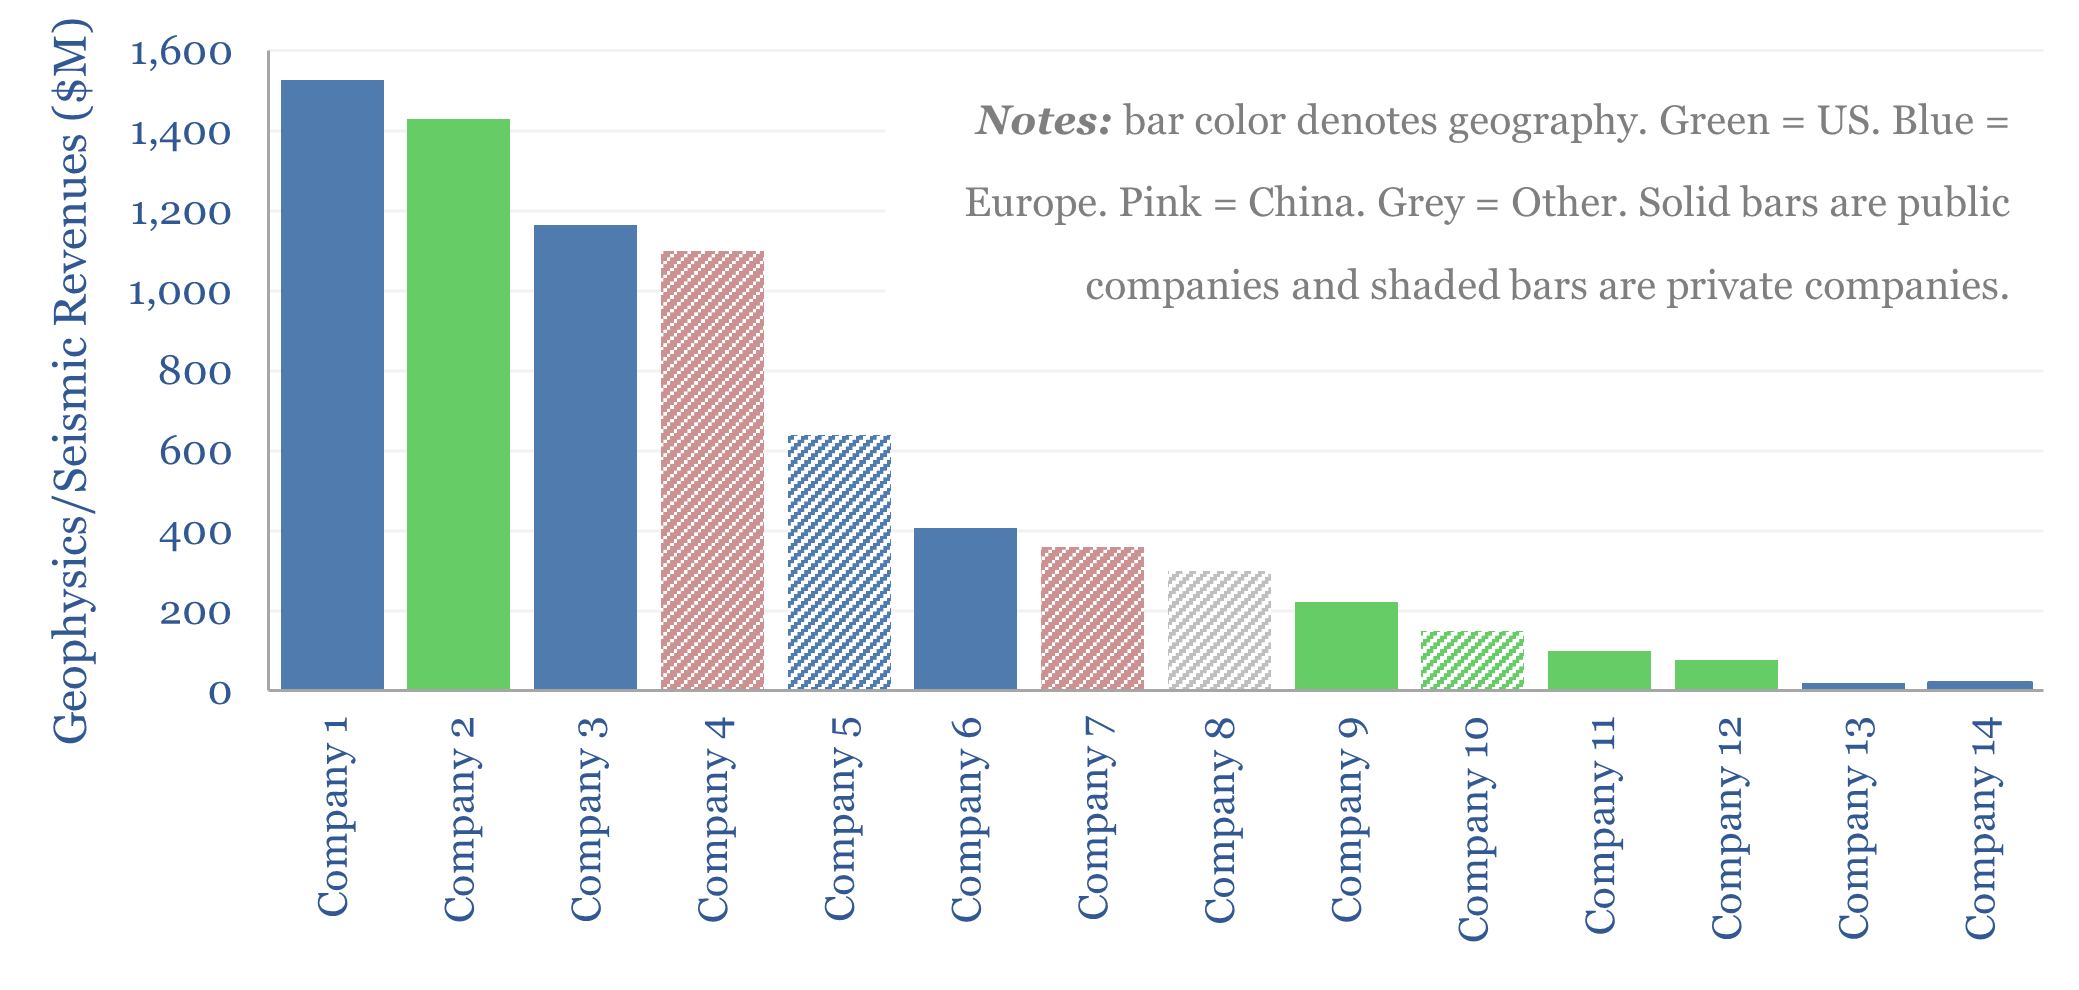
This data-file screens 14 leading seismic and geophysics companies, based on company disclosures and reviewing c500 patents over the past 20-years. This restructured and increasingly consolidated industry is now worth $10bn pa. Companies have recently generated c10% EBIT margins. But capabilities are growing and costs are deflating through deploying AI?
Download the Screen?
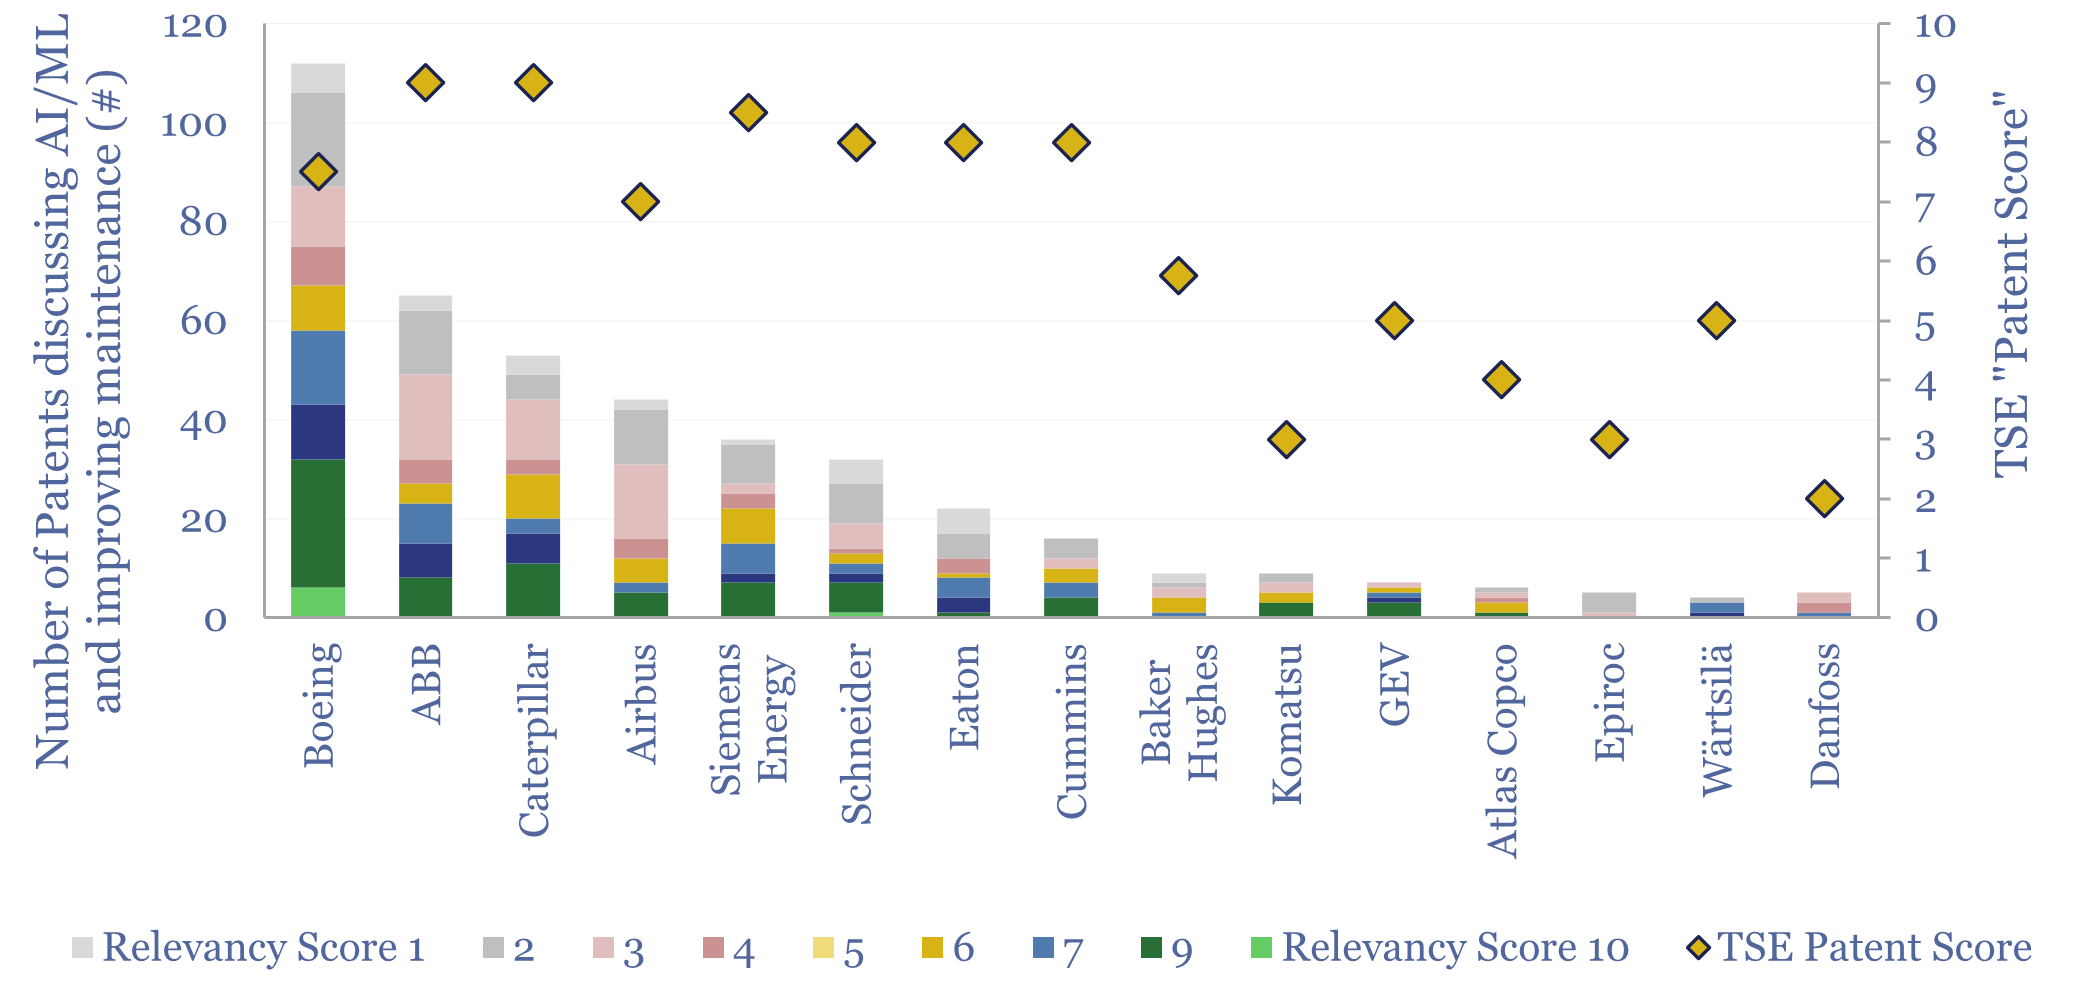
Leading capital goods companies using AI and machine learning to predict outages and optimize maintenance schedules across their product portfolios are summarized in this data-file. Using AI for predictive maintenance is an improvement on inexact prior schedules. AI also helps to improve energy efficiency during operation and the maintenance process itself.
Download the Screen?
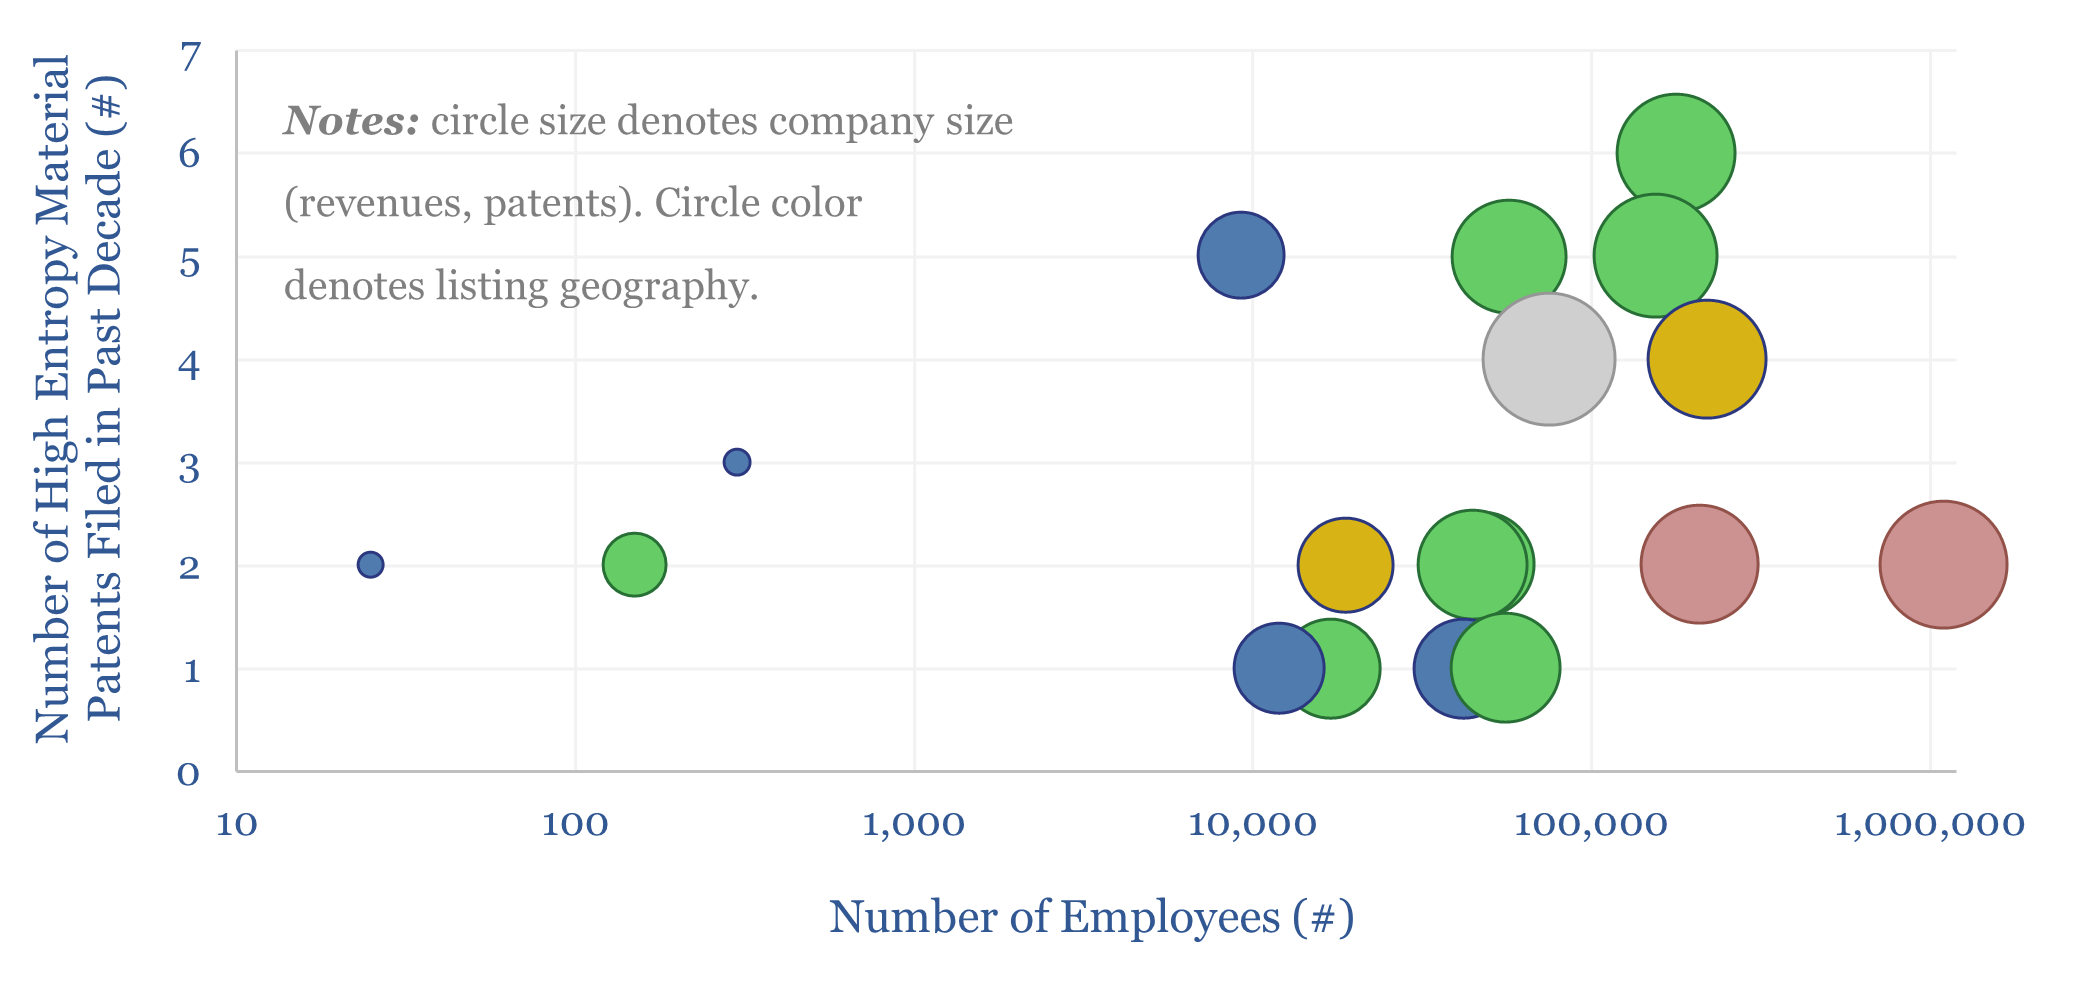
This data-file evaluates 100 patents, filed over the past decade, by leading companies in high entropy alloys, and by academic institutions. 20 companies stood out, developing harder and more resistant tools for machining/drilling, alloys that can withstand extreme temperatures, and novel surface coatings.
Download the Screen?
This data-file summarizes the leading companies in solar trackers, their market share, pricing (in $/kW), operating margins (in %), company sizes, sales mixes and recent news flow. Five companies supply 70% of the market, which is worth $10bn pa. But competition is intensifying from East-West dual-tile arrays and within the tracker industry.
Download the Screen?
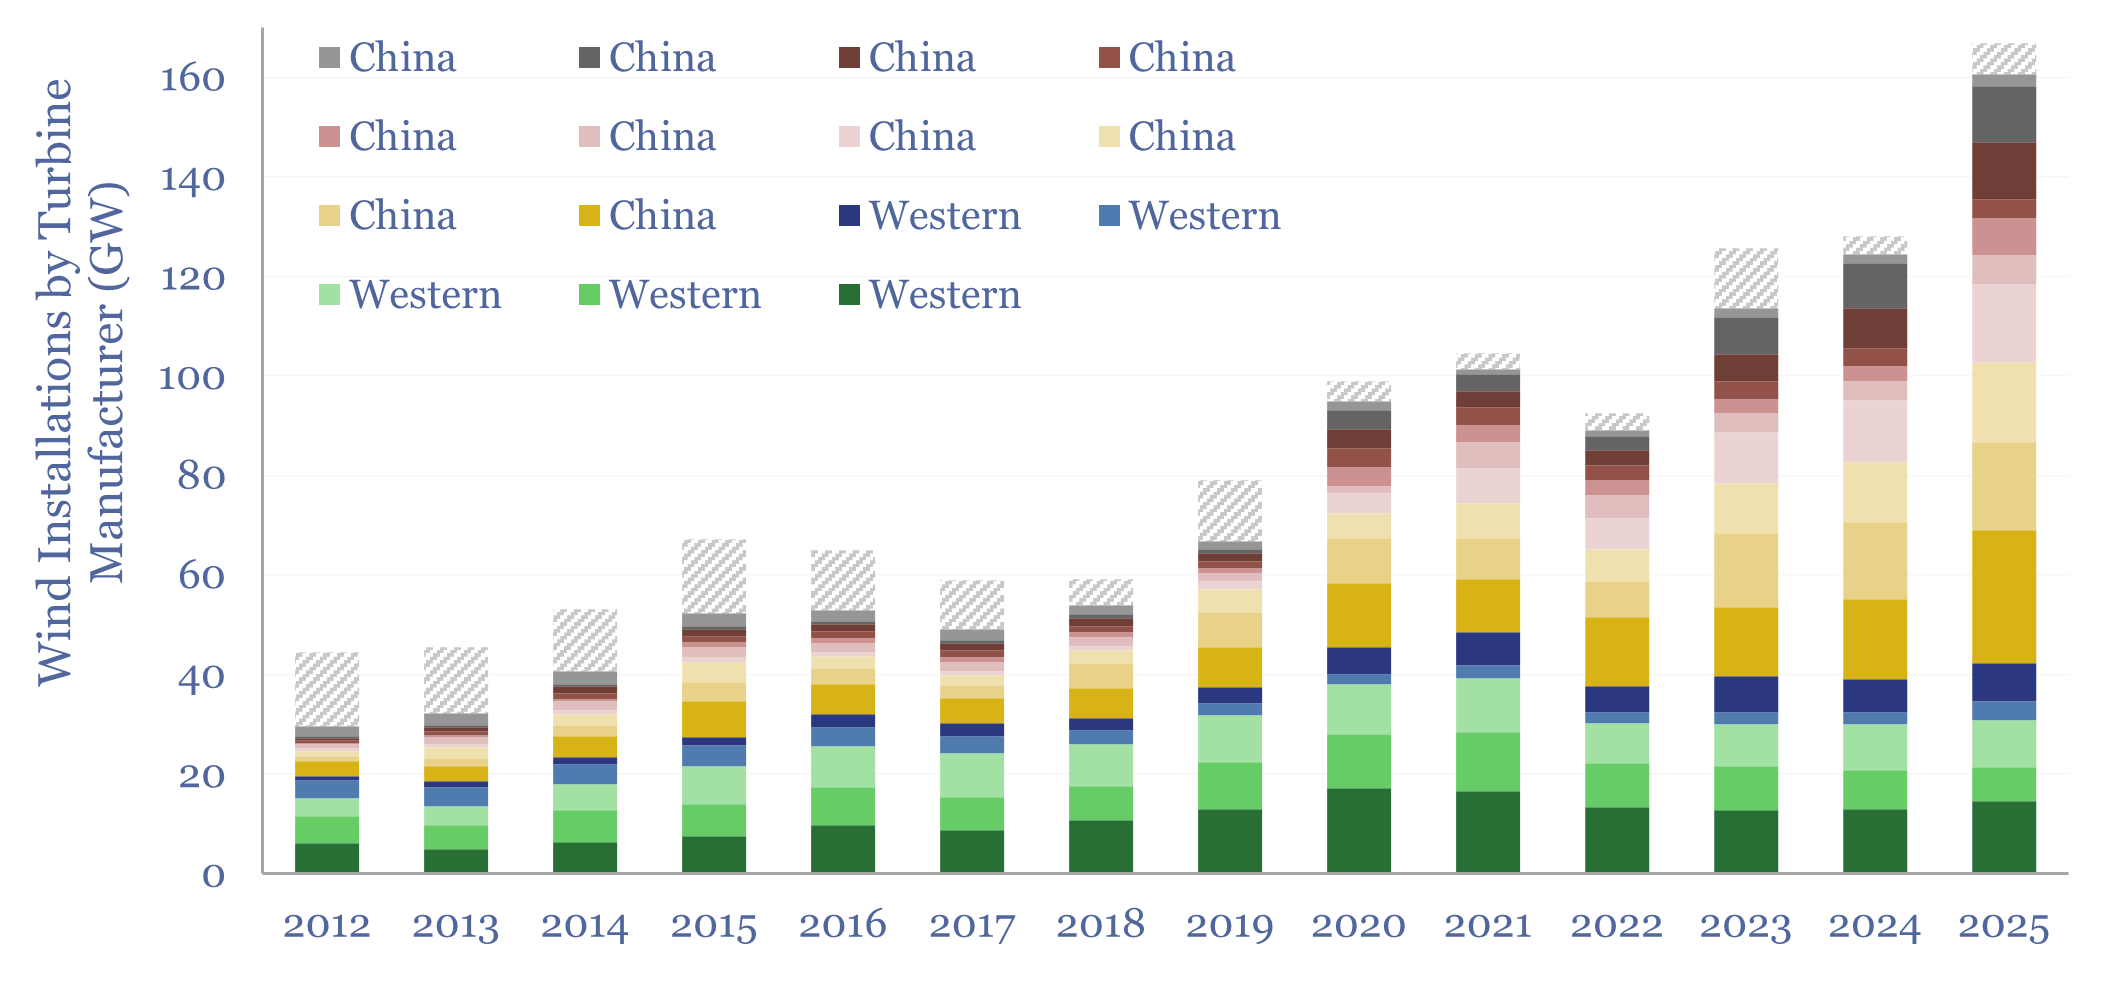
This data-file tracks wind turbine manufacturers, their market shares and their margins over time. By 2025, fifteen companies account for 95% of global wind turbine installations. This includes large Western incumbents, and a growing share for Chinese entrants, which now comprise 70% of the total market, with phenomenal growth in 2025 and continued low selling prices.
Download the Screen?
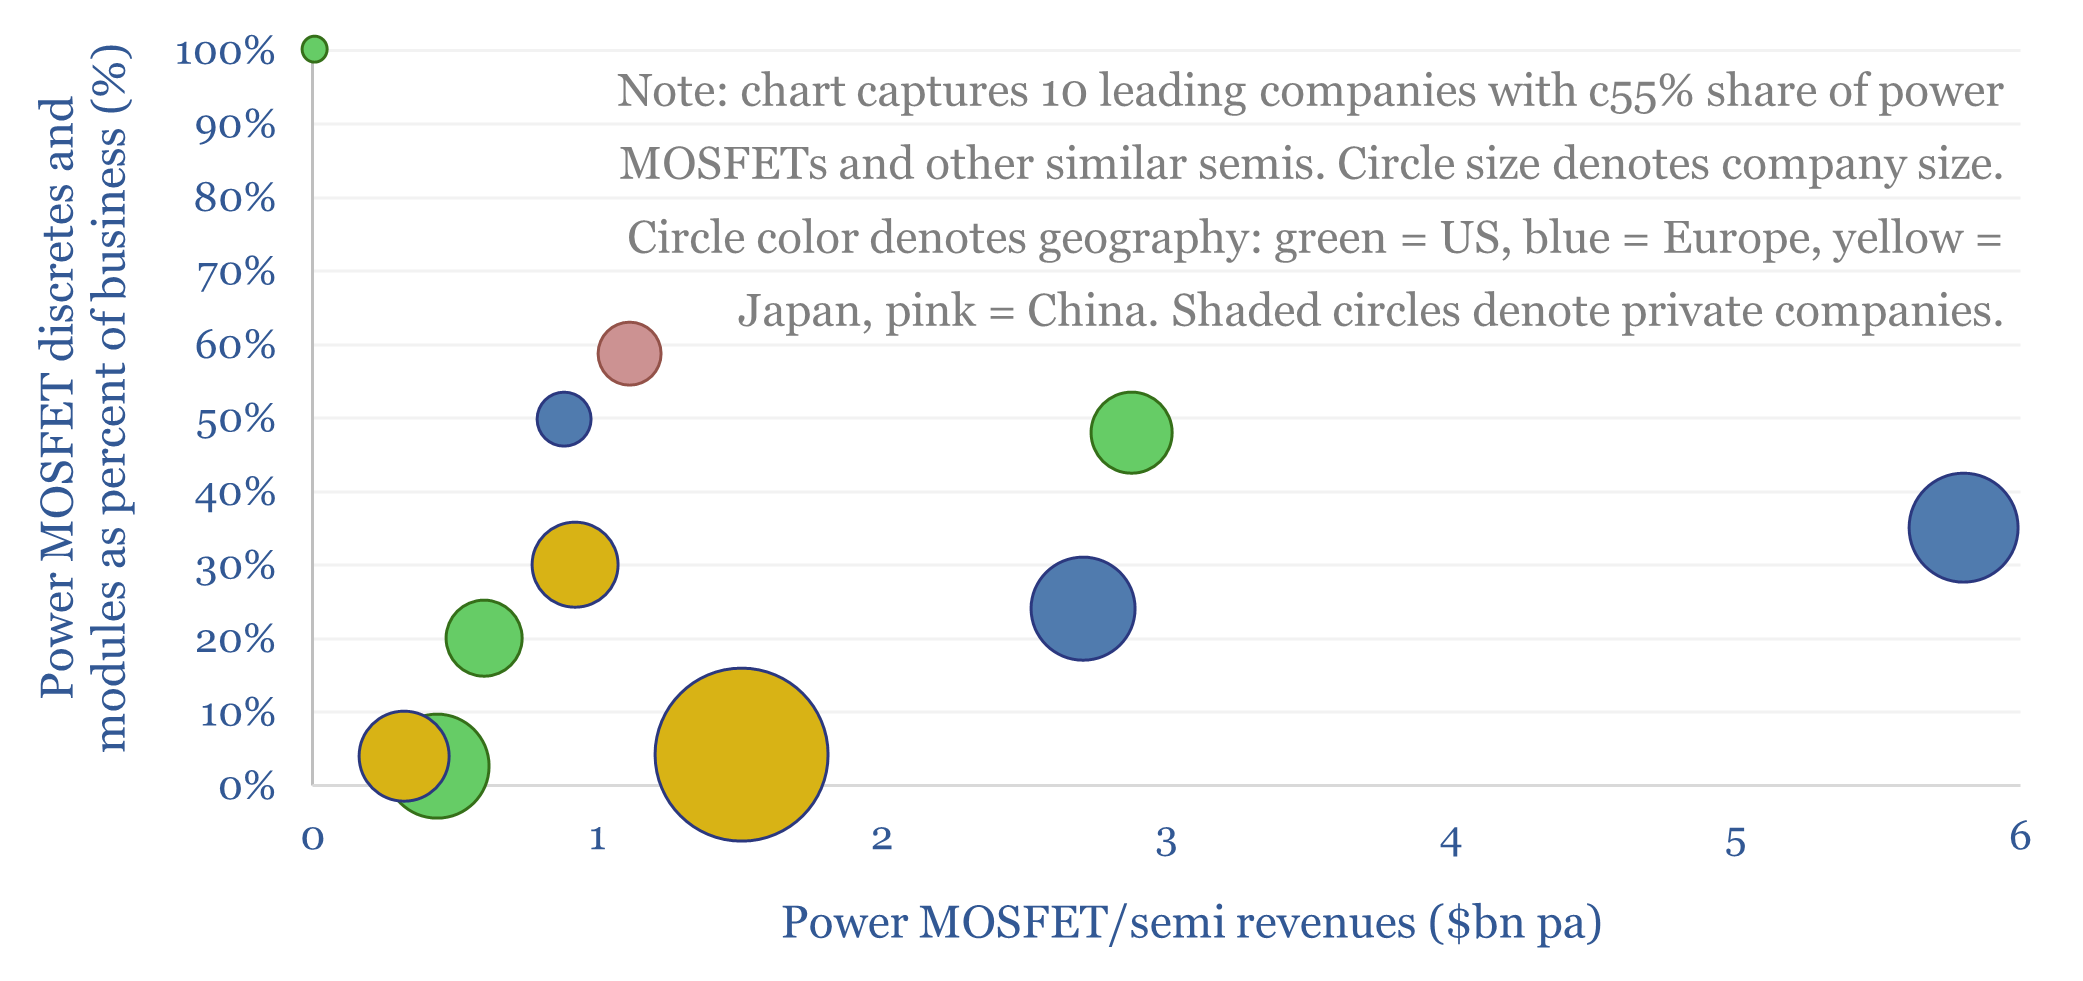
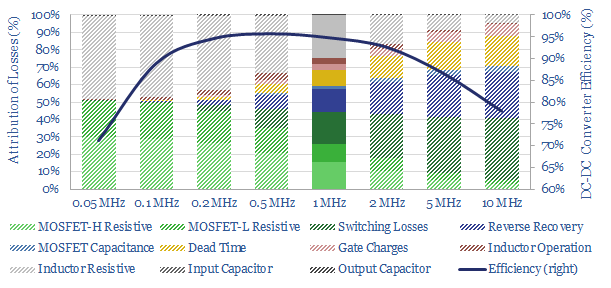
Power MOSFETs are an energy transition technology, the building block behind inverters, DC-DC converters, EV drive trains, EV chargers, renewables-battery interfaces and increasingly, the power conversion architectures for upscaling rack density at AI data-centers. Hence this data-file is a screen of power MOSFET and active semiconductor companies.
Download the Screen?
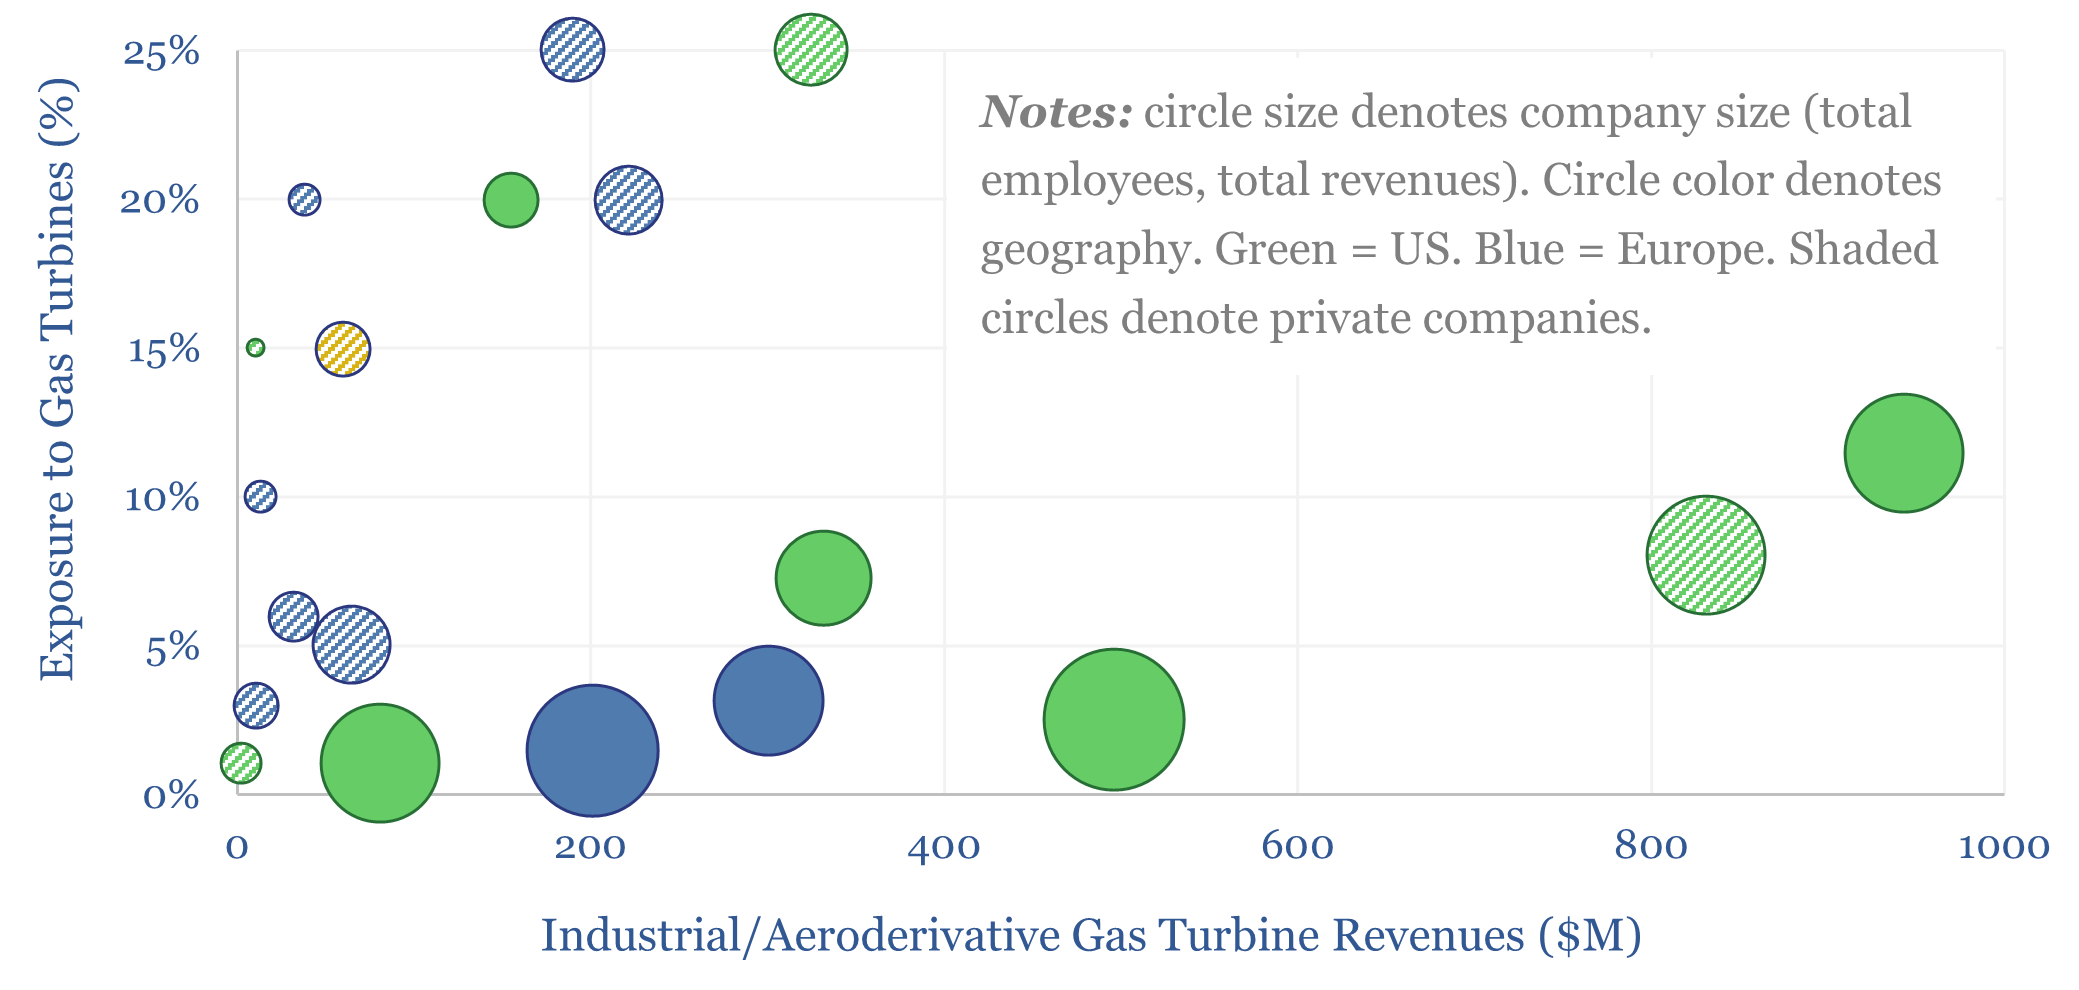
Leading gas turbine component manufacturers are tabulated in this company screen. 20 companies produce almost $5bn pa of precision-made vanes, blades, rings and ancillaries for gas turbines, at 17% EBIT margins, but a diversified manufacturing footprint that often overlaps with other aerospace applications. What implications?
Download the Screen?
Leading companies in transformer monitoring, and broader substation monitoring around the T&D network, are screened in this data-file. Real-time sensors and AI may reduce unplanned outages and repair costs by 30-60%, while most optimistically, high-quality monitoring can help flow 15% more power through existing infrastructure.
Download the Screen?
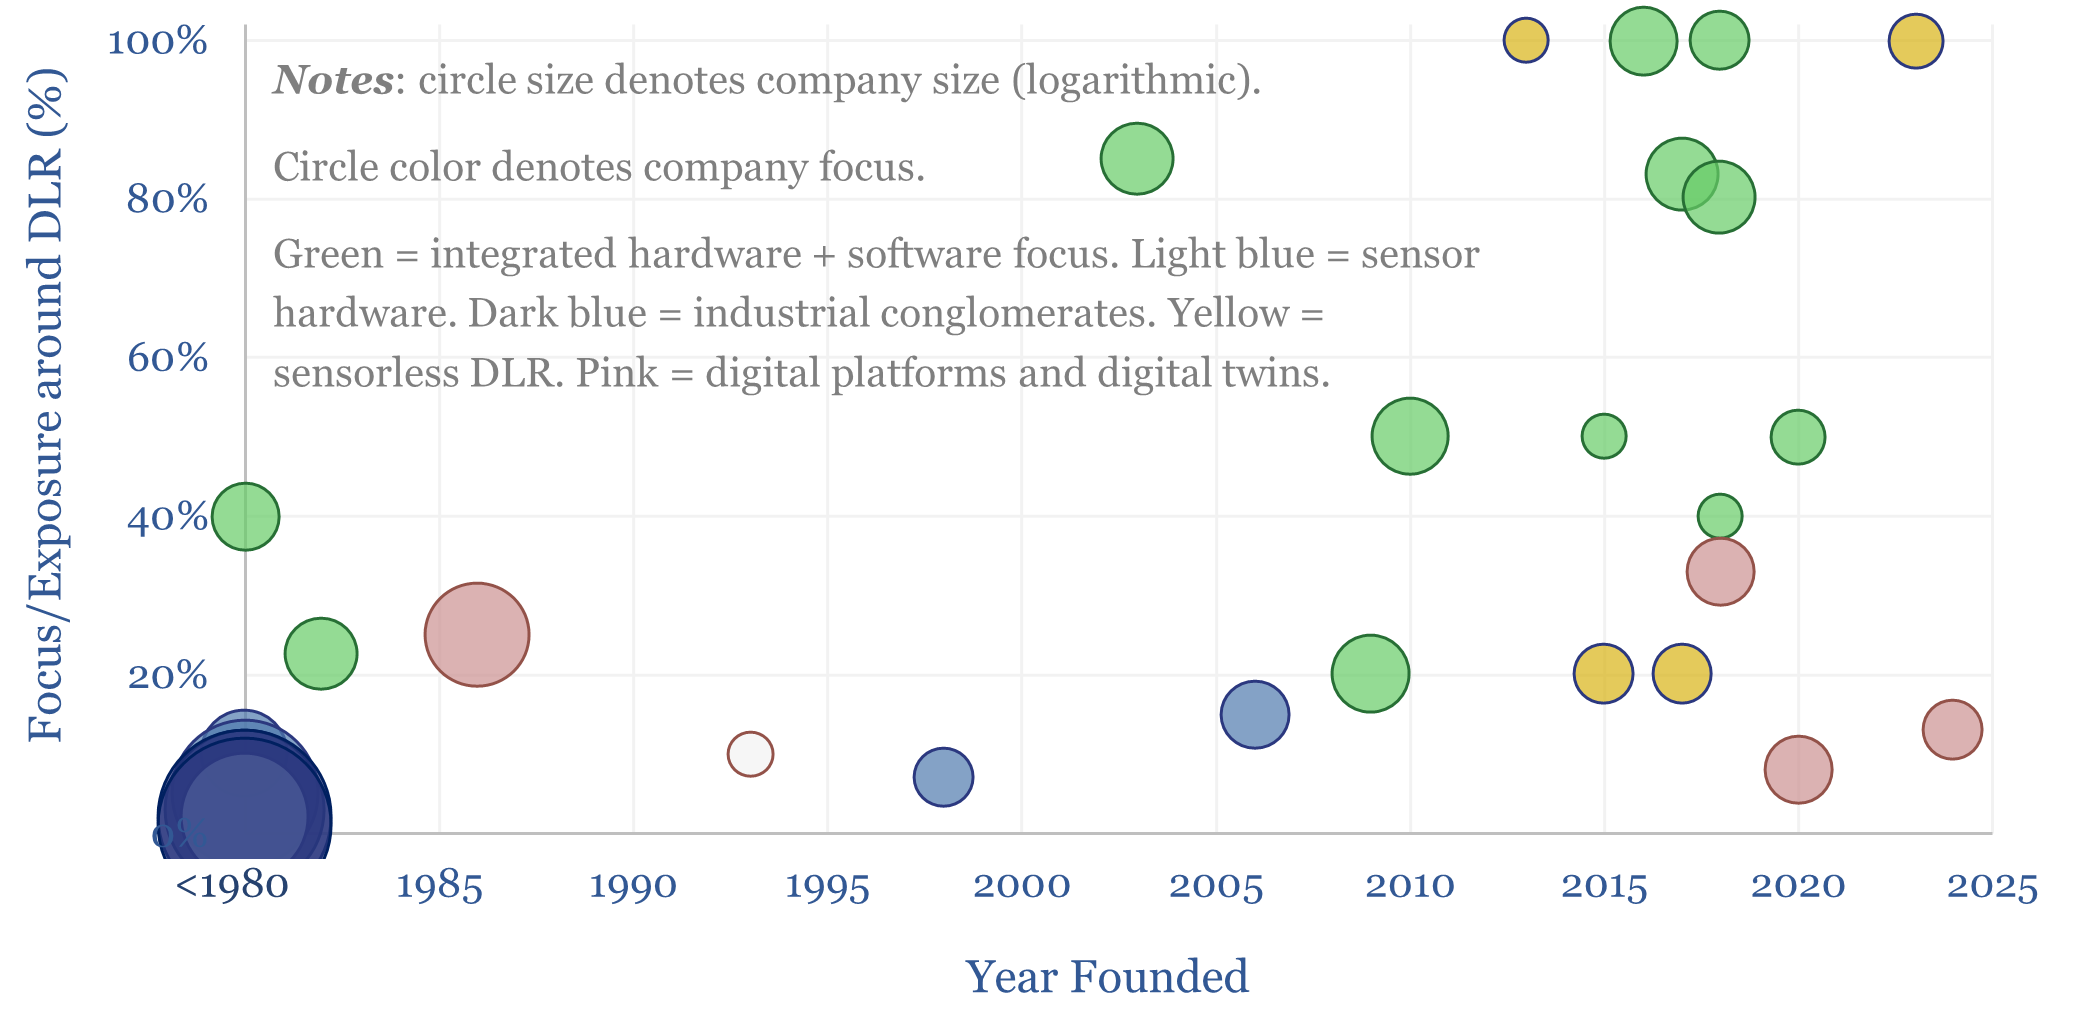
This data-file is a screen of 30 leading companies in dynamic line ratings (DLR), deploying sensors and/or software to optimize the carrying capacity of transmission and distribution lines in real time. The average case study spans 750km and uplifts T&D capacity by 34%. Deployment, is inflecting in the AI era.
Download the Screen?
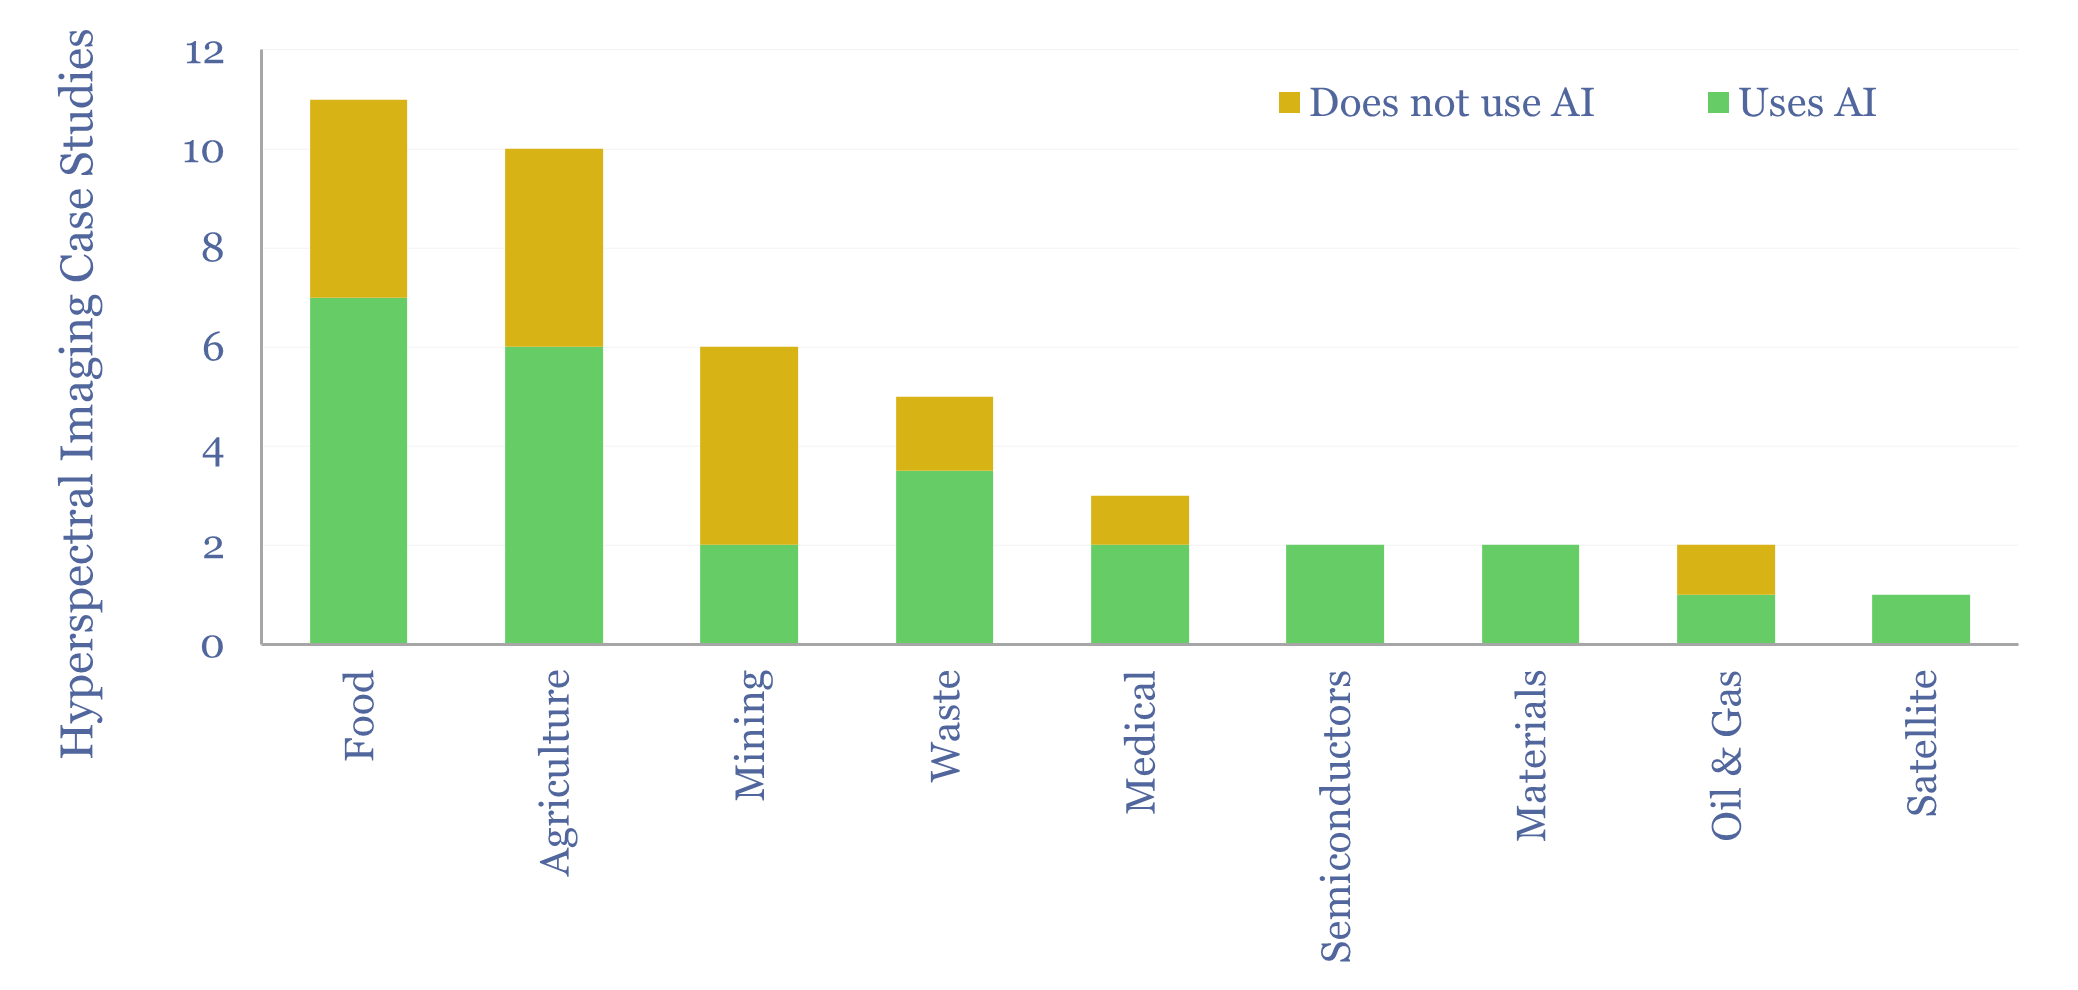
Hyperspectral imaging captures 30-100x more data from a visual scene than cameras or the human eye, binned into narrower bands, across a wider spectral range. These data, available in real-time, and inherently dovetailing with AI models, are increasingly valuable in food, agriculture, mining, waste-management, oil and gas and manufacturing. This data-file screens leading hyperspectral imaging companies and case studies.
Download the Screen?
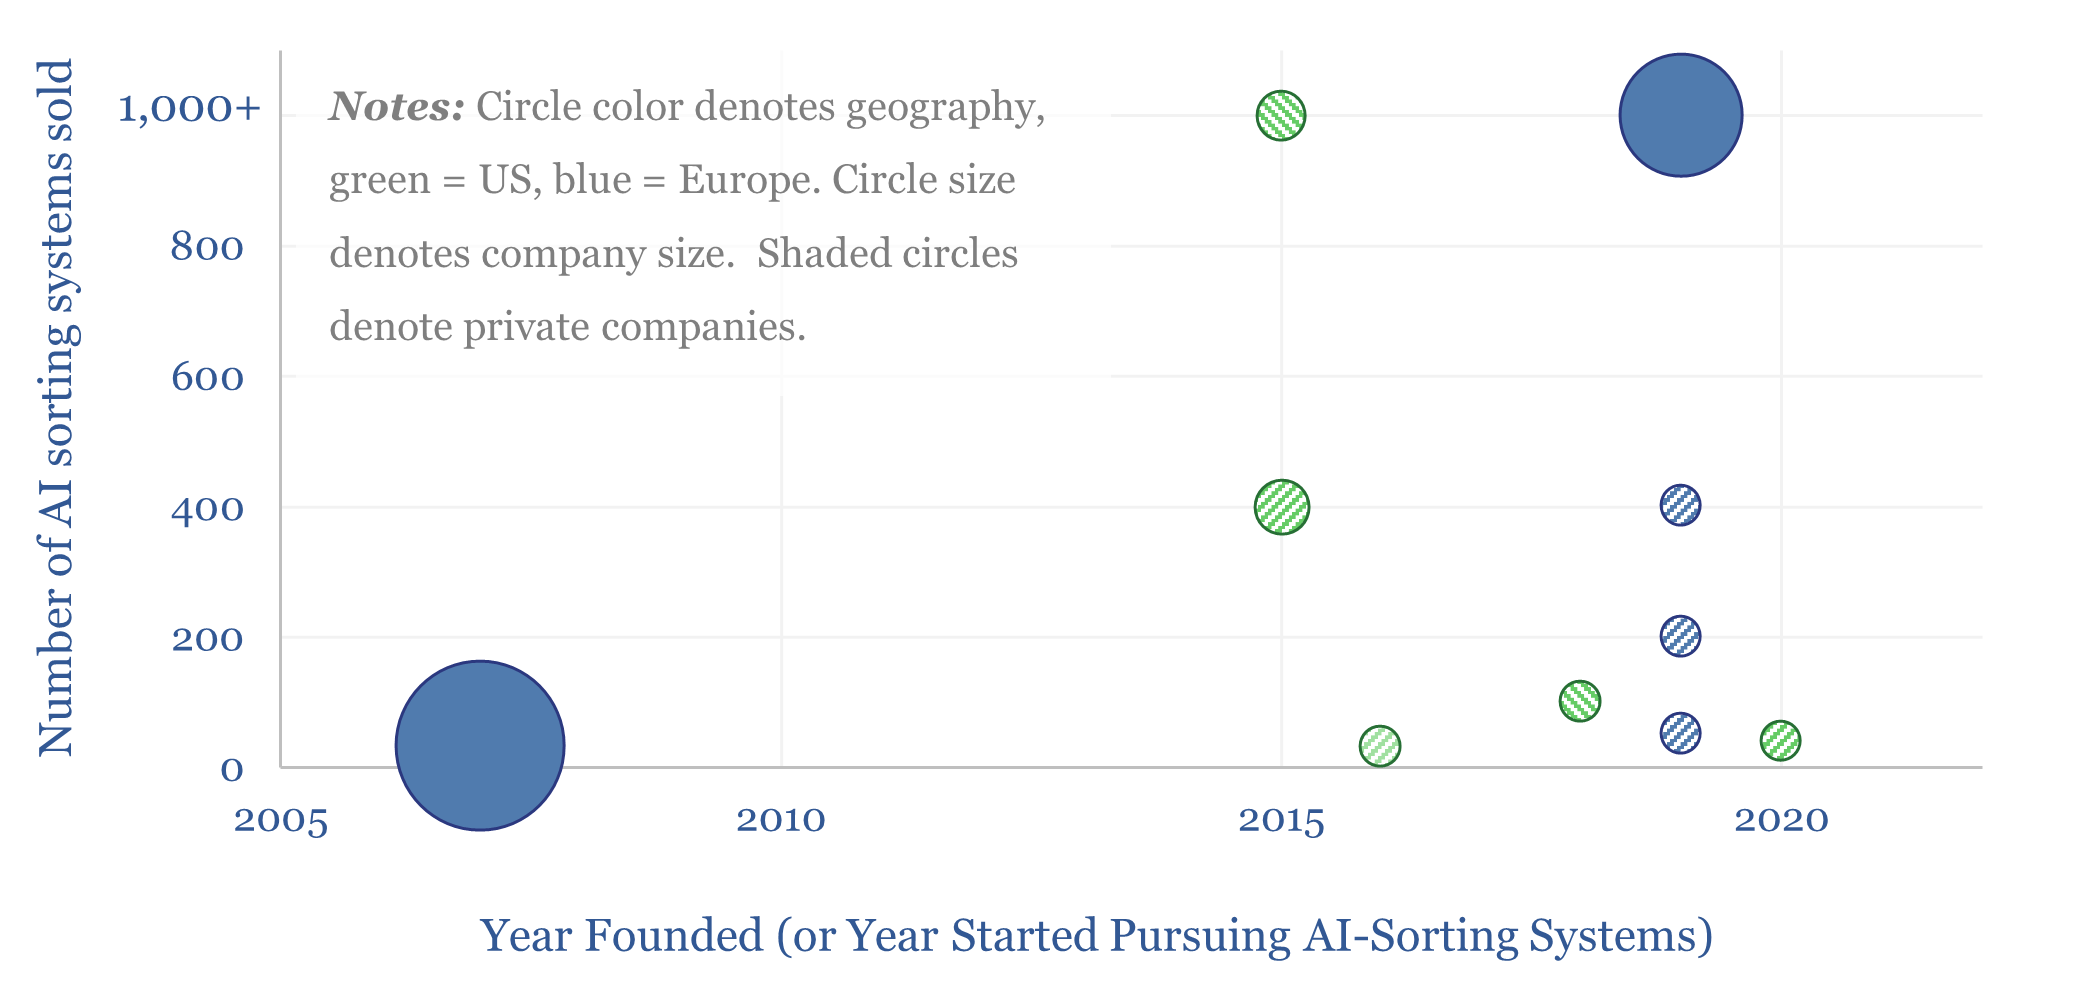
This data-file is a screen of companies using AI for waste-sorting, in order to separate out valuable recyclable materials, from the world’s 2.3 GTpa of solid municipal waste. Ten companies, mostly founded in the past decade, are now at an inflection point and seem to be scaling up rapidly.
Download the Screen?
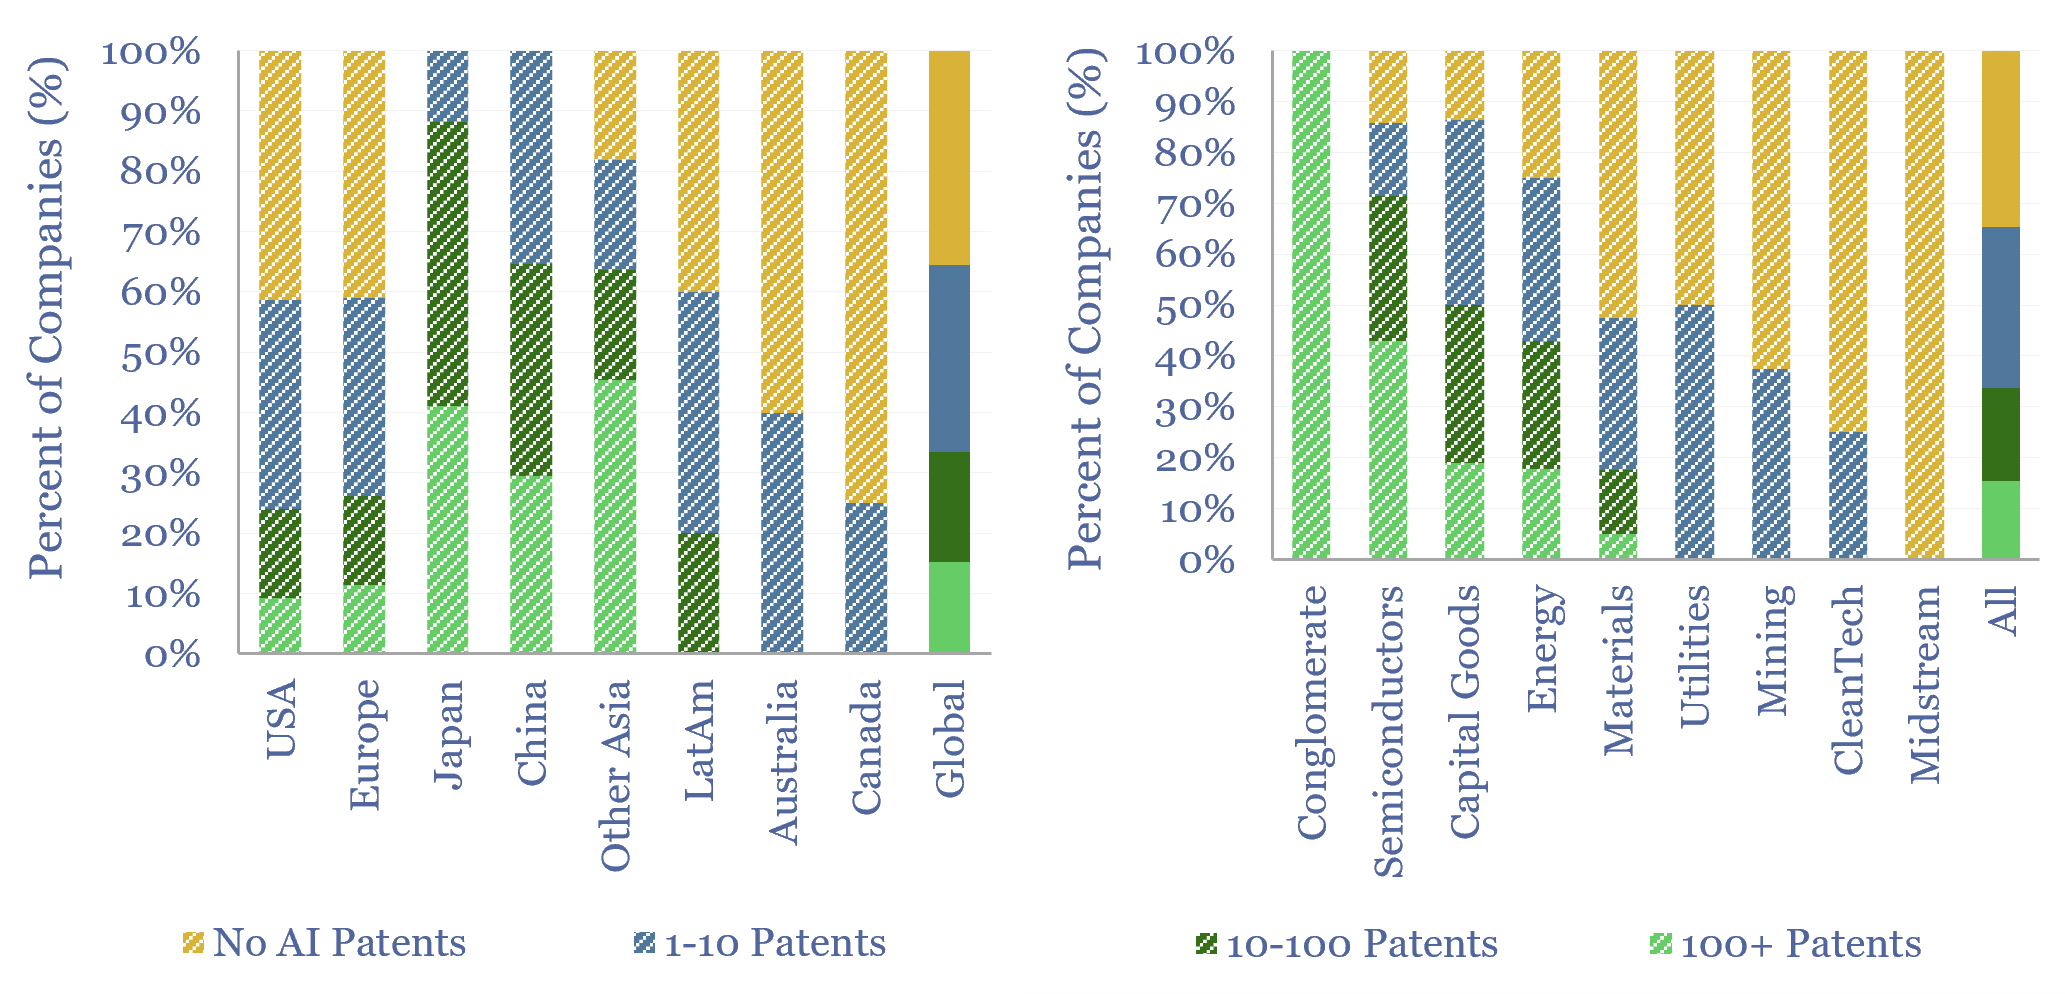
This data-file tabulates industrial companies deploying AI, based on their patent filings. 200 leading industrial companies have filed 40,000 AI/ML-related patents in 2022-25, with 65% now developing their own AIs in-house. Examples are summarized. We will continue adding to and expanding this data-file over time.
Download the Screen?
This data-file is a screen of leading reciprocating gas engine companies, covering an industry with 15GW pa of manufacturing capacity, EBIT margins averaging 10-20% (and rising), and an overlap with efficient engines used in diesel generators, marine, construction, mining and agricultural industries. Several companies stood out.
Download the Screen?
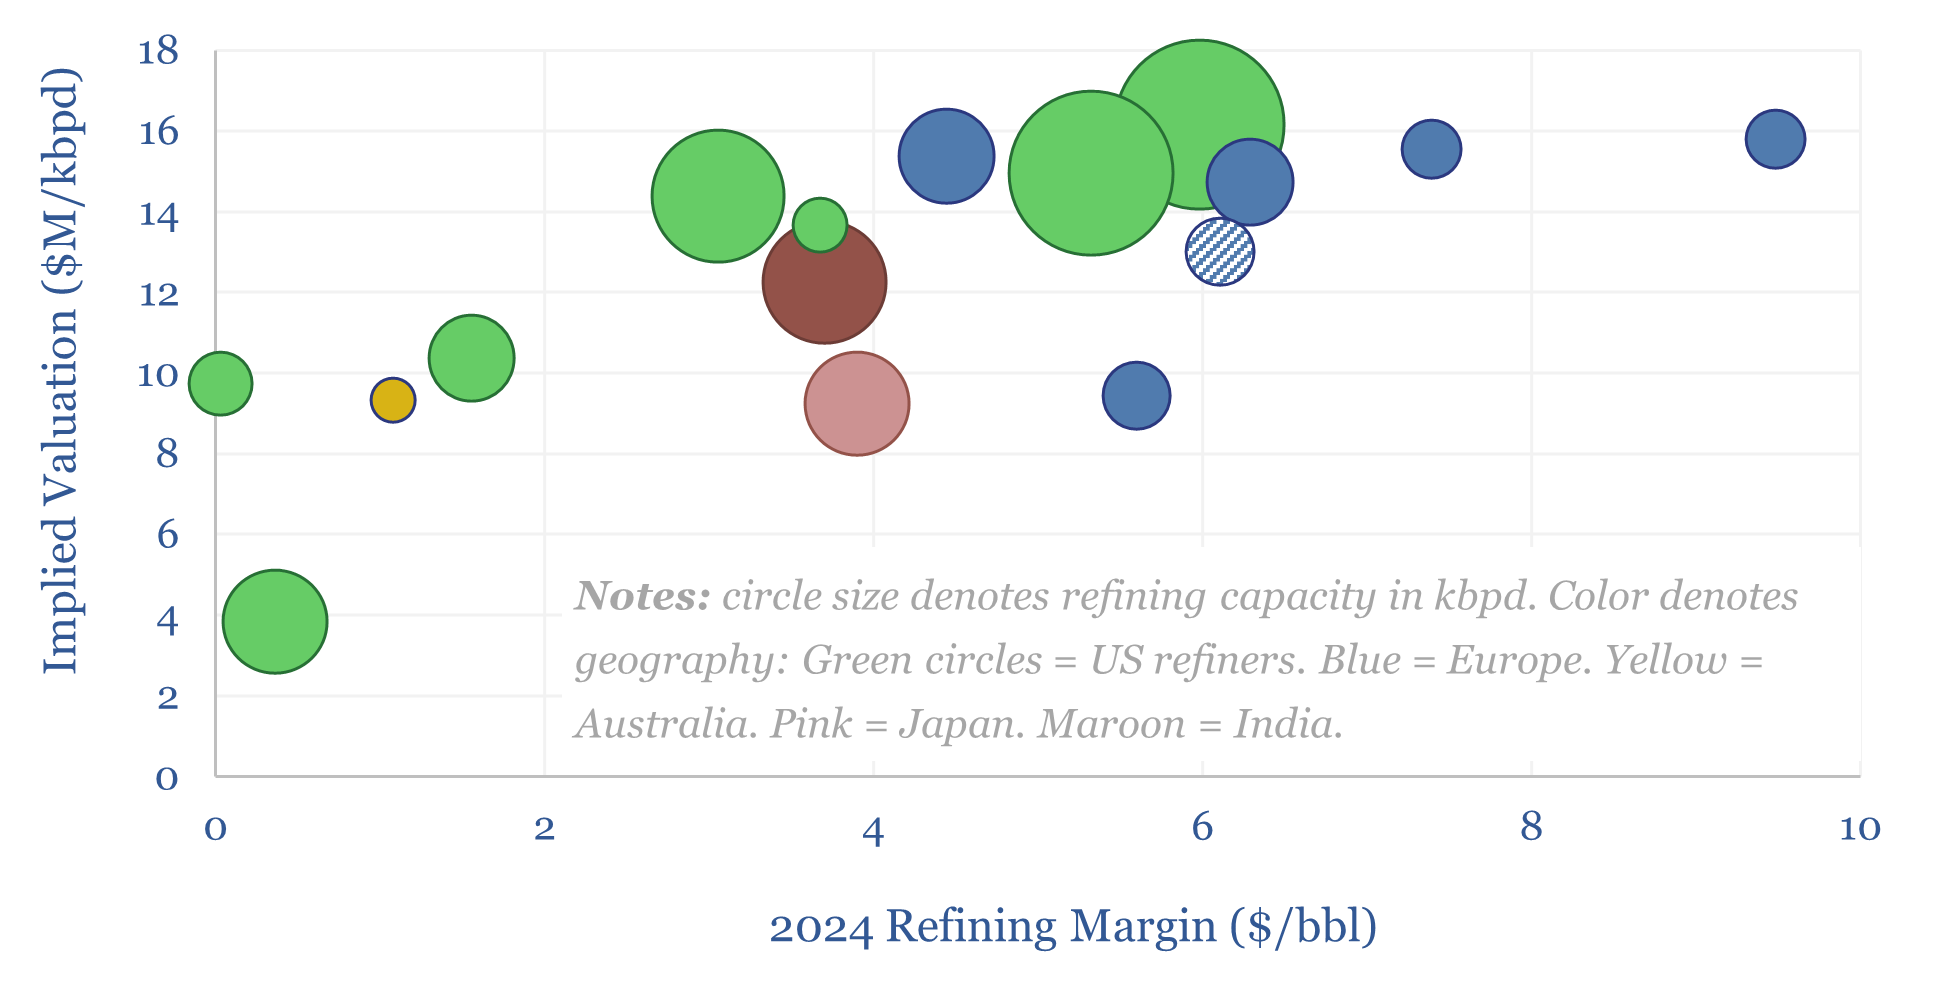
This data-file is a screen of 16 leading listed downstream companies, with 16Mbpd of refining capacity, currently valued at $200bn on an EV basis. Refining margins, costs, complexity, utilization and split between other business activities are summarized in the data-file.
Download the Screen?
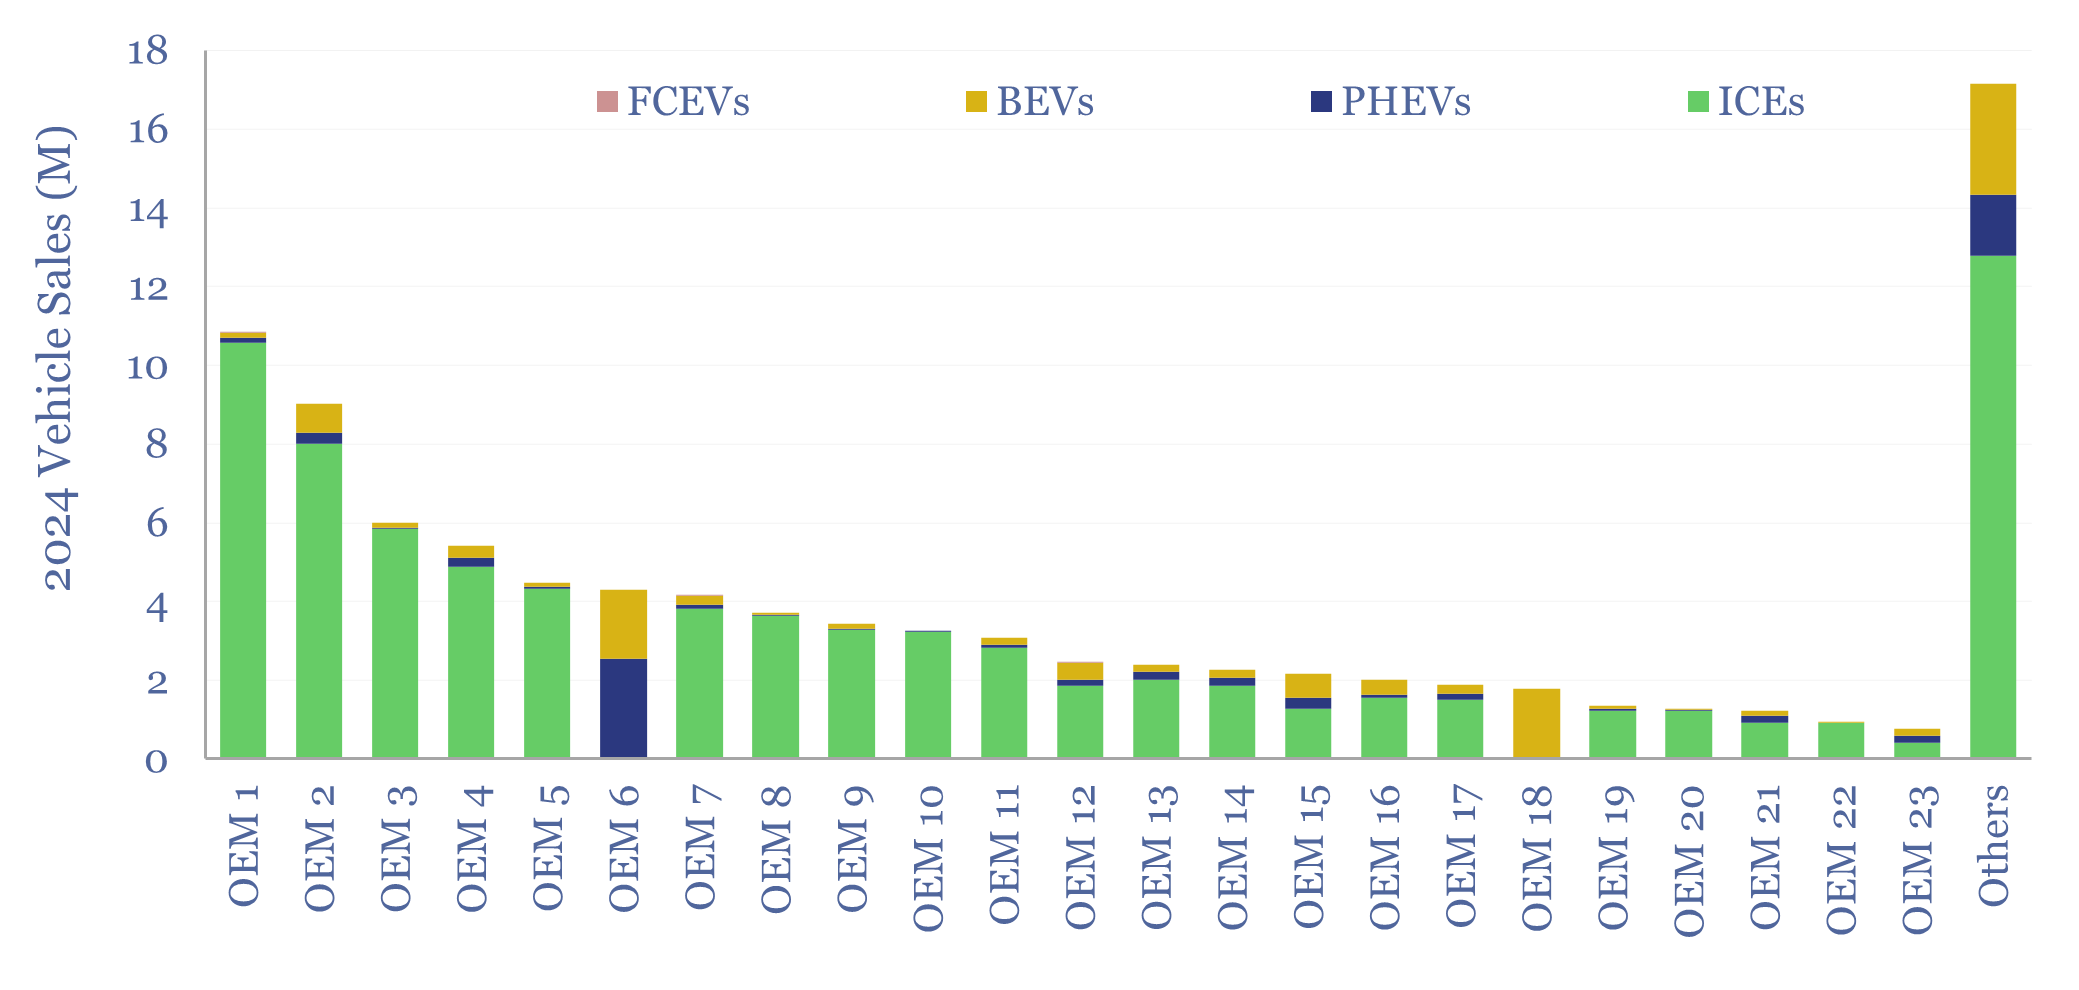
Global vehicle sales by manufacturer are broken down in this screen. 25 companies produce 85% of the world’s vehicles, led by Toyota, VW, Stellantis, GM and Ford. The data-file contains key notes on each company. In 2025, 35% of companies slowed their deployment of electric vehicles, while 95% accelerated their focus on autonomous vehicles.
Download the Screen?
A dozen companies act as the “battery integrators” for 90% of all grid-scale battery storage systems (BESS), packaging lithium ion cells into fully functional, containerized modules, which can be deployed and grid-connected. 2025 economics included over $30bn of revenues, $250/kWh selling prices and 8.5% operating margins. But competition is intensifying.
Download the Screen?
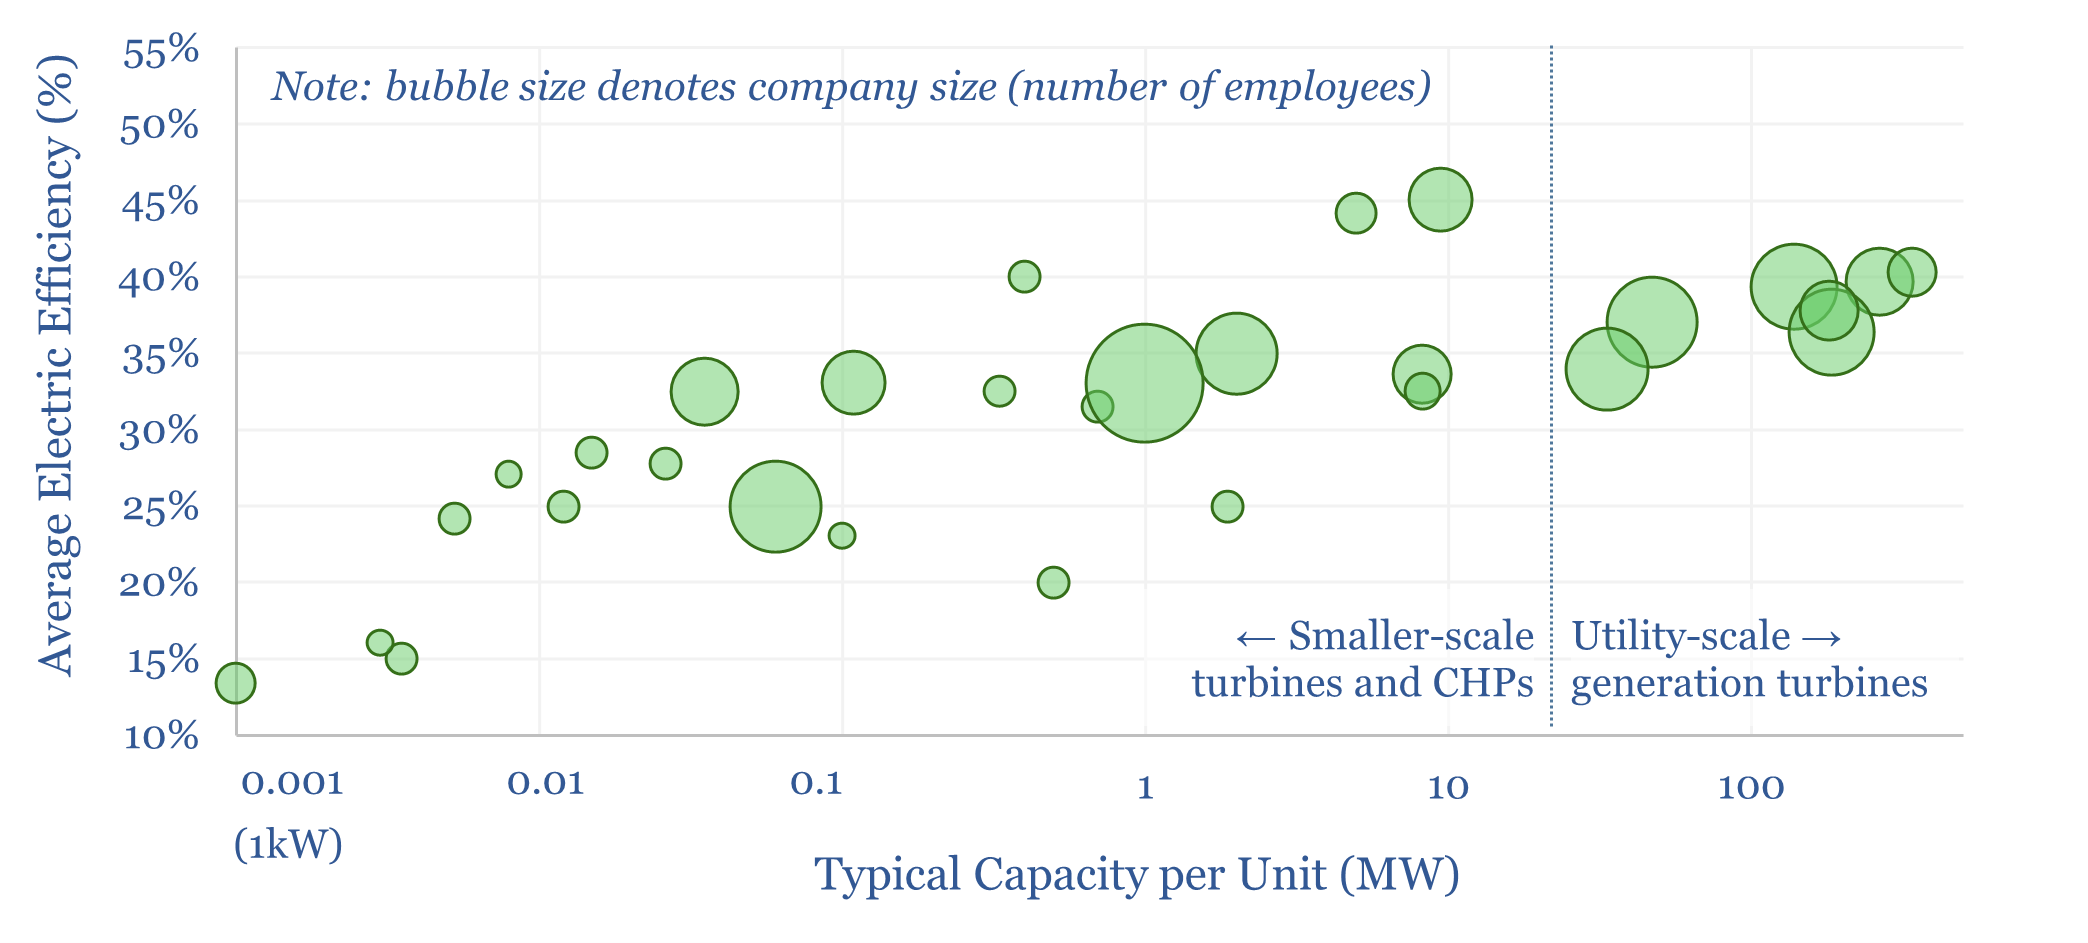
This data-file profiles gas turbines and gas turbine manufacturing capacity by company. 30 companies are profiled, including the ‘big three’ – GE Vernova, Siemens Energy and Mitsubishi Heavy. 100 gas turbines are profiles. And 25 gas turbine manufacturing facilities are also covered, in order to estimate gas turbine manufacturing capacity by region and by company.
Download the Screen?
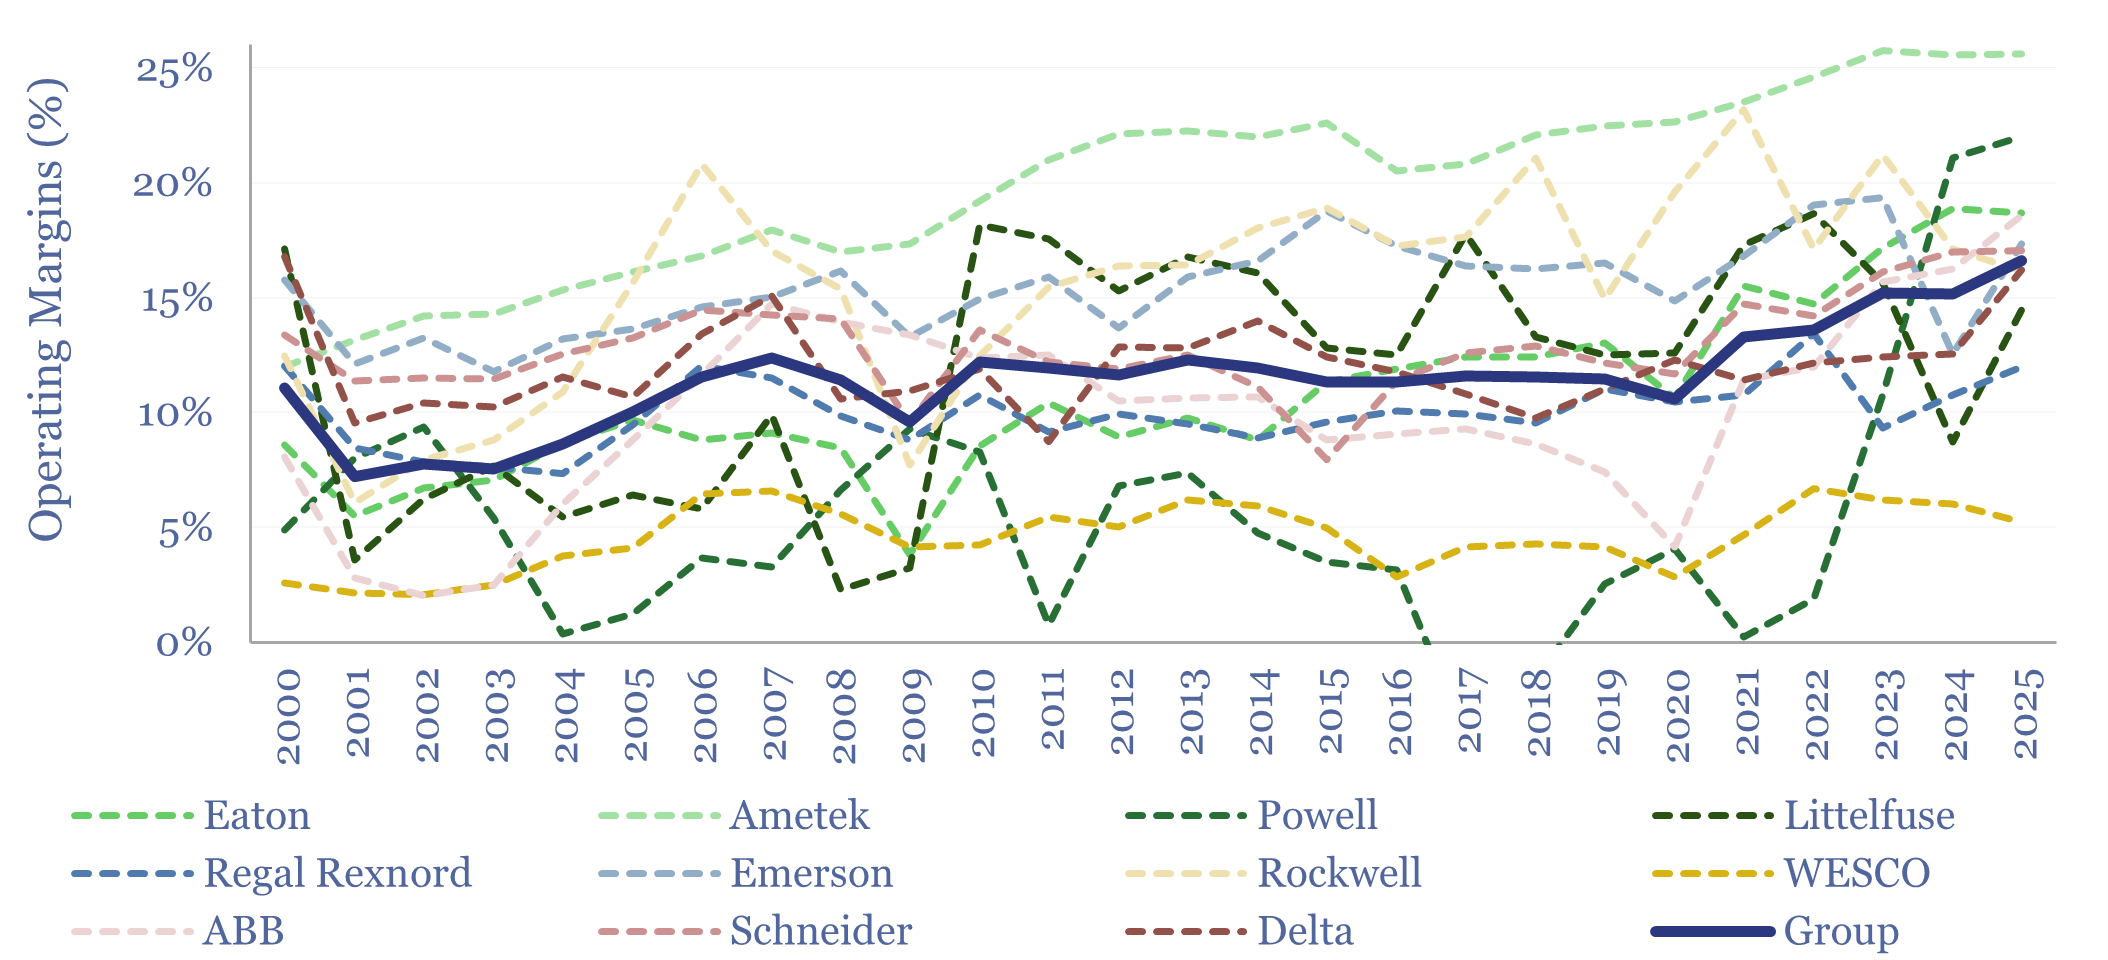
This data-file tracks power electronic capital goods company margins over time, rising from 10% in 2000-2010, to 12% in 2010-20 and then inflecting to a record 16% in 2025. The increase is mostly driven by higher- and medium-voltage categories, linked to re-accelerating load growth in the United States. Details on each company are in the data-file.
Download the Screen?
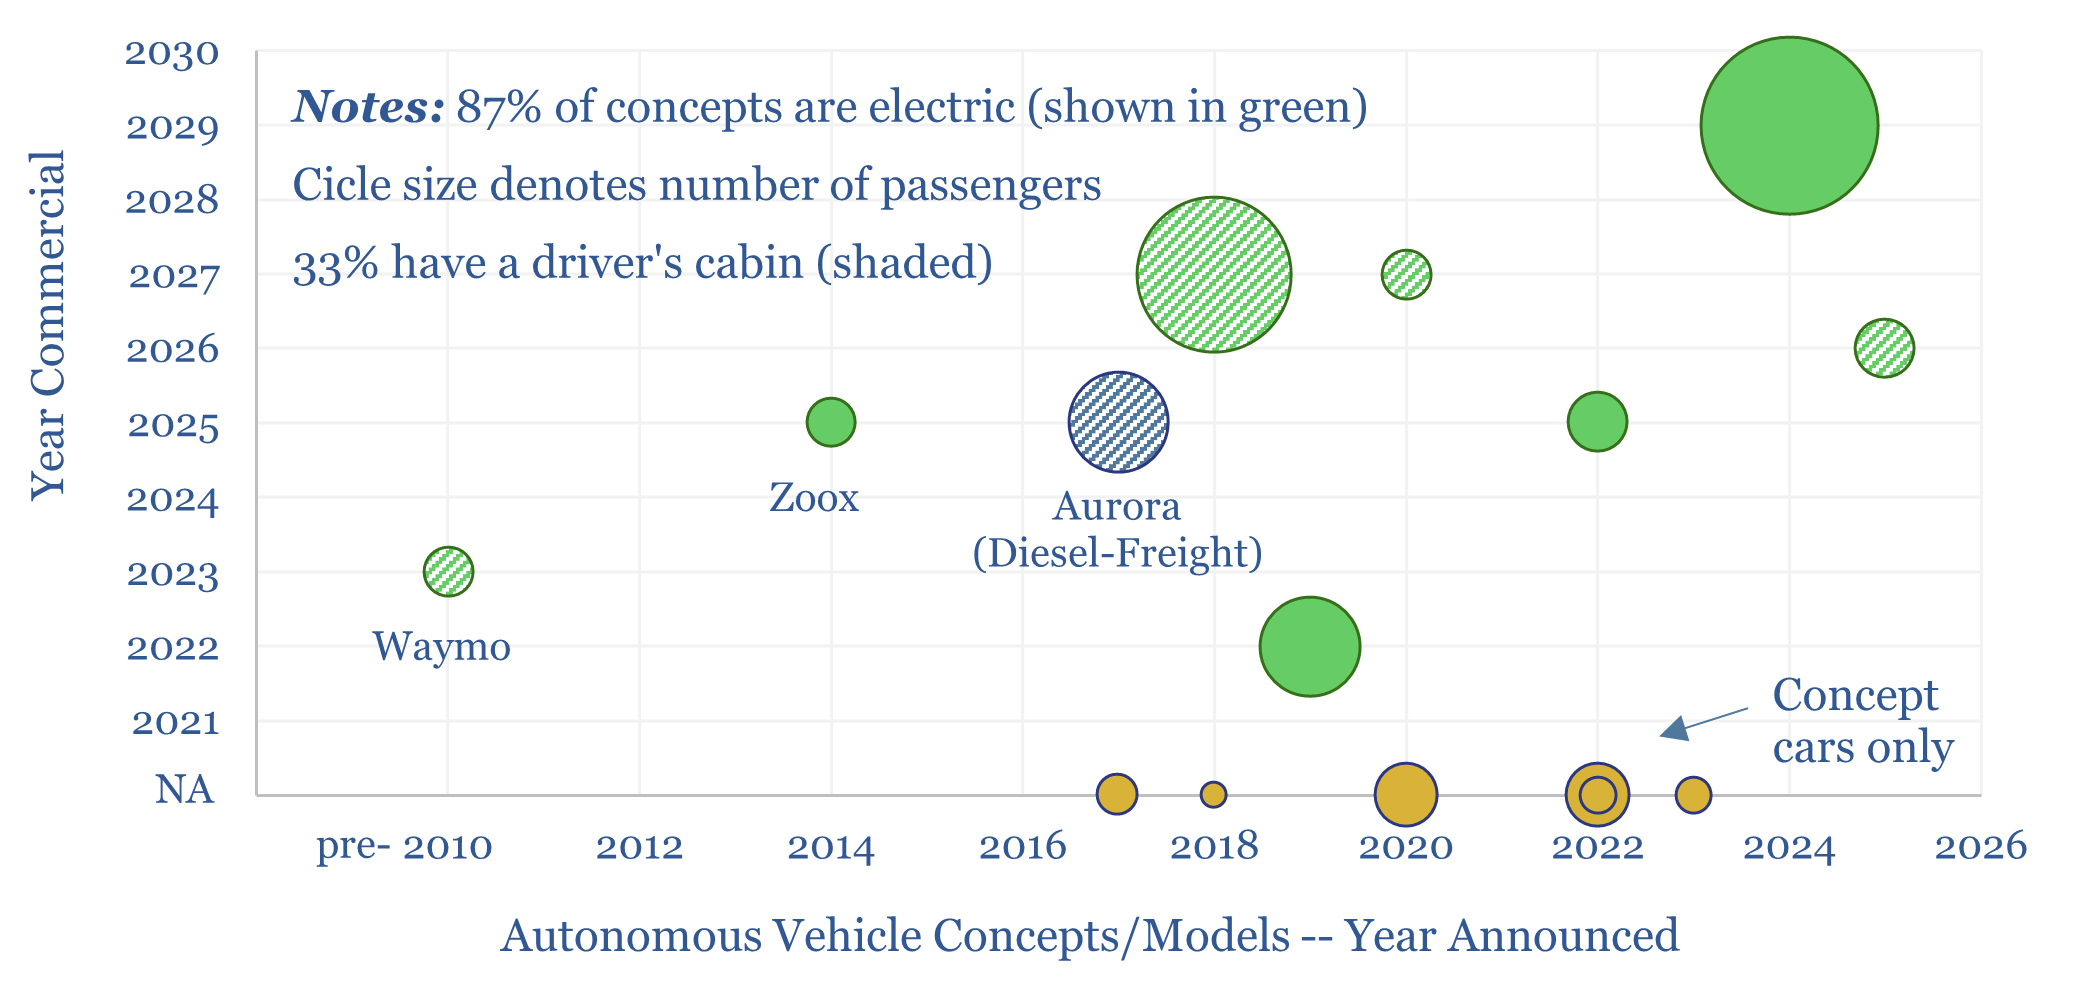
This data-file is a screen of autonomous vehicle concepts and autononomous vehicle companies. Specifically, in 2025, we profiled 15 autonomous vehicle concepts, robotaxis and autonomous trucks. 87% are envisaged to be electric. But the data also point to a broadening range of autonomous vehicle concepts emerging in future.
Download the Screen?
The global flow-meter market was worth $12bn in 2024, across 4M flow-meters, with an average price of $3k per unit, and typical accuracy of 0.5-1%. This data-file disaggregates the market by flow-meter type, highlighting the physics, advantages, challenges, pricing, volumes, market sizing and leading companies involved in each type.
Download the Screen?
Nuclear equipment manufacturers are captured in this company screen, covering 20 companies, with $10bn pa of revenues, c10% EBIT margins, and a 5% average sales exposure to nuclear components. Our notes also capture key details, equipment specializations, and recent focuses of each company.
Download the Screen?
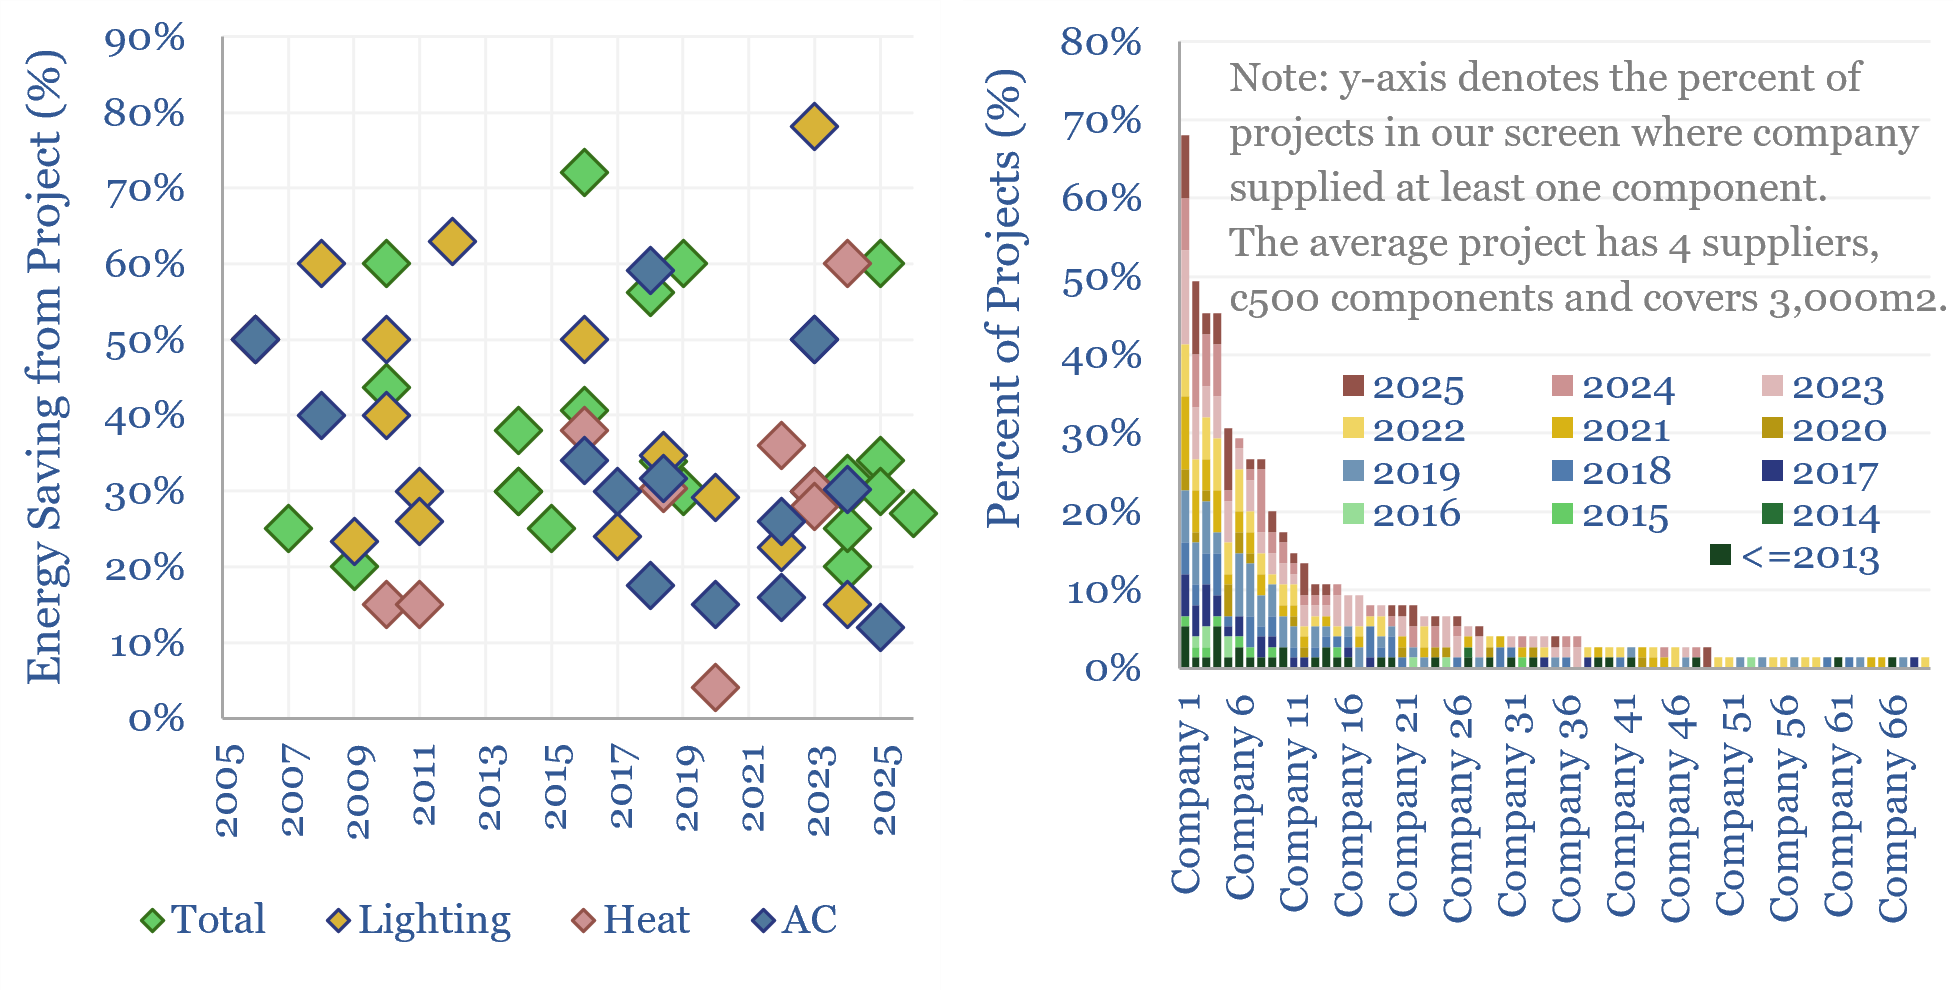
Building automation via smart energy projects are captured in this data-file, using sensors, KNX and/or AI. Optimizing lighting, heating, AC and overall energy use saves 35% energy on average. Leading suppliers of the underlying sensors and drivers are also tabulated across past projects.
Download the Screen?
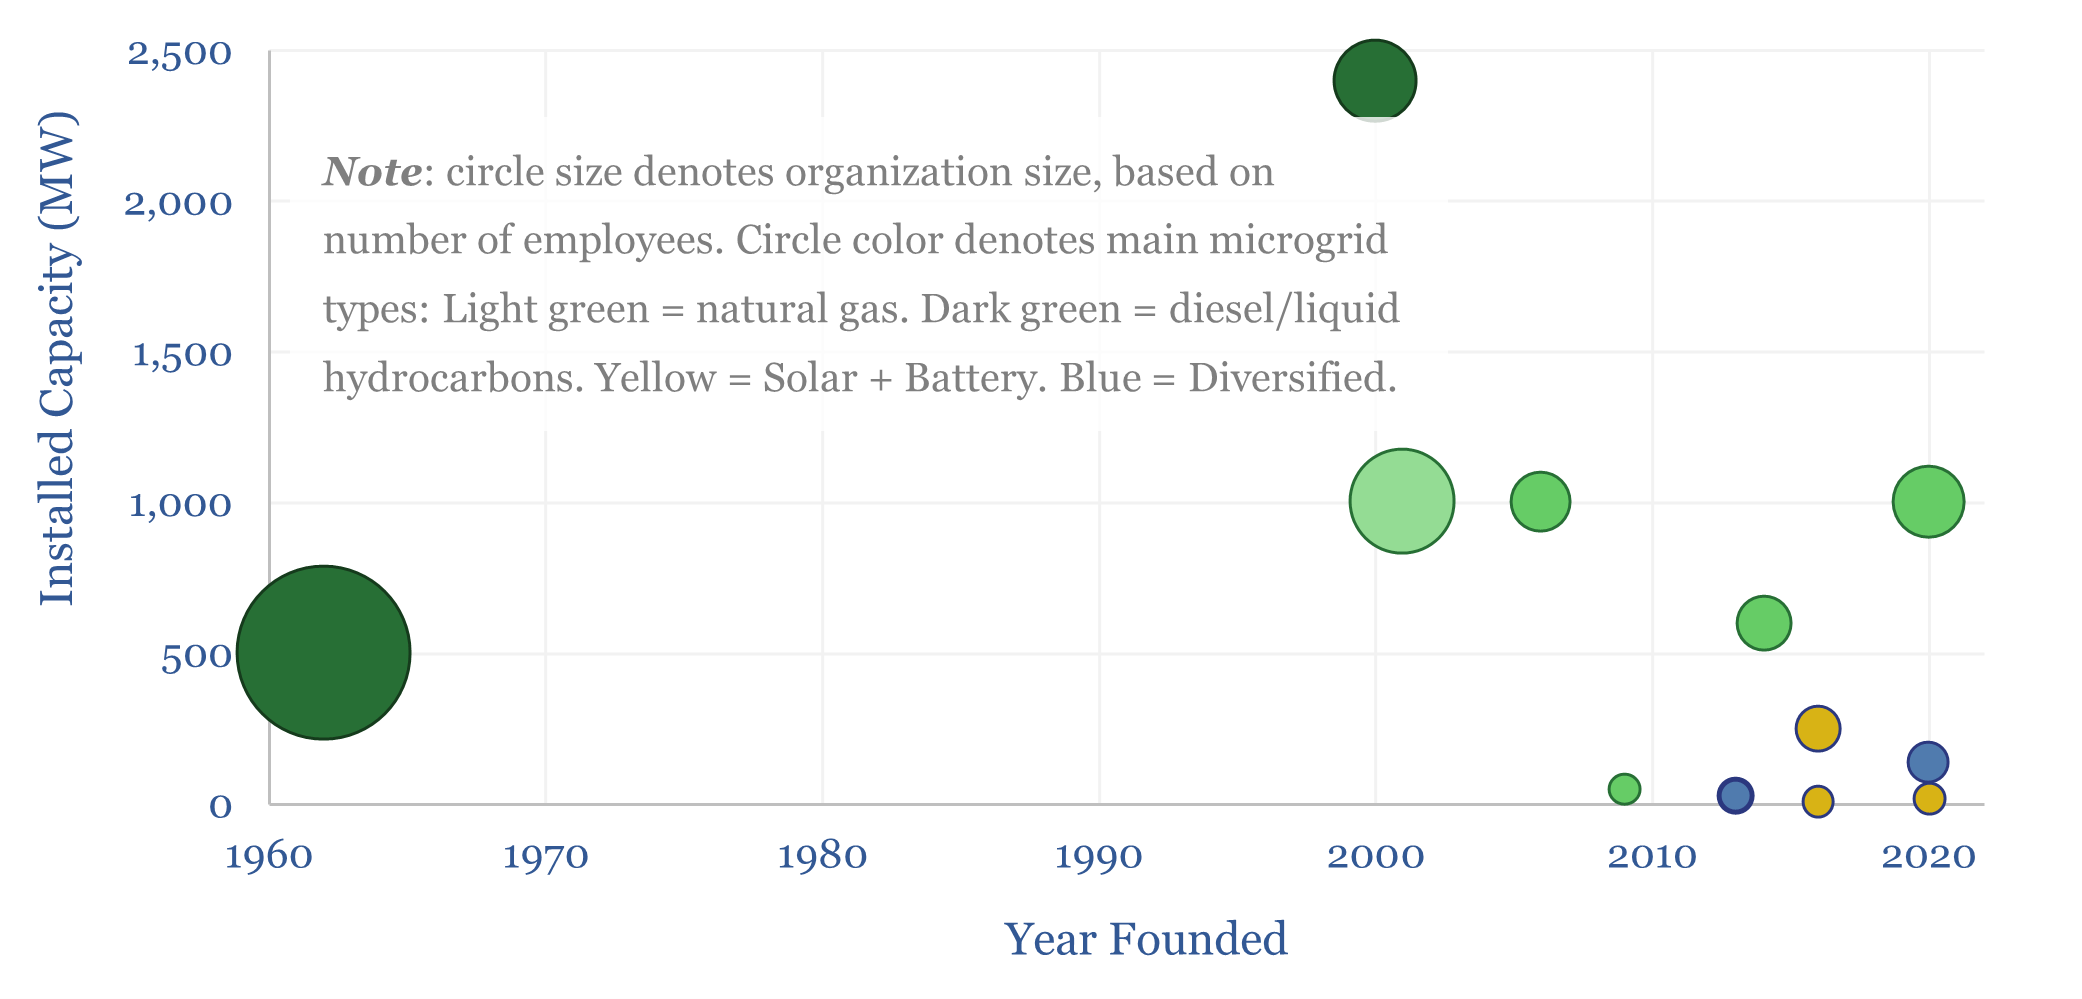
This data-file profiles microgrid companies, which specialize in the engineering, procurement, installation and operation of microgrids. These companies help to provide reliable power; either in locations that are not served by the T&D network, or with the capability of “islanding” from the main grid amidst grid disruptions. A dozen companies stood out.
Download the Screen?
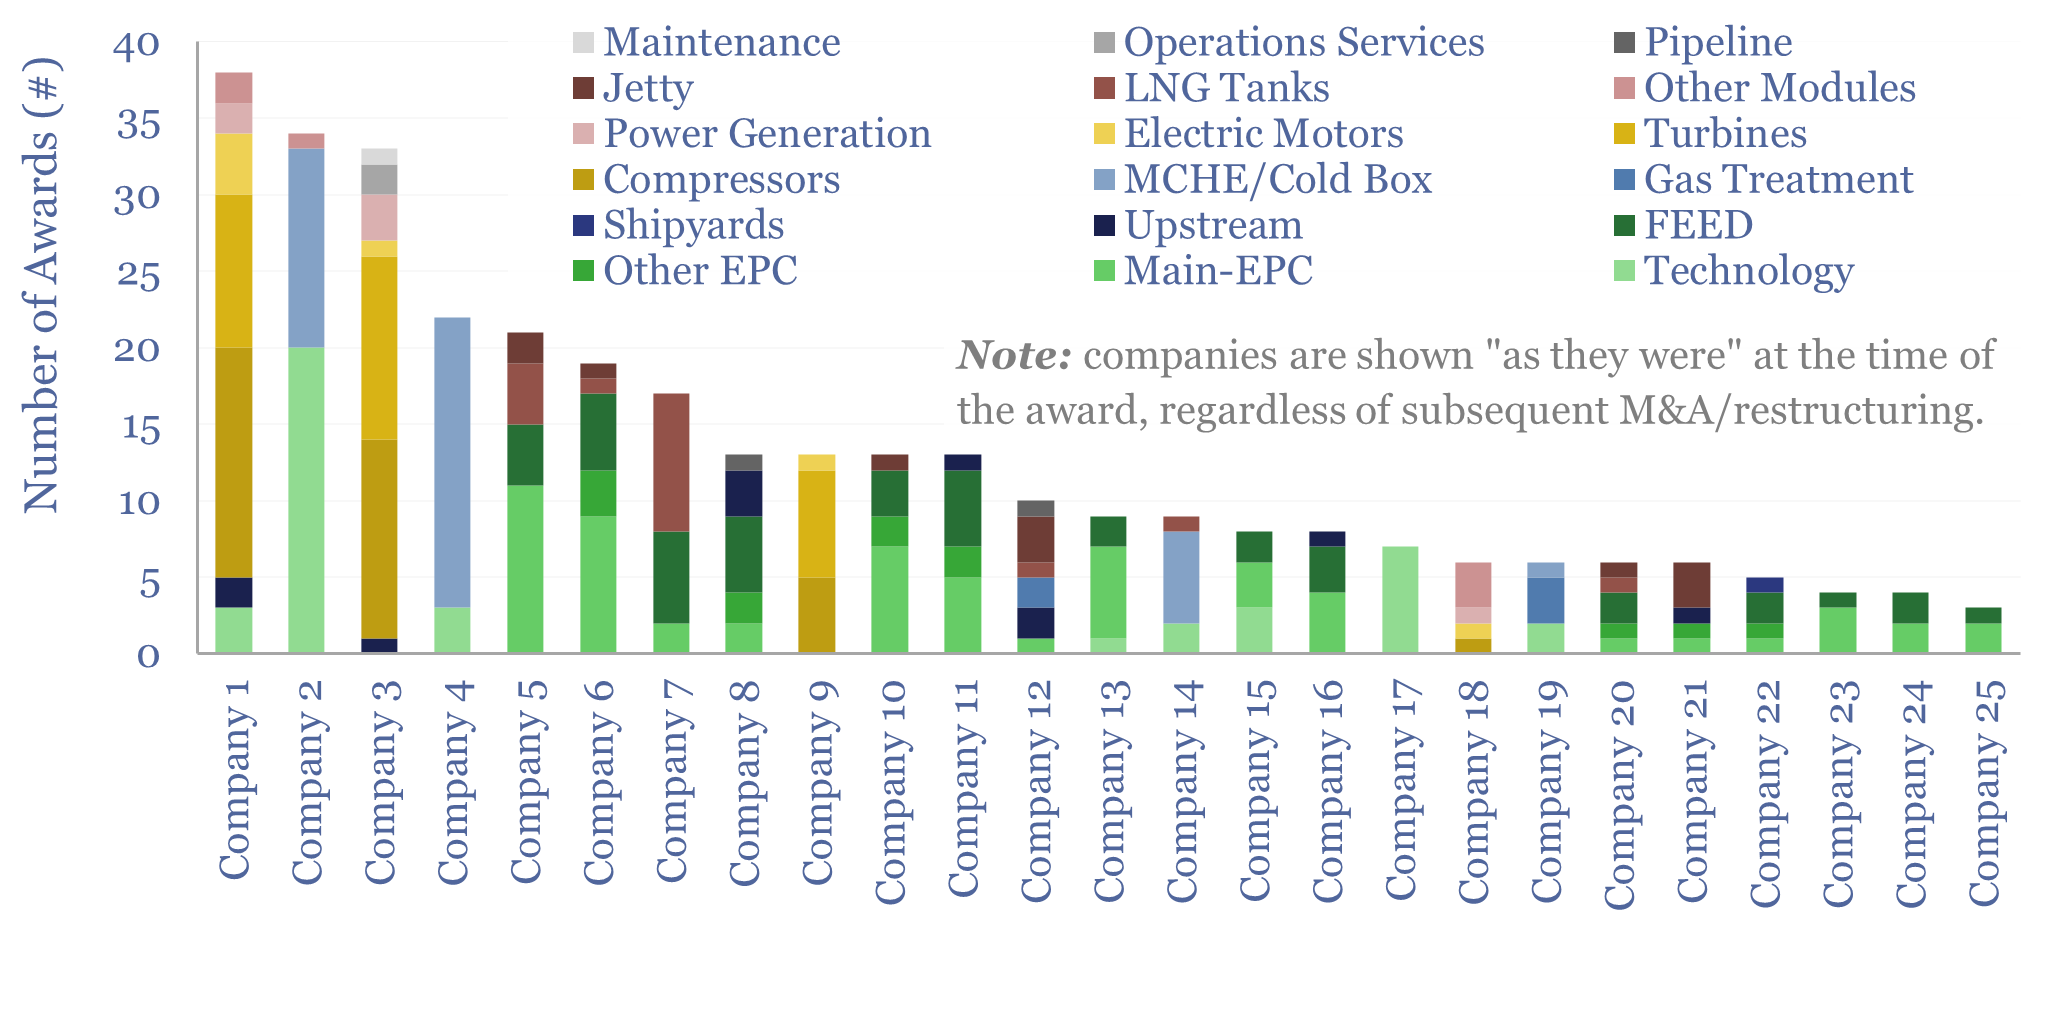
This data-file breaks down the global LNG supply chain, by company, by component, by assessing 50 LNG projects from 2014 to 2030, who won the order flow, for which components, and at what price. The LNG supply chain has gone through unprecedented upheaval, ramification and re-integration.
Download the Screen?
This data-file screens c30 next-generation nuclear companies at the cutting edge of fission and fusion technology. The median one employs 100 people, is developing a 150MWe reactor, and could reach commerciality by 2035. But how has this landscape of companies progressed in the past few years?
Download the Screen?
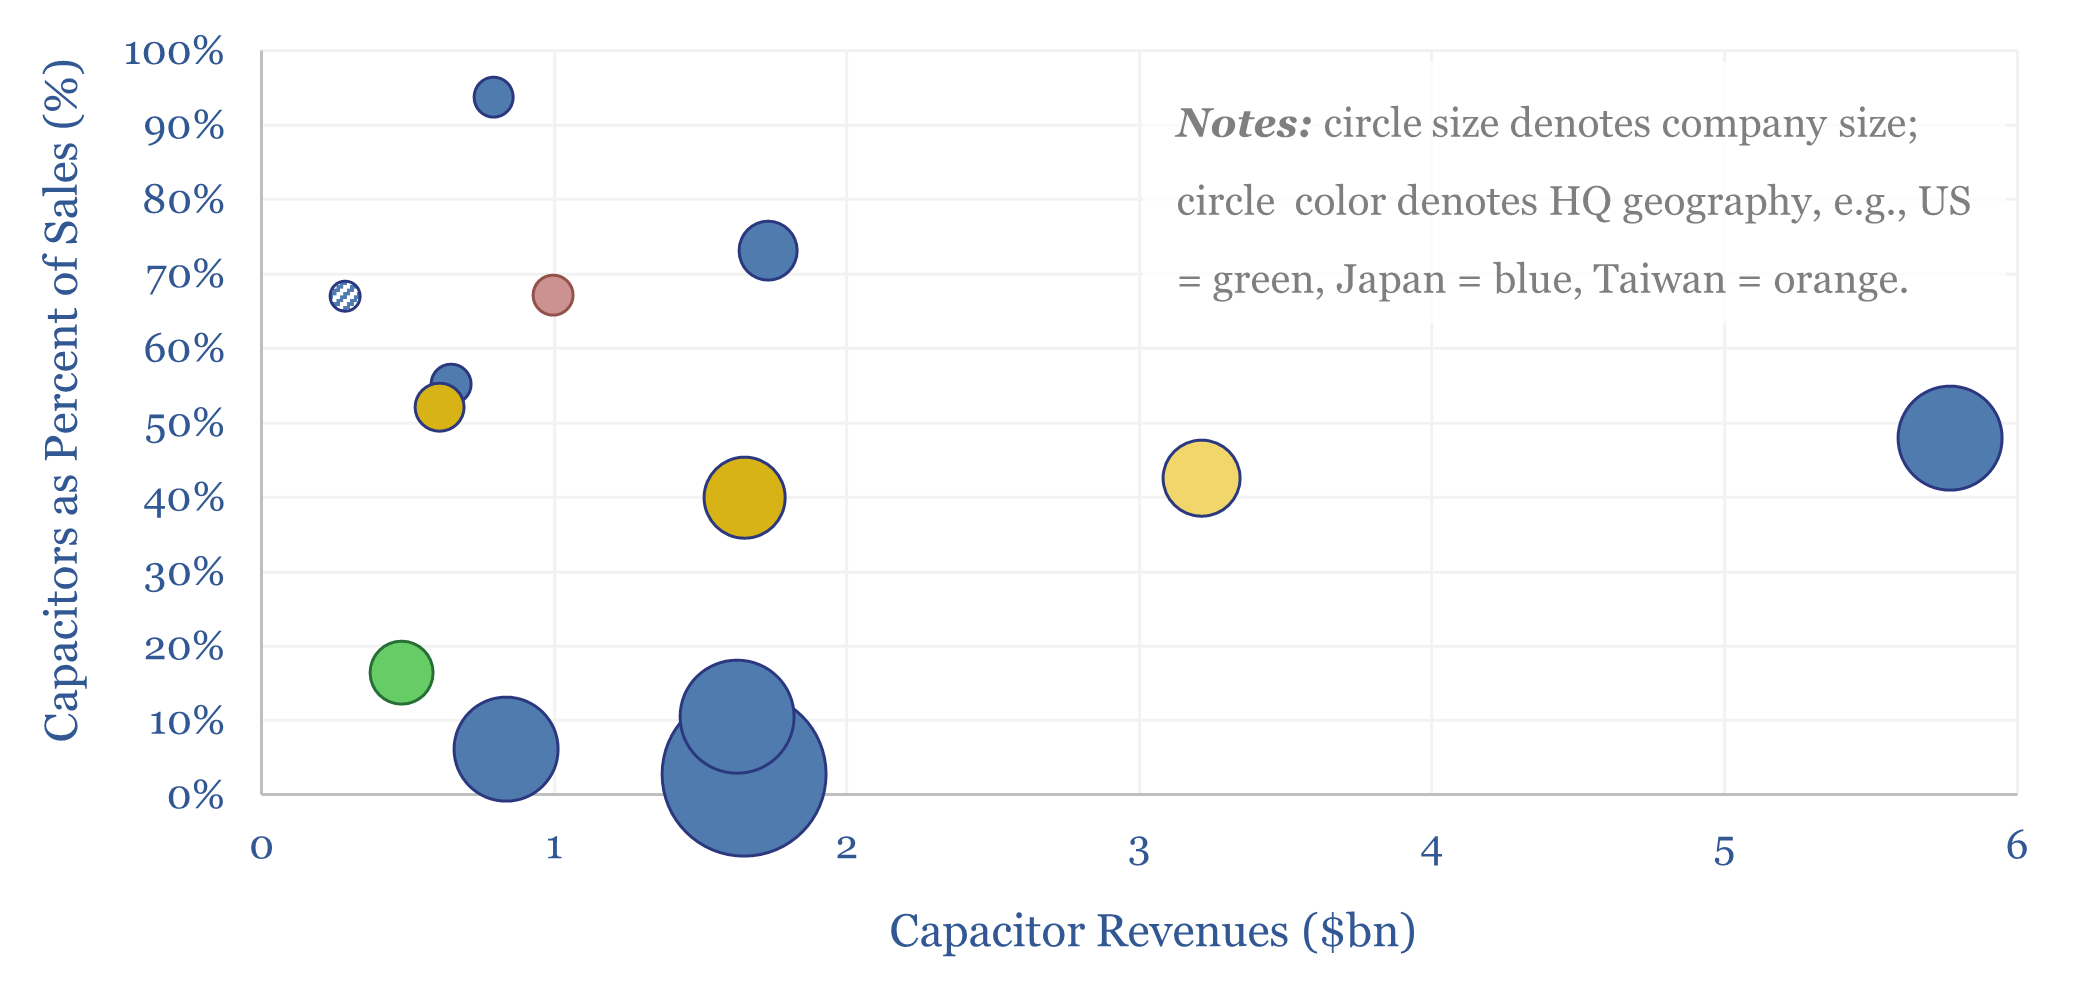
This data-file profiles a dozen leading companies in capacitors, which control two-thirds of the $30bn pa global market. Many companies also produce other passive electronic components, sensors and MOSFETs. Hence will the rise of AI, especially transient-heavy data-centers, pull on demand?
Download the Screen?
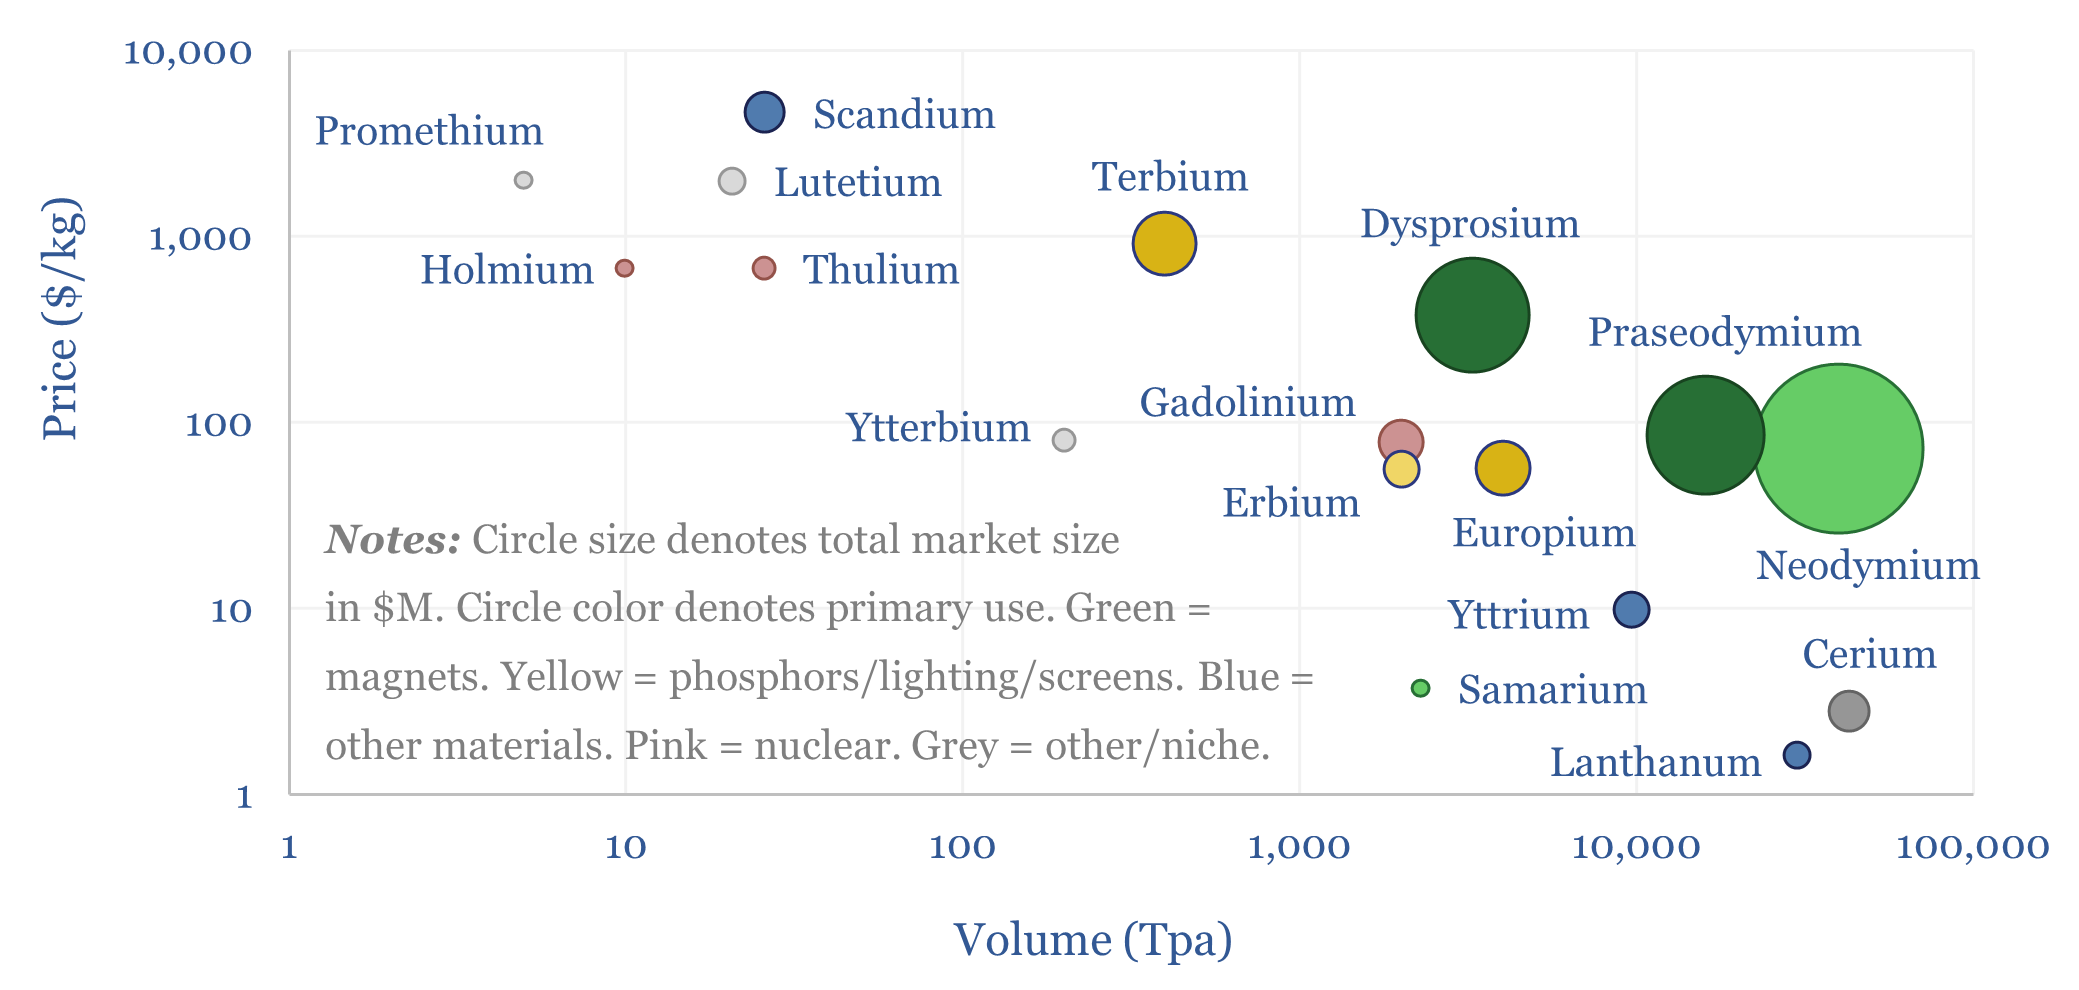
The global Rare Earth market is 390kTpa of mined Rare Earth Oxide equivalents, which is processed to yield 150kTpa of sellable Rare Earth materials, with a value of $7bn pa. But “price” is not “value”. This data-file breaks down the global Rare Earth market, by metal, by price (in $/kg), by volume (in Tpa), and summarizes the key uses of each Rare Earth metal.
Download the Screen?
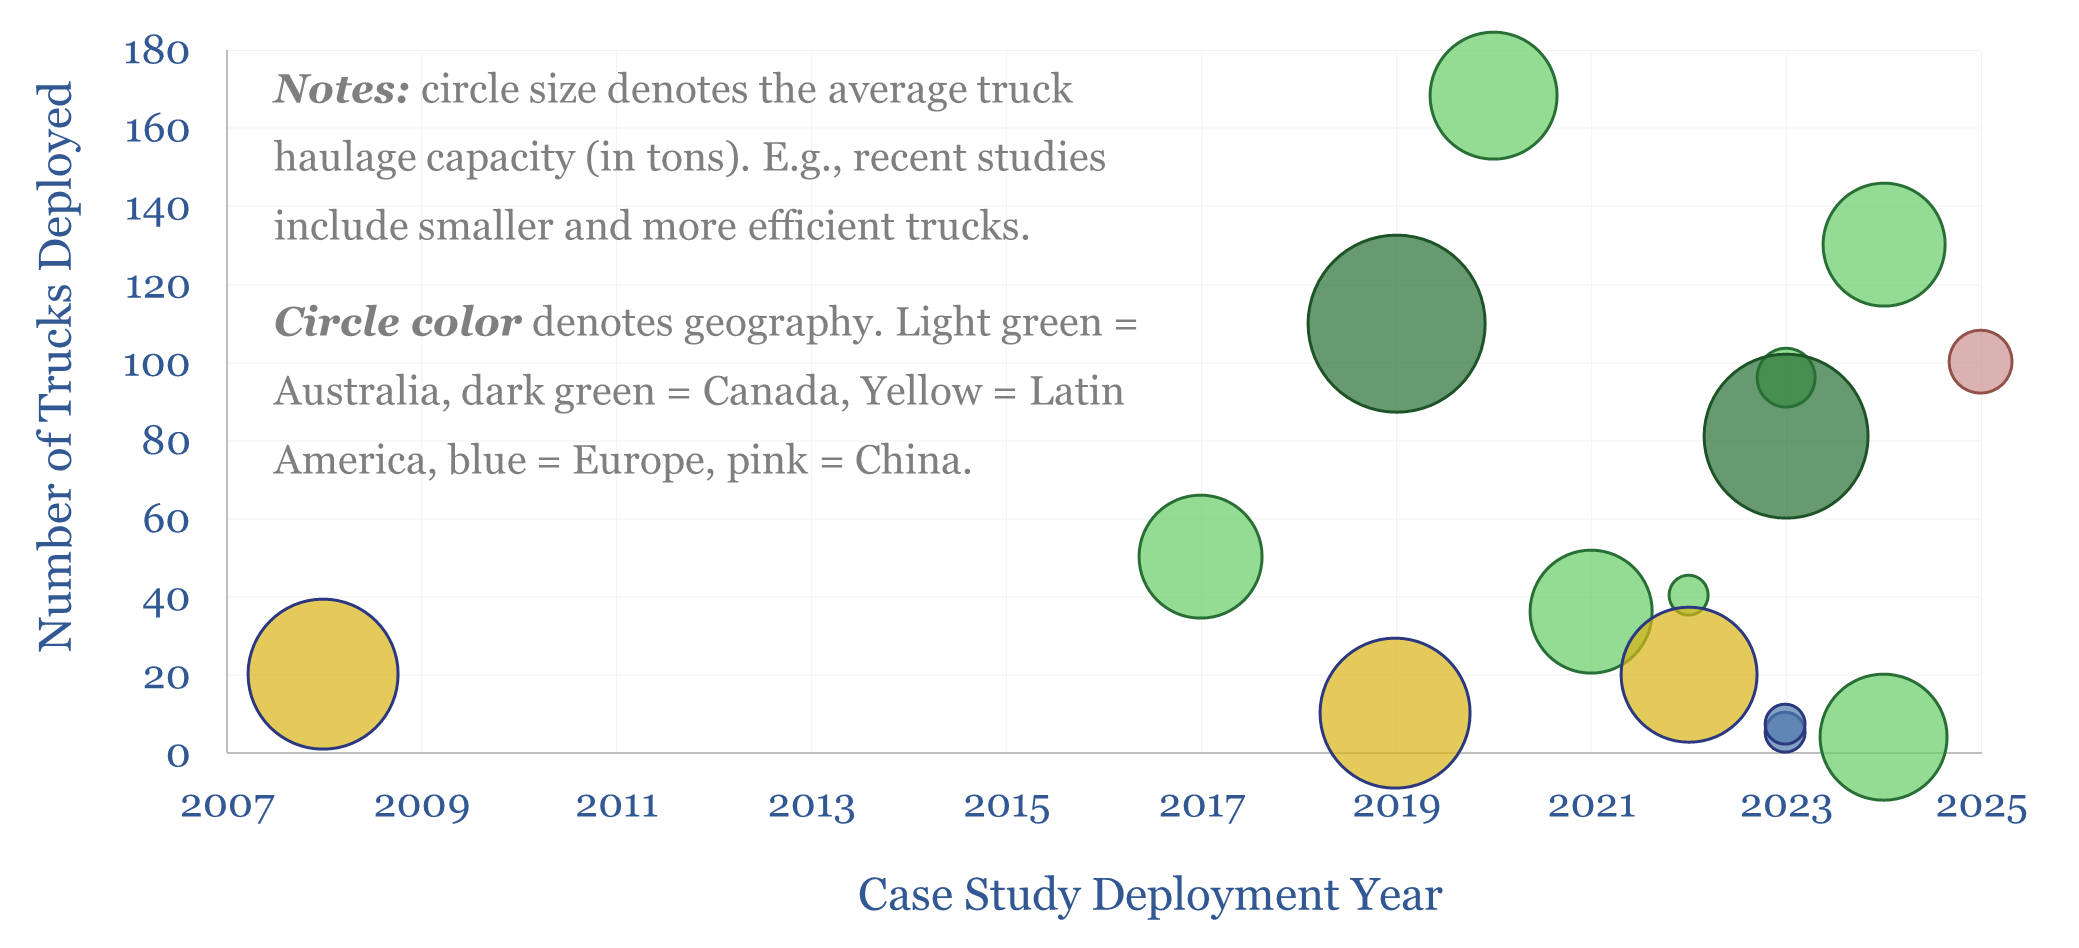
Autonomous mining trucks have been gaining share since 2010, and now number almost 2,000 in total, across dozens of mines globally. So this data-file presents some case studies of autonomous mining trucks, and provides yet another example of digital progress. The work also shows leading companies in autonomous mining trucks, among adopters and mining equipment companies.
Download the Screen?
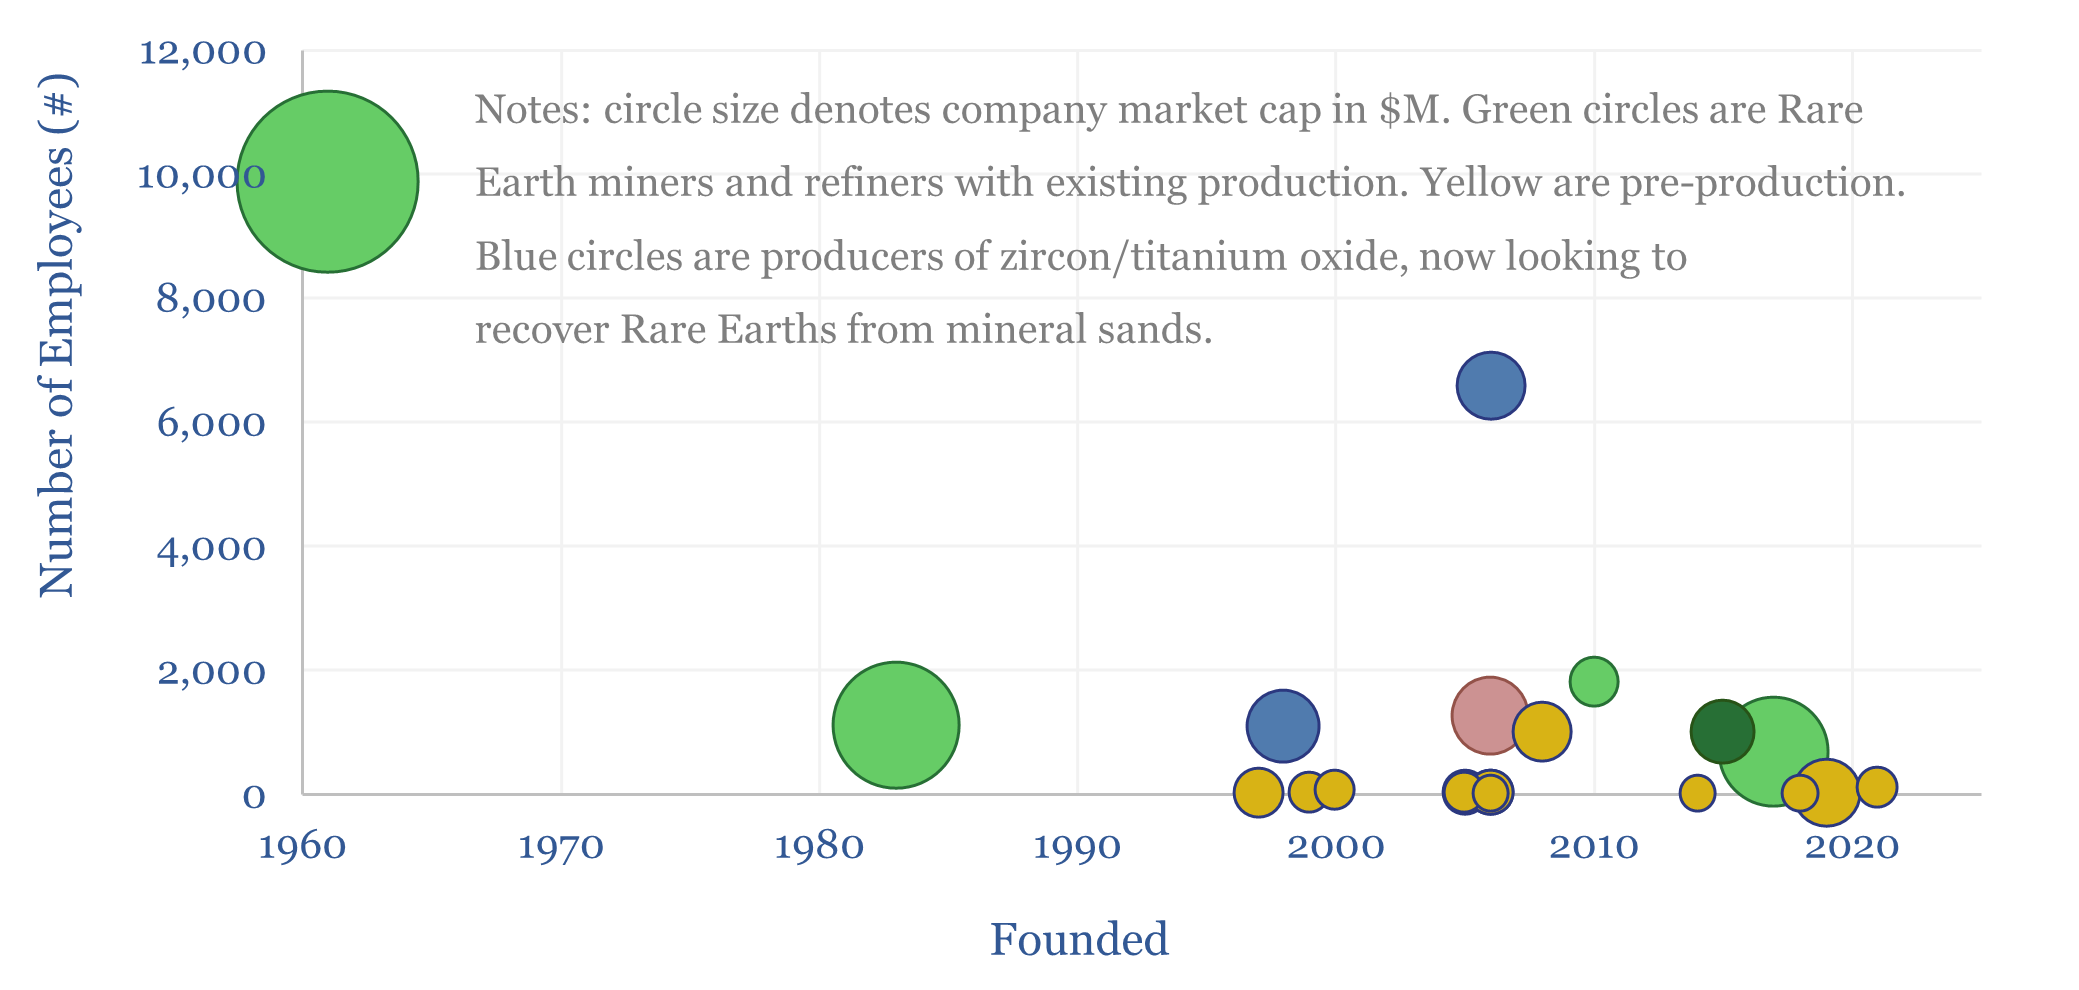
This screen of Rare Earth miners and refiners captures 20 Rare Earth companies, their flagship projects, and economic parameters such as capex, ore grades, end products and NPVs. A vibrant landscape is evolving, especially for NdPr and DyTb, although the market is still risking pre-produdction projects heavily.
Download the Screen?
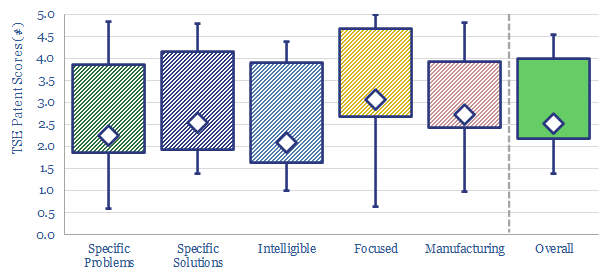
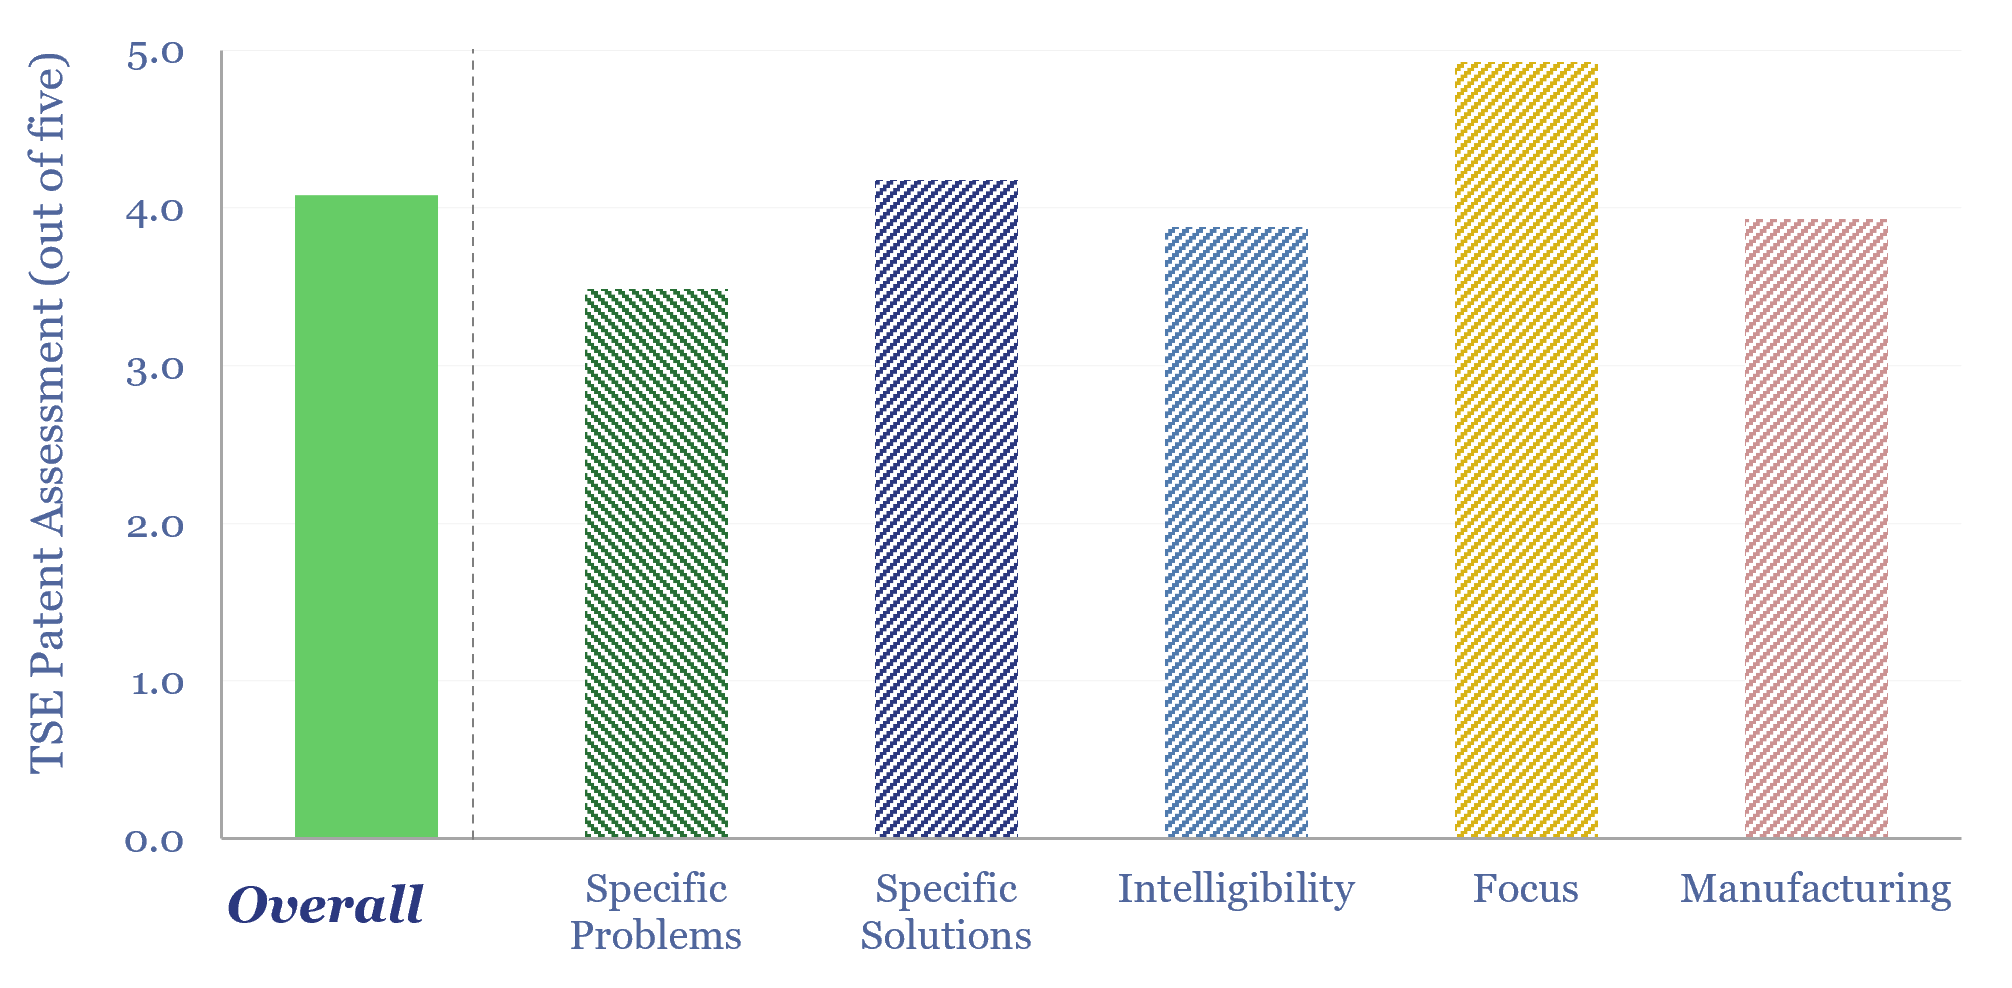
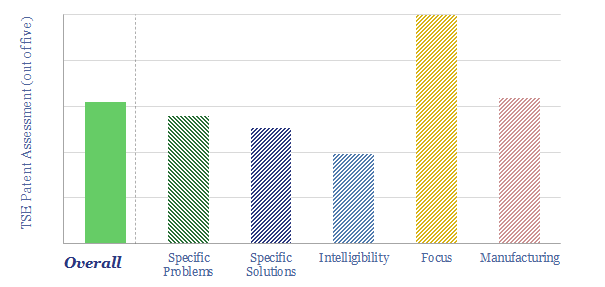
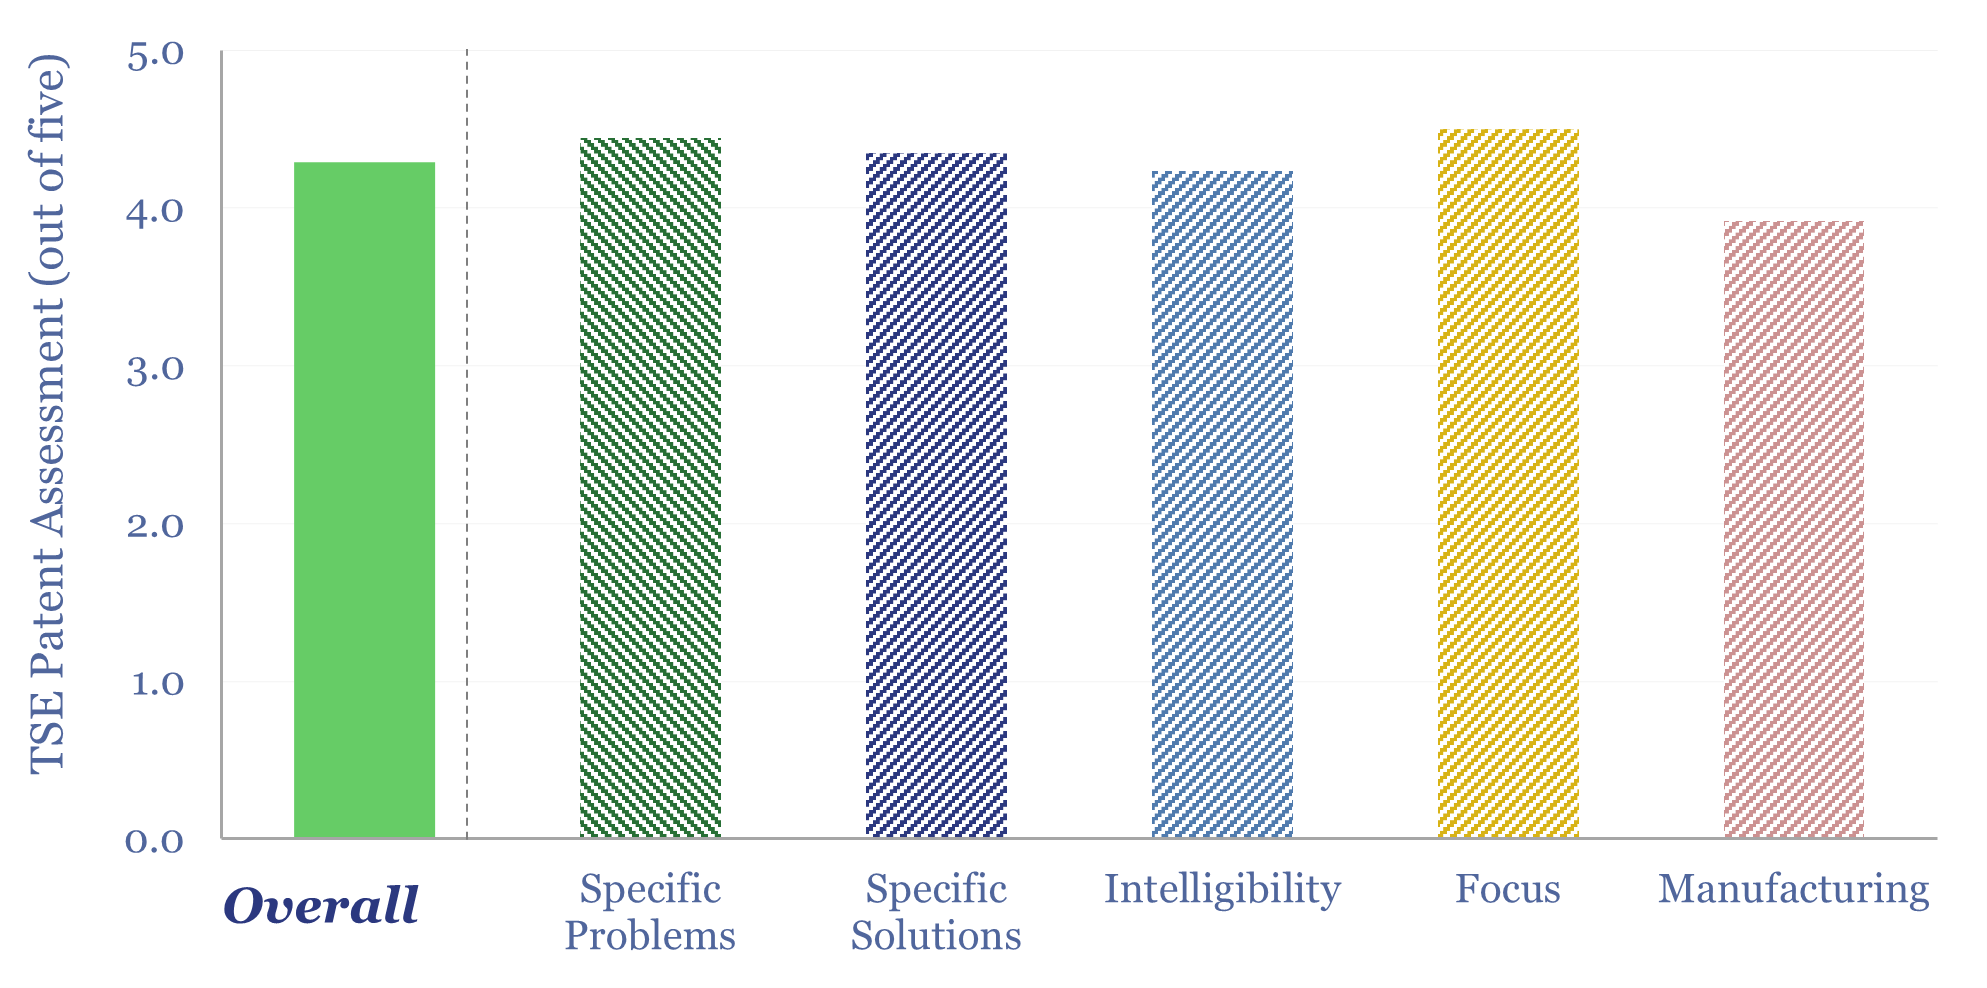
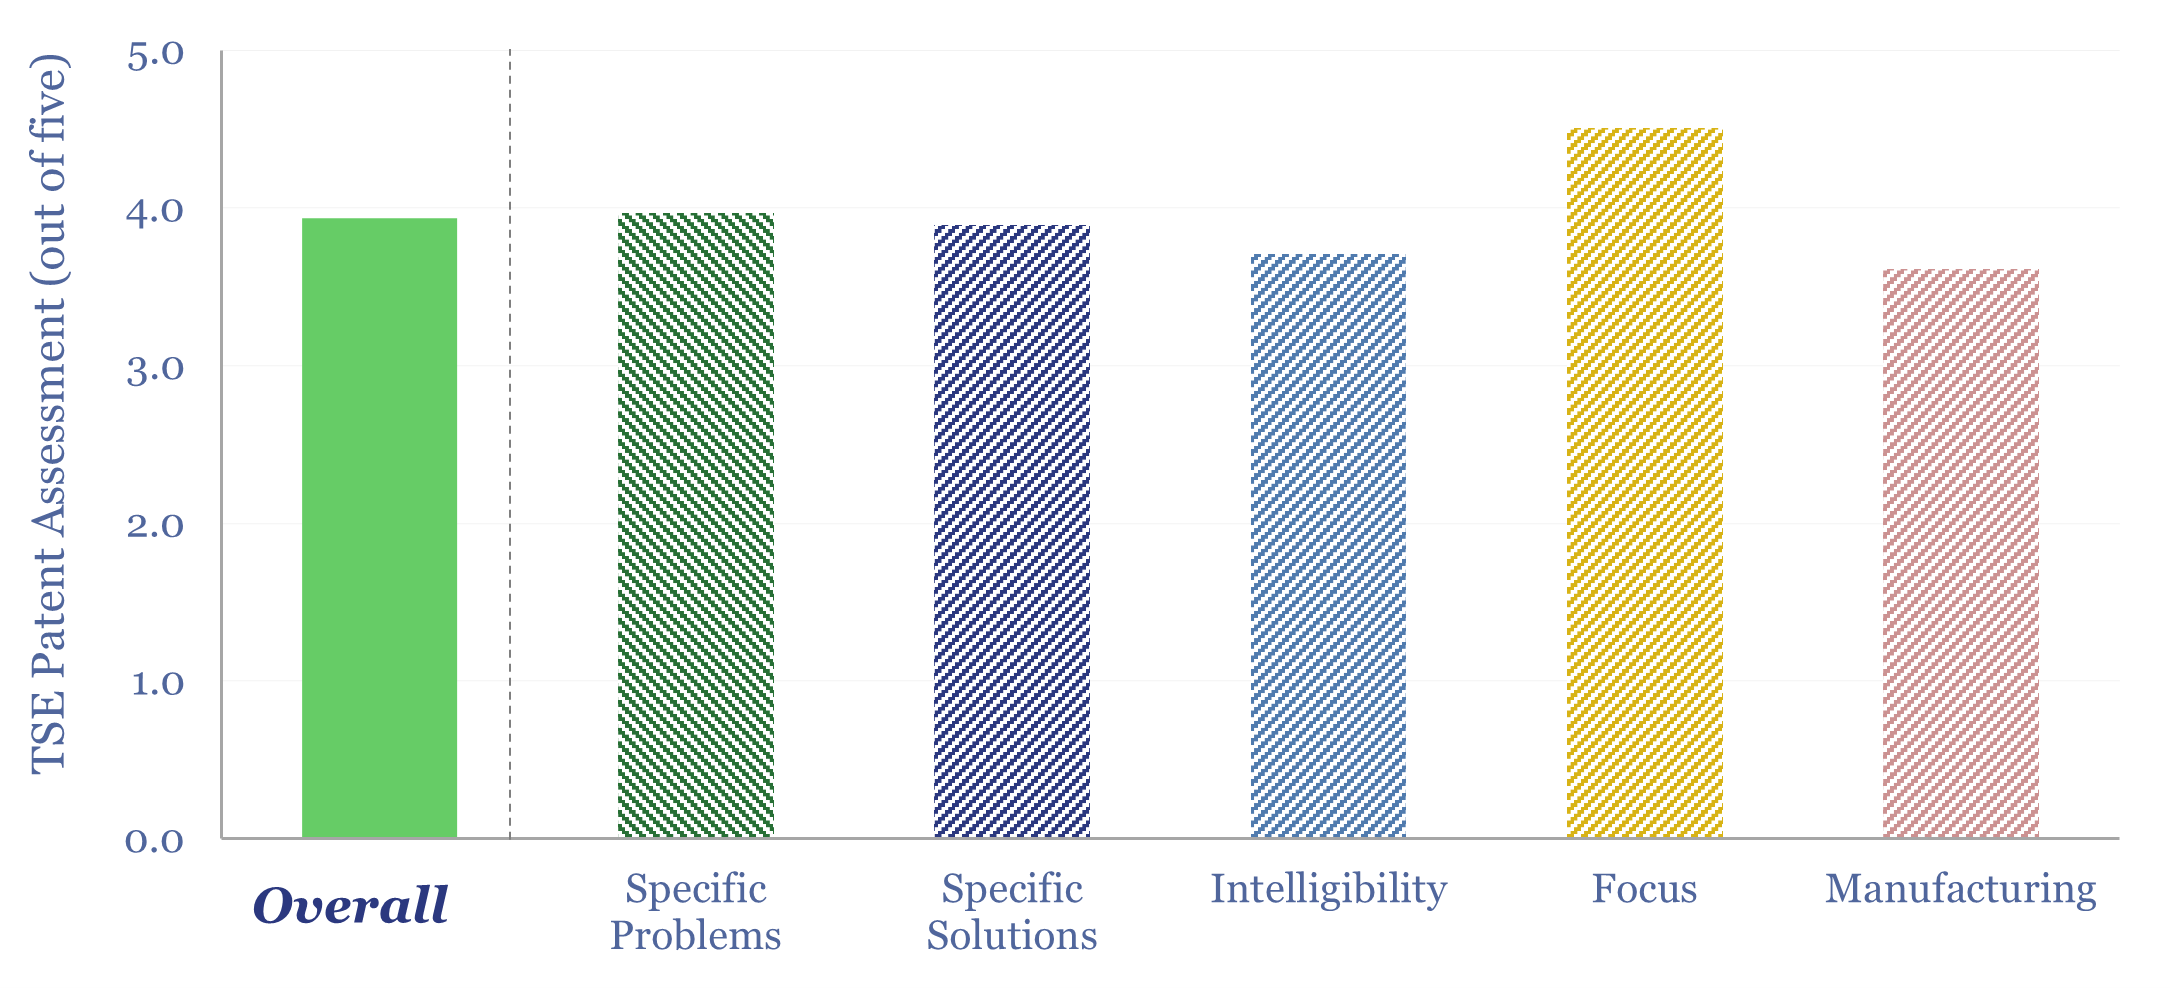
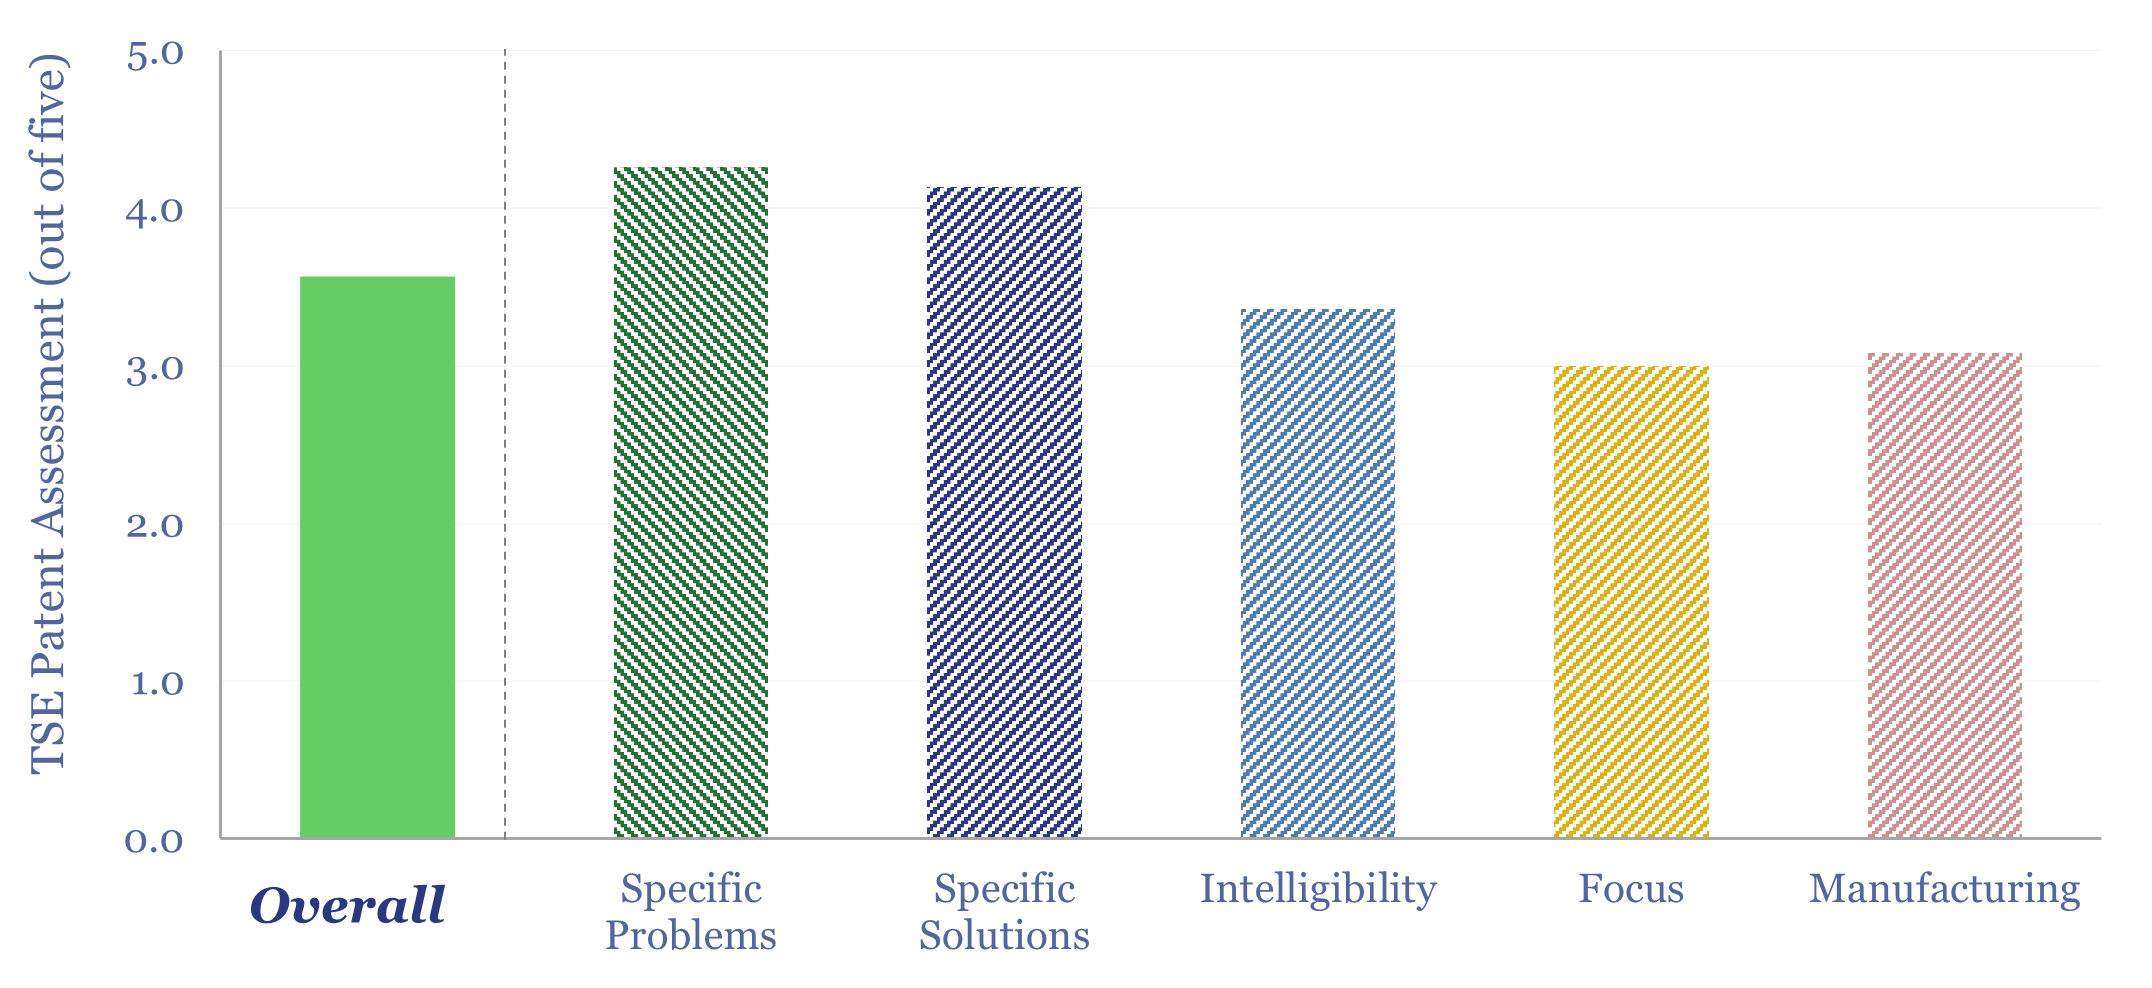
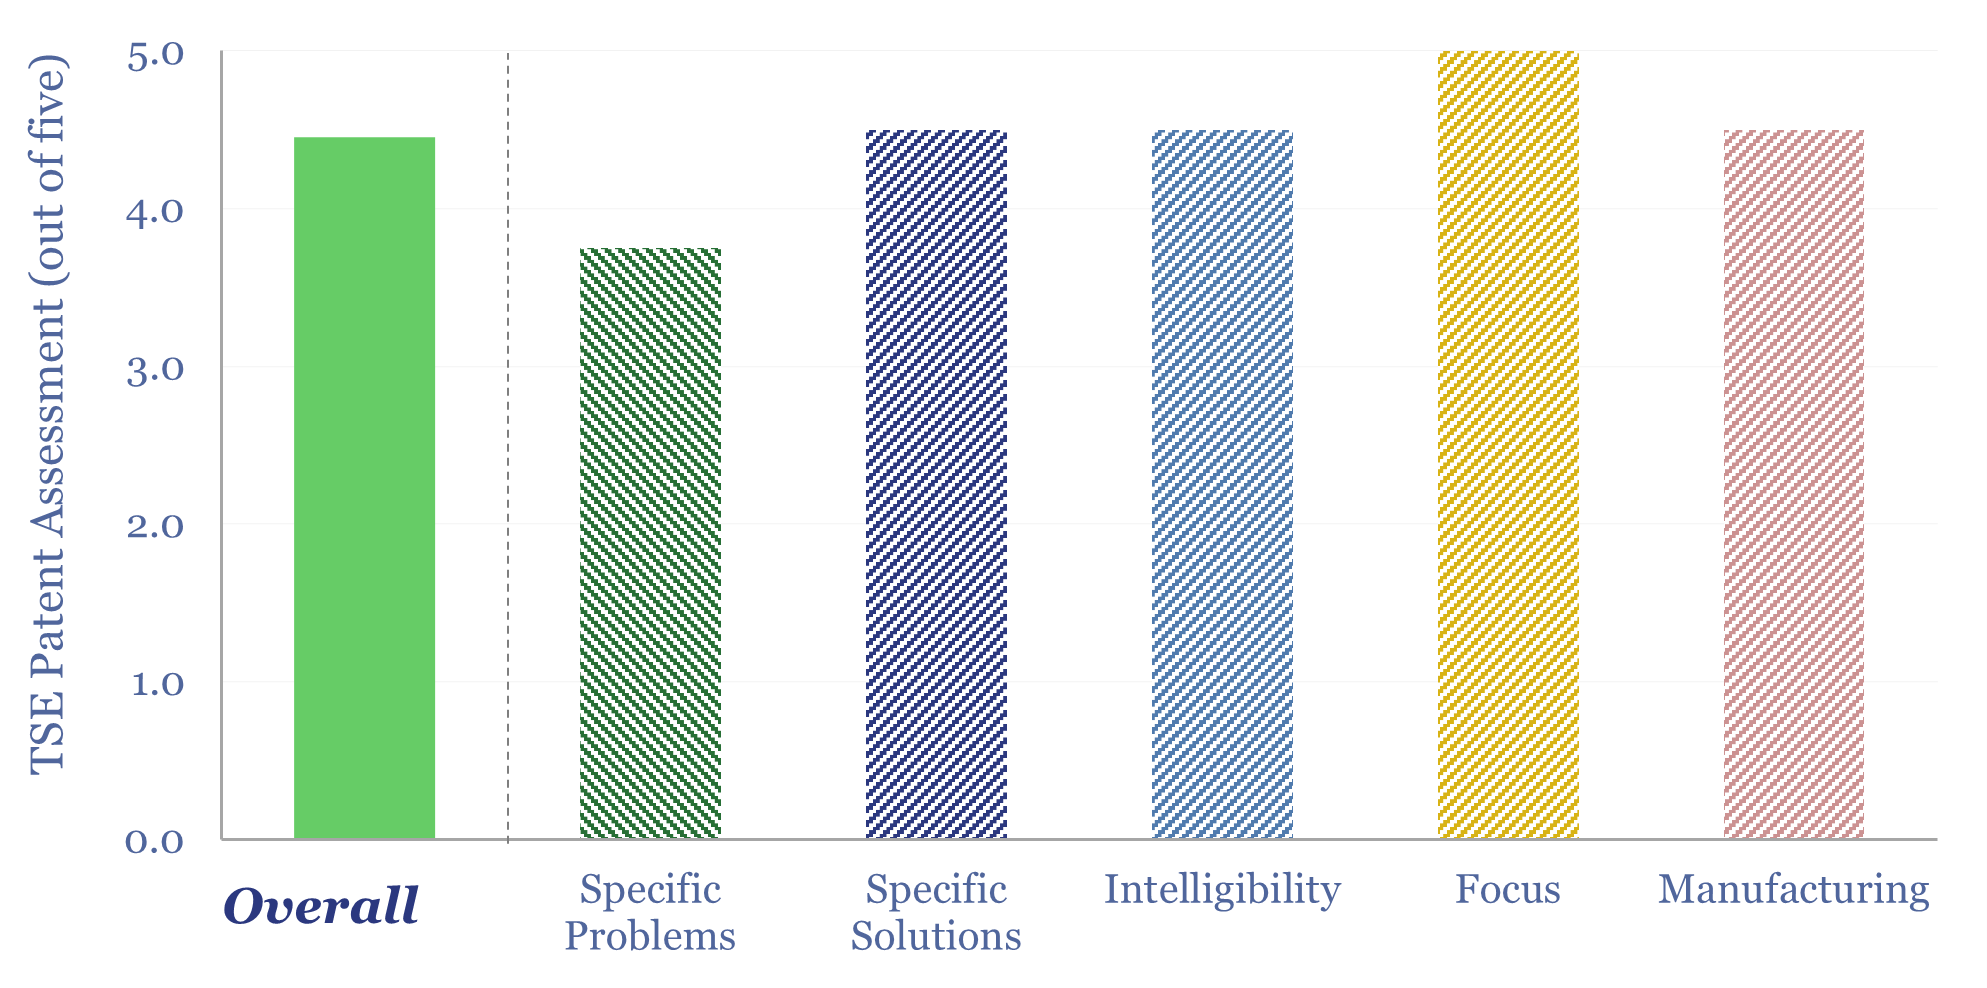
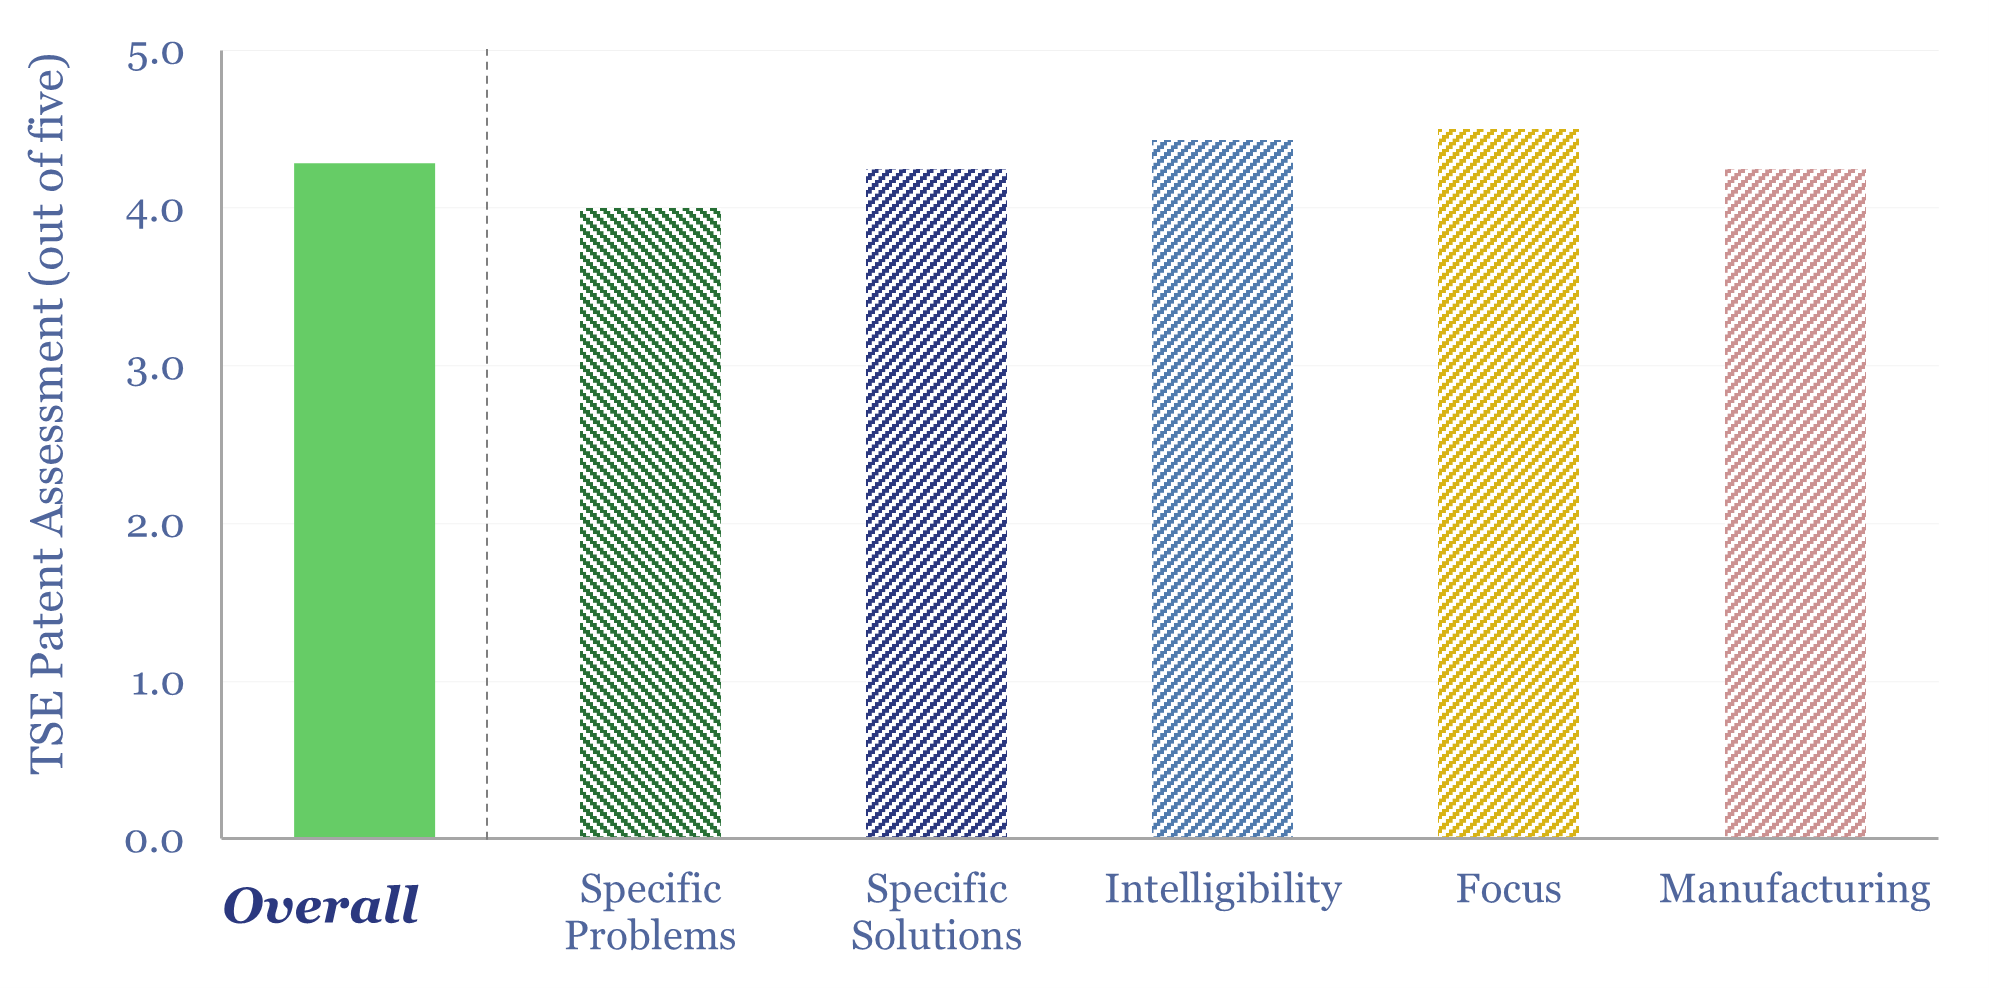
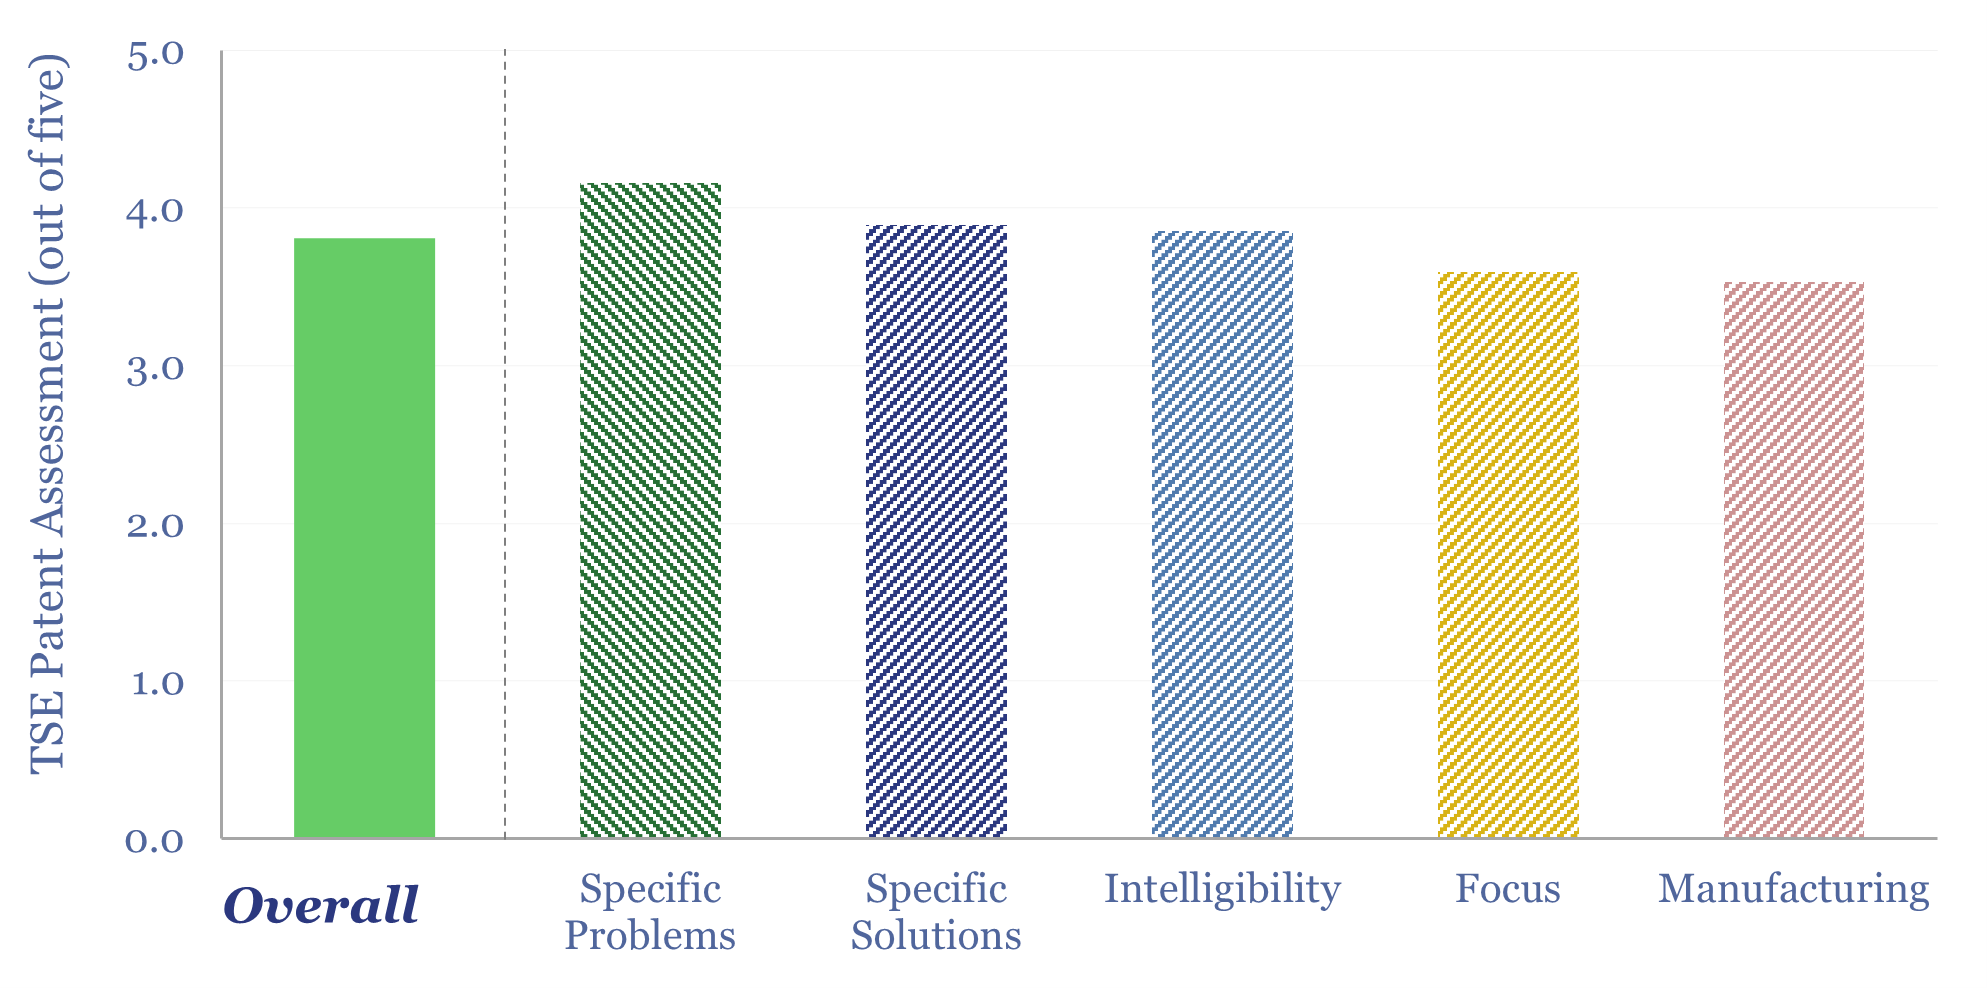
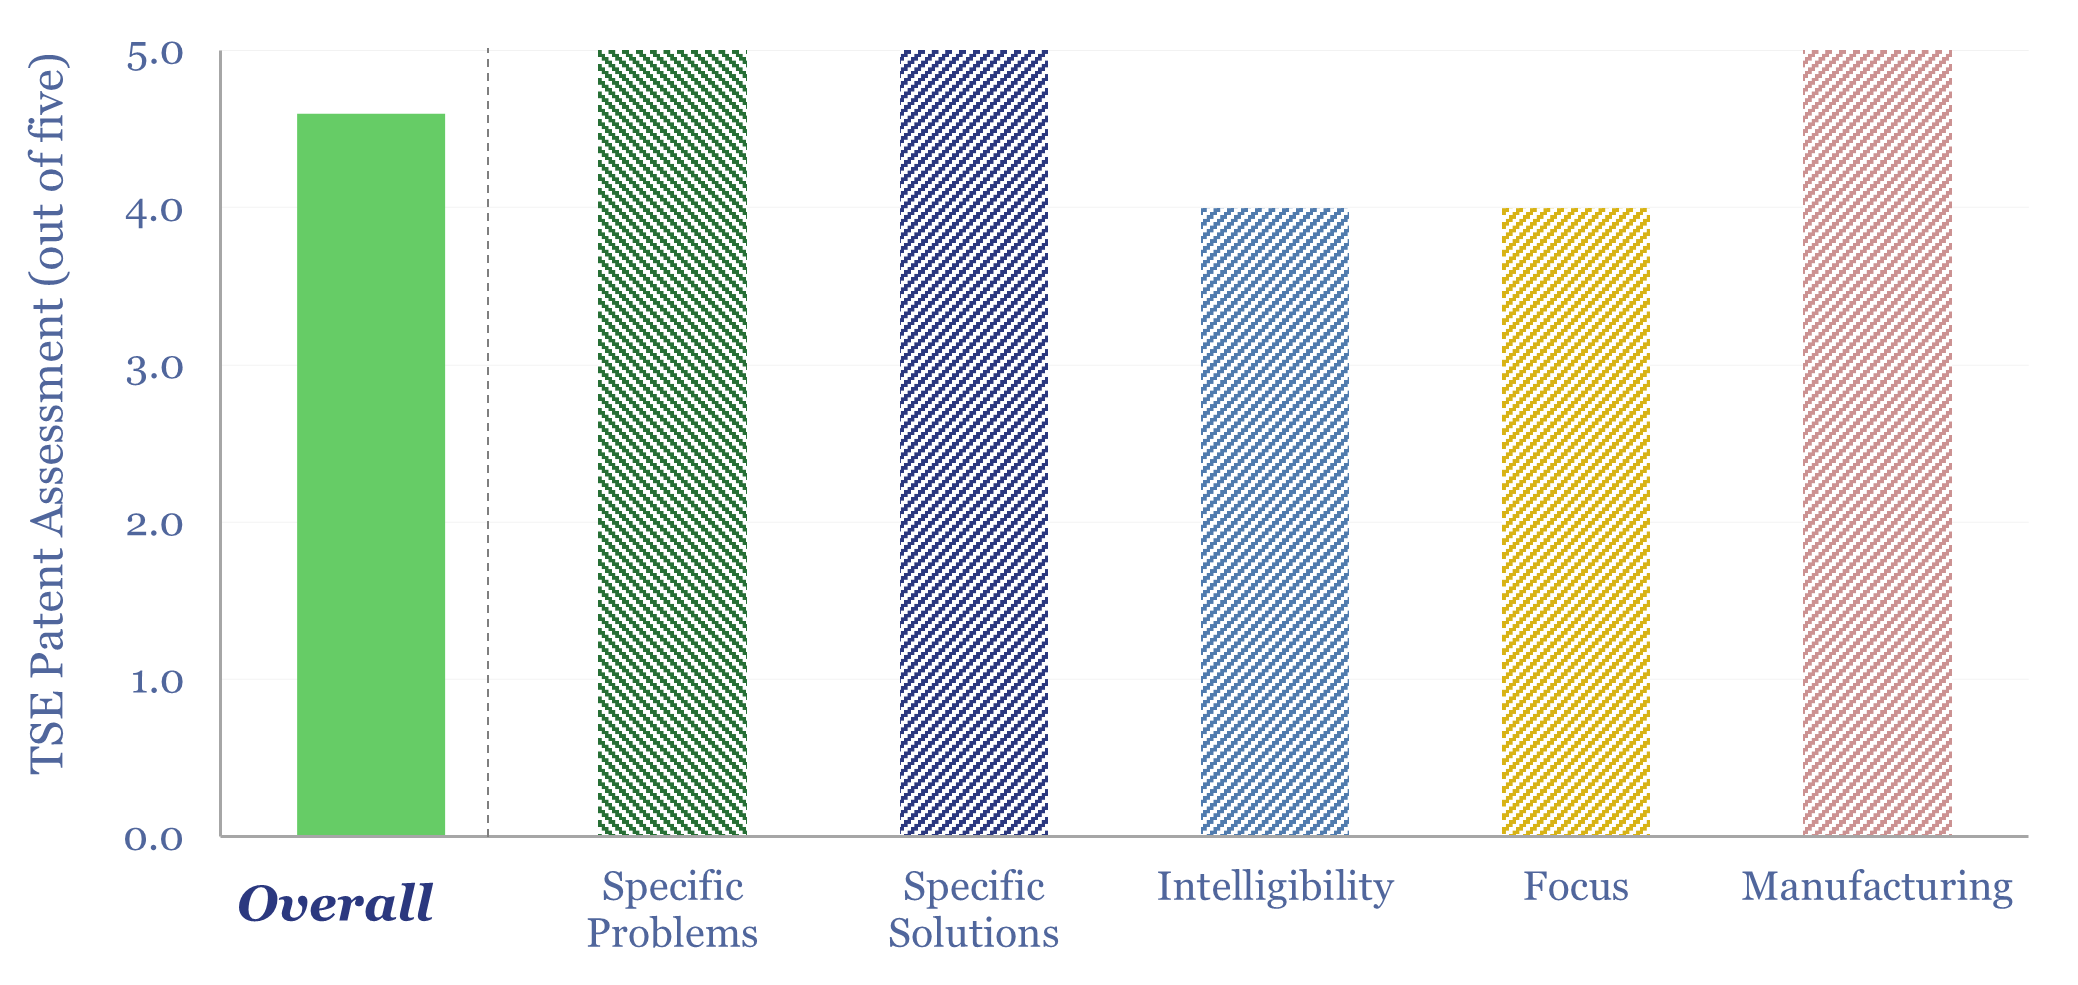
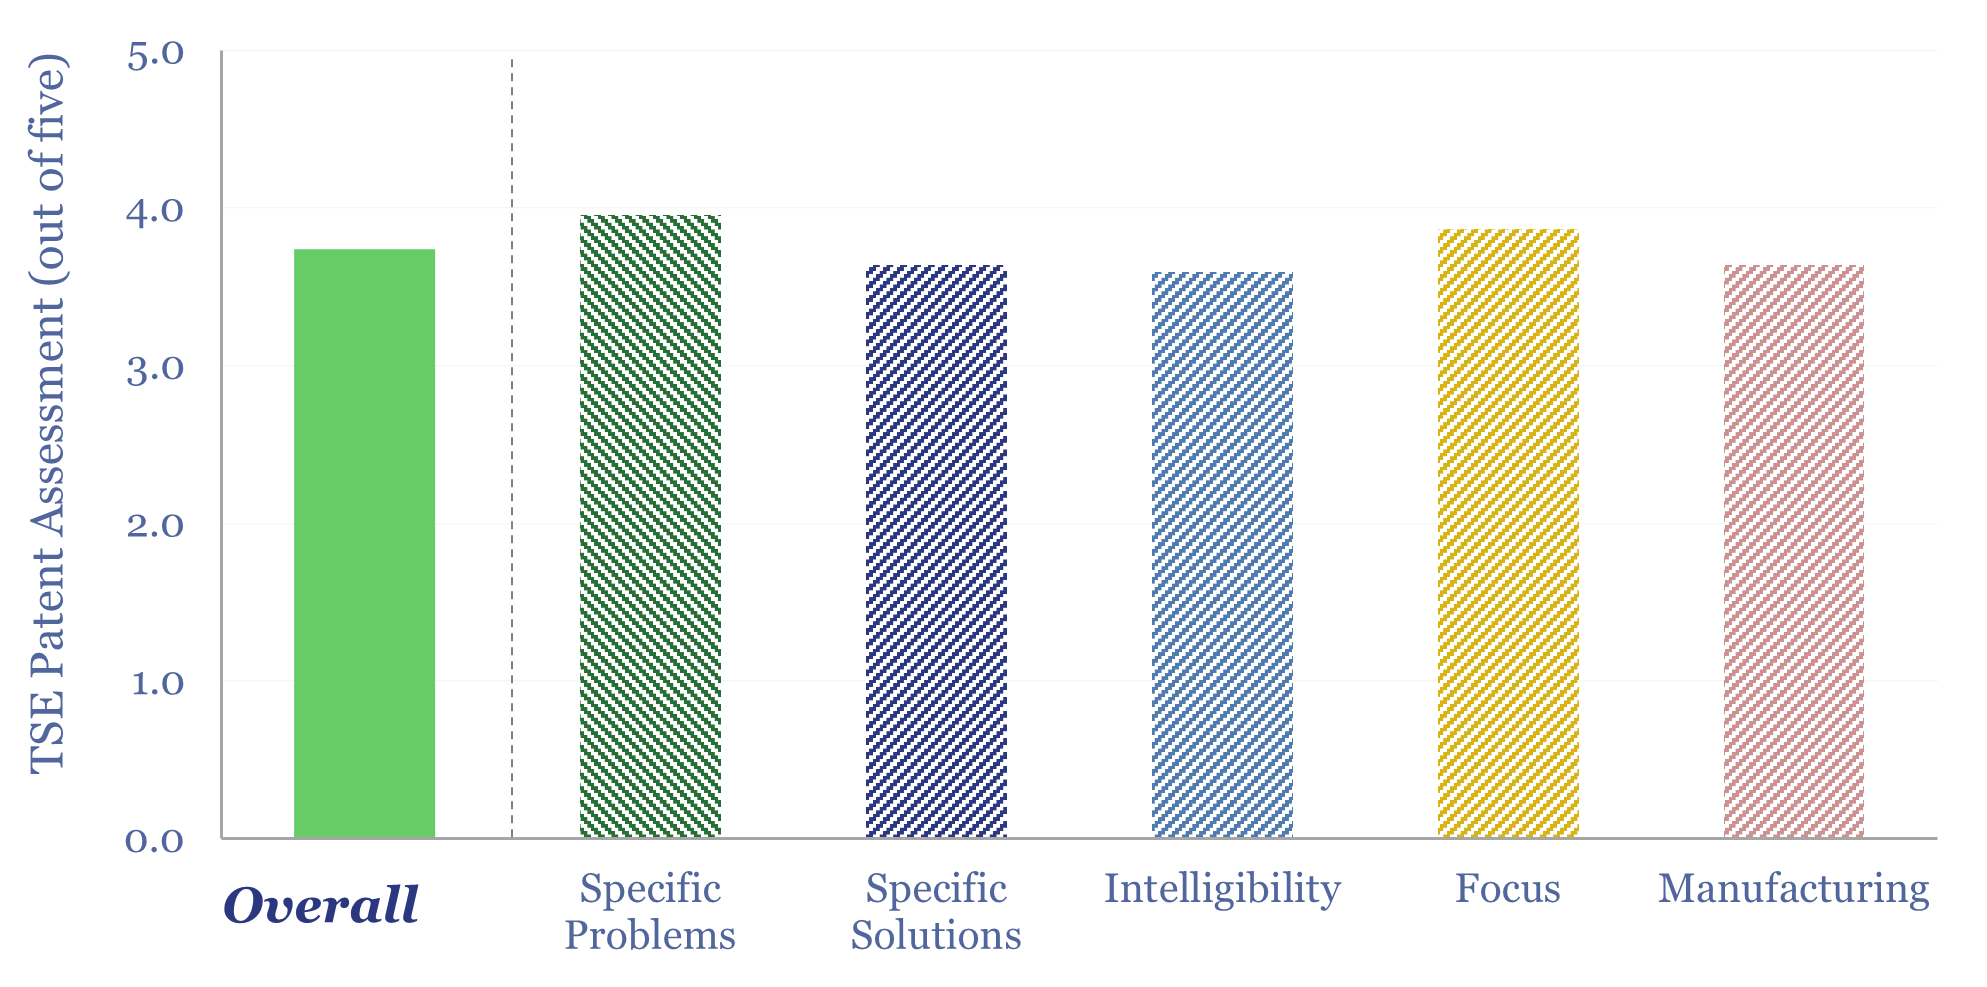
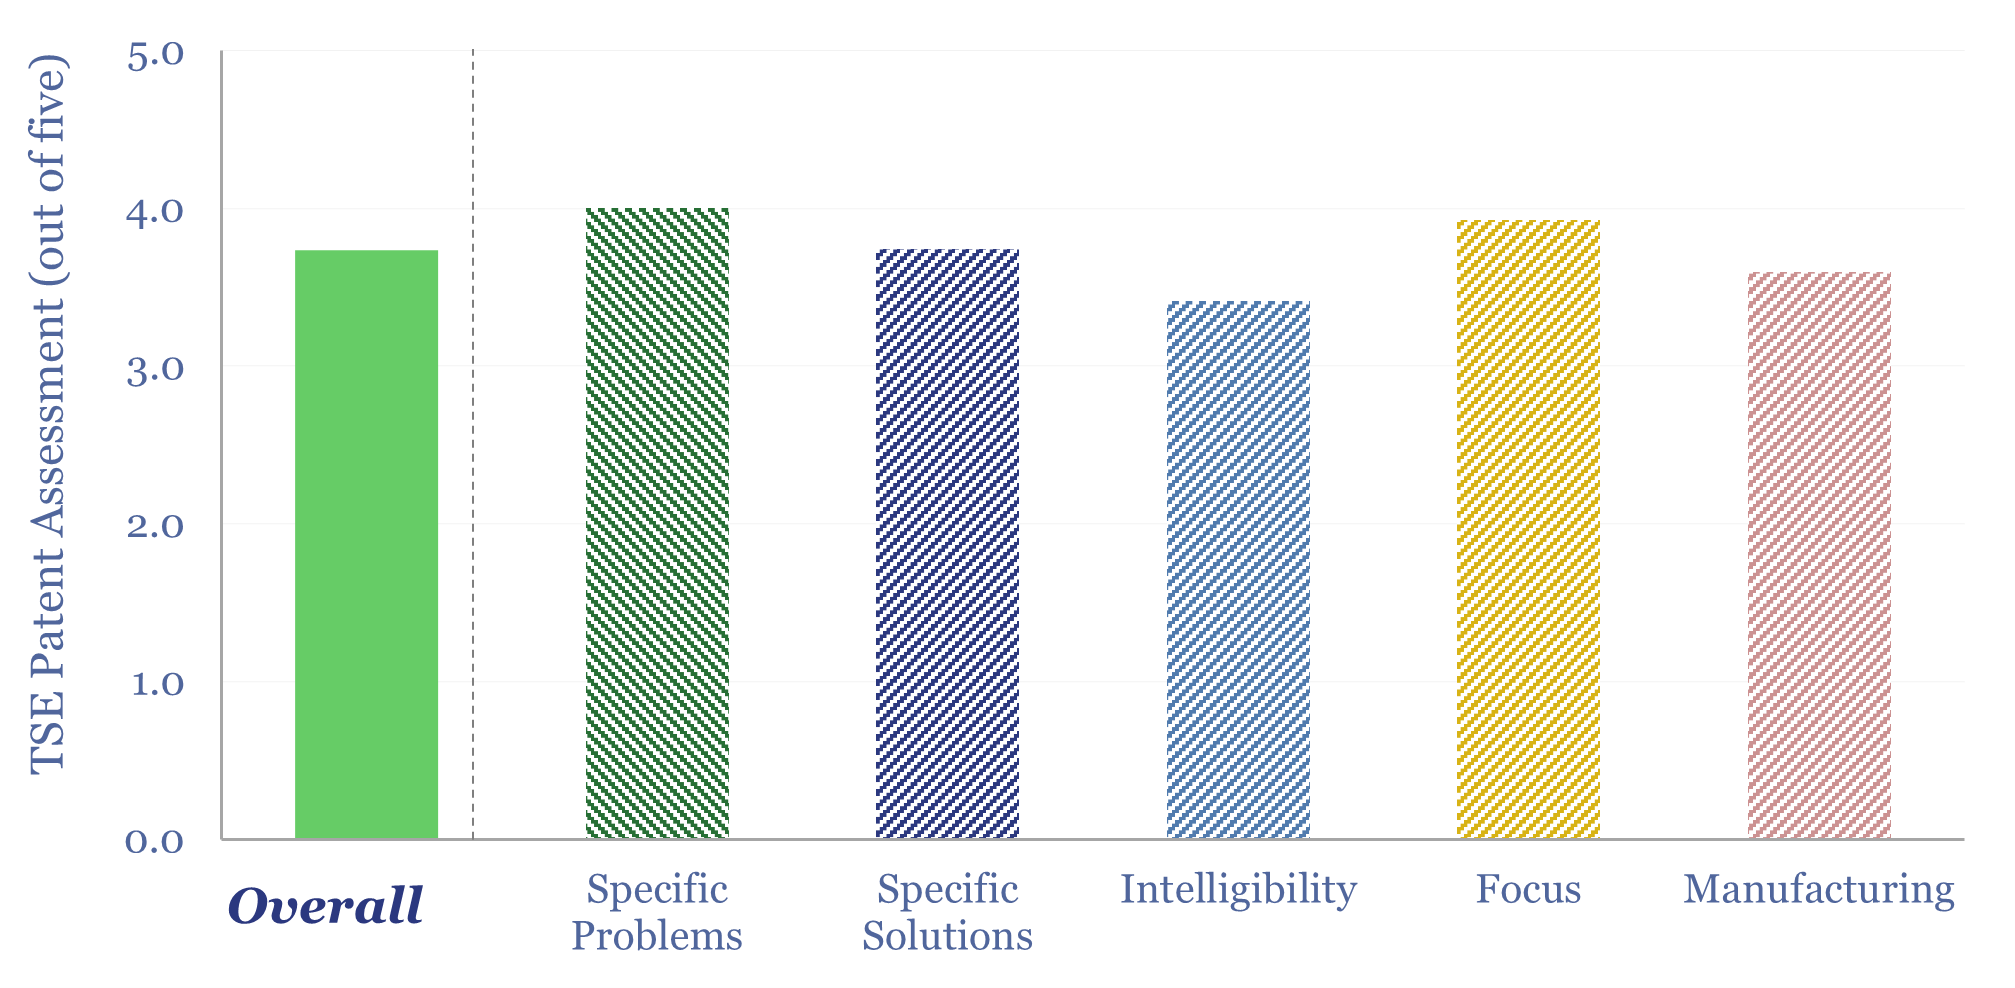
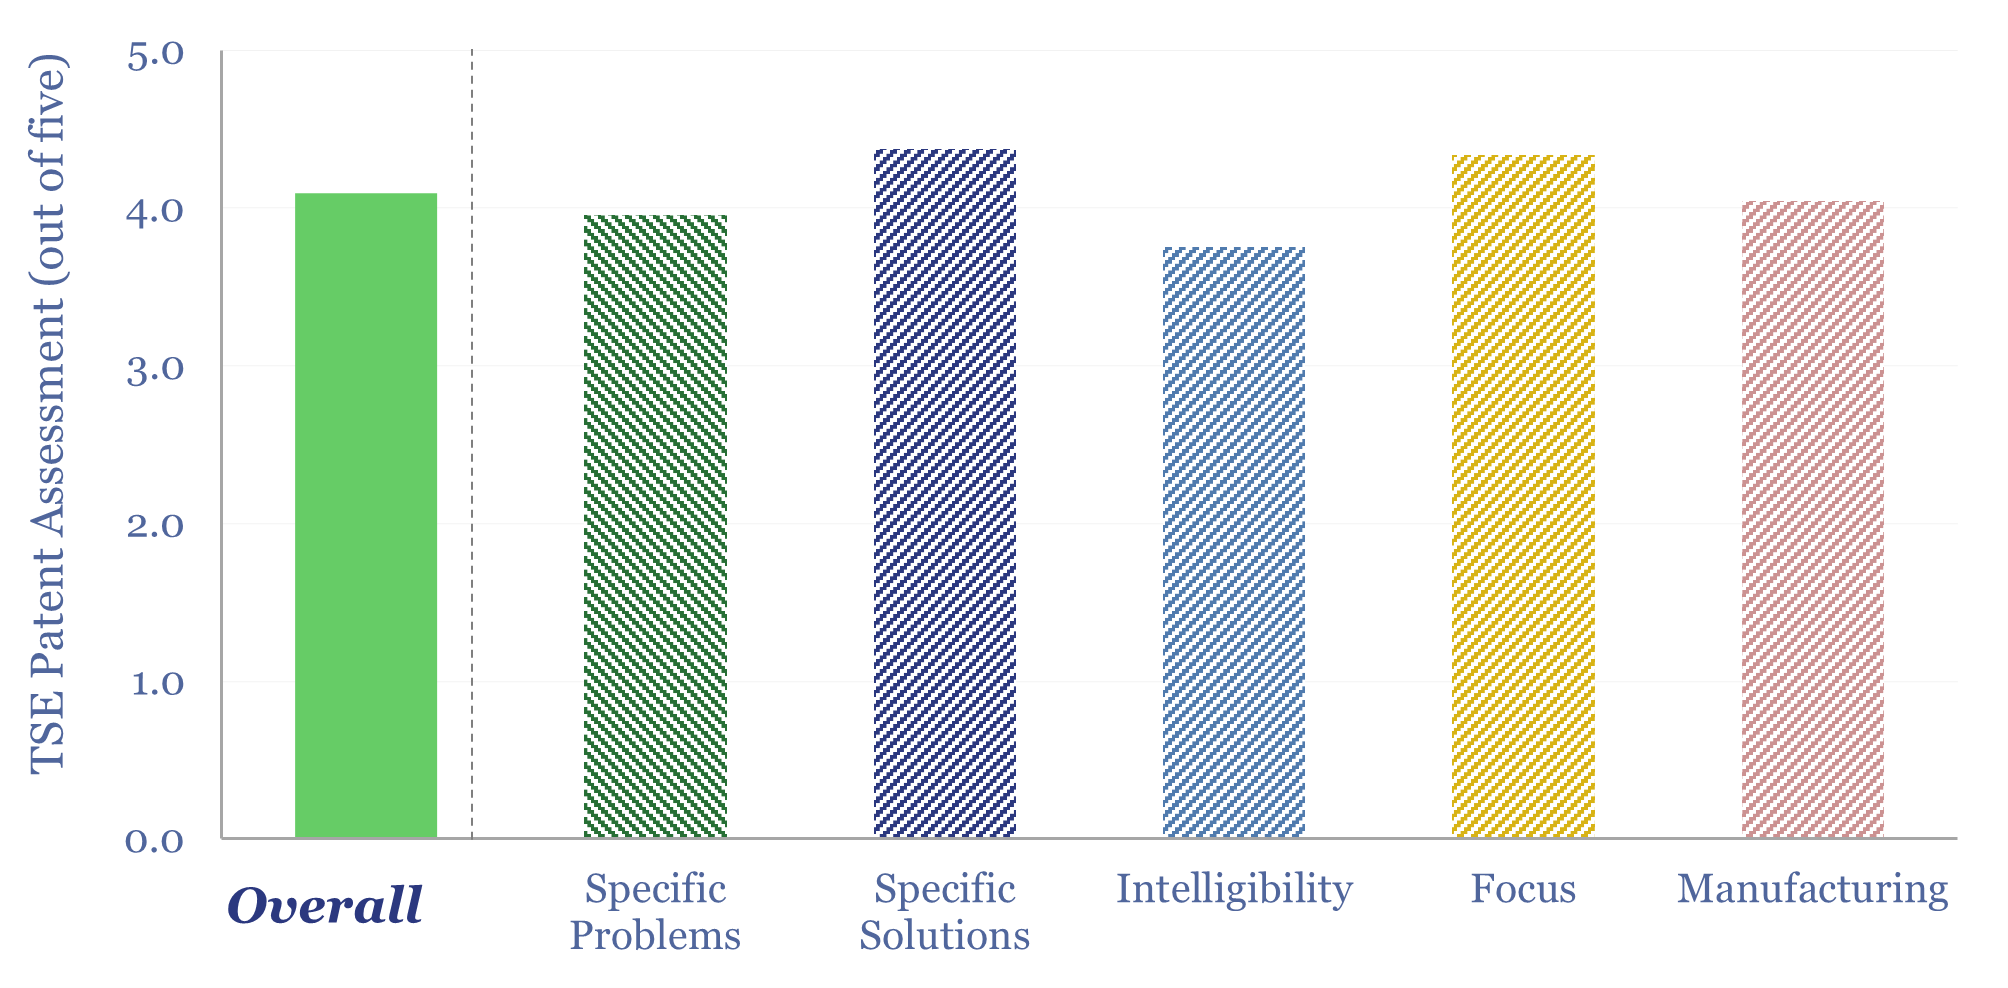
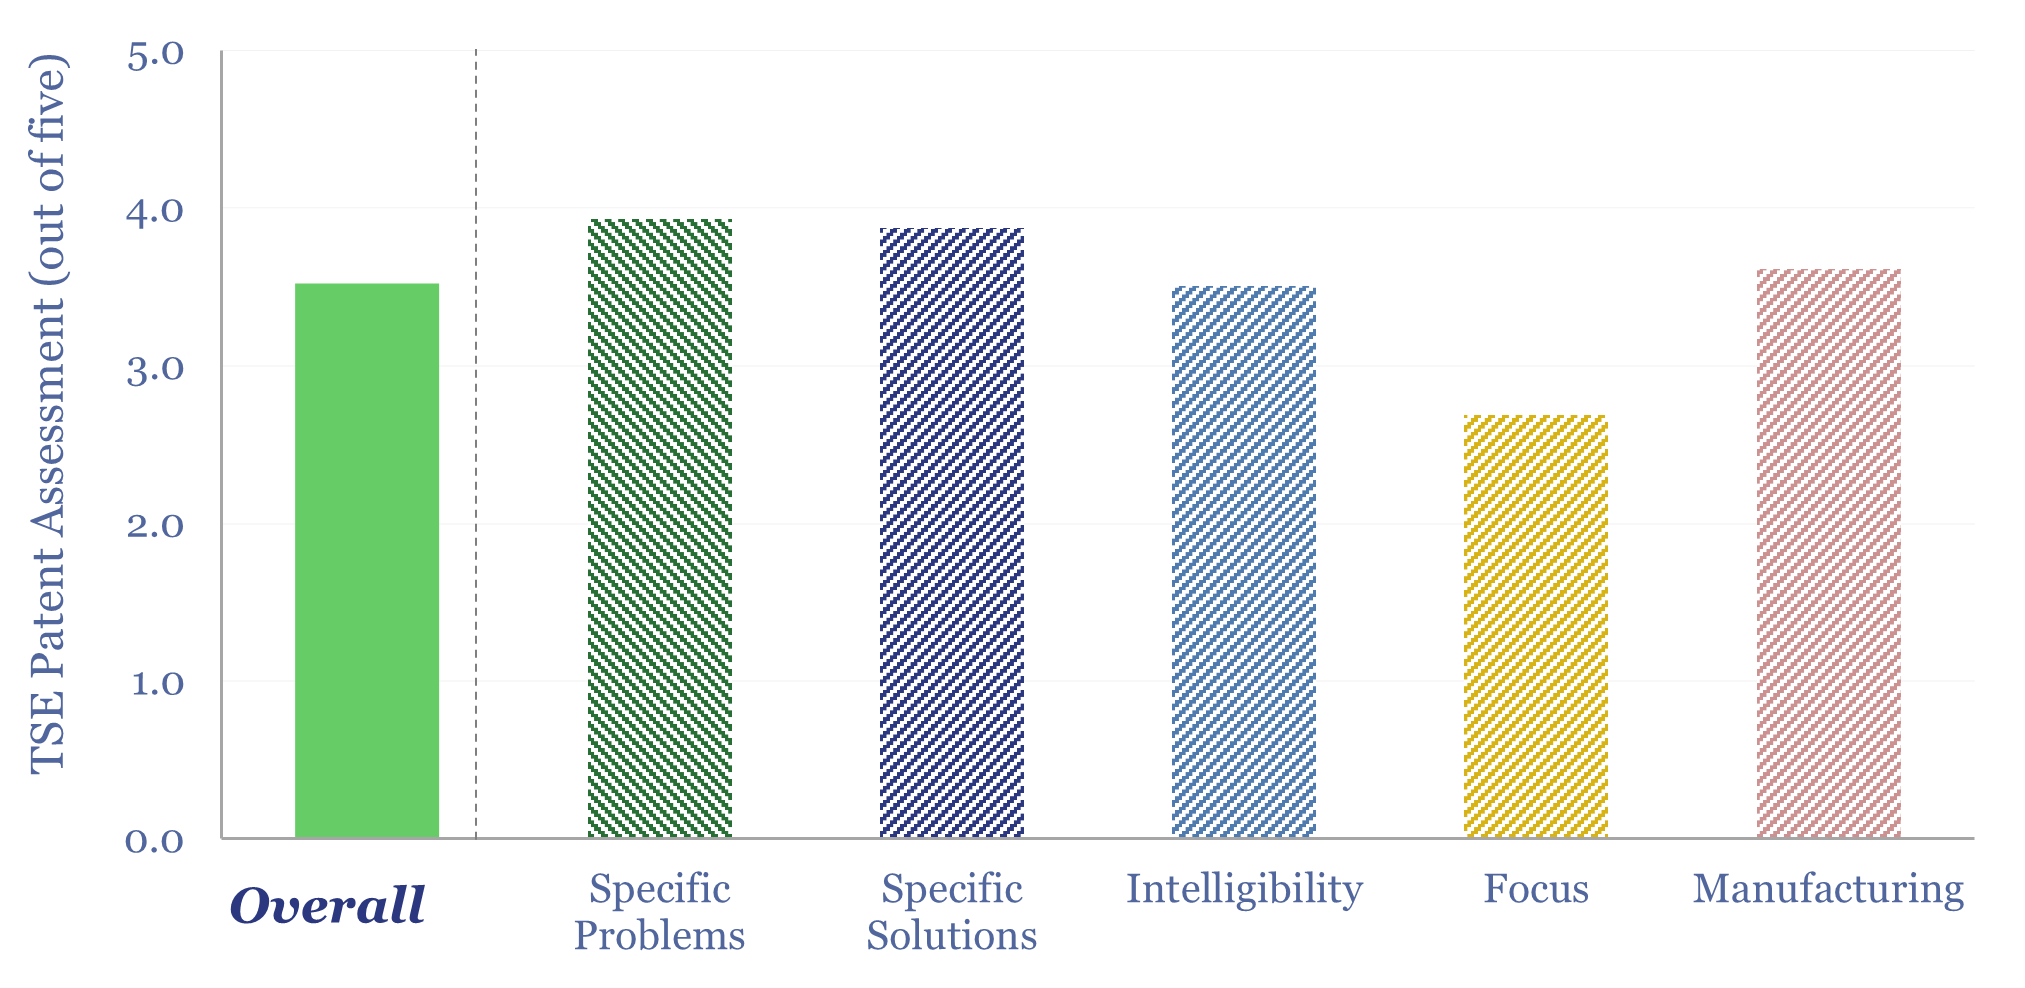
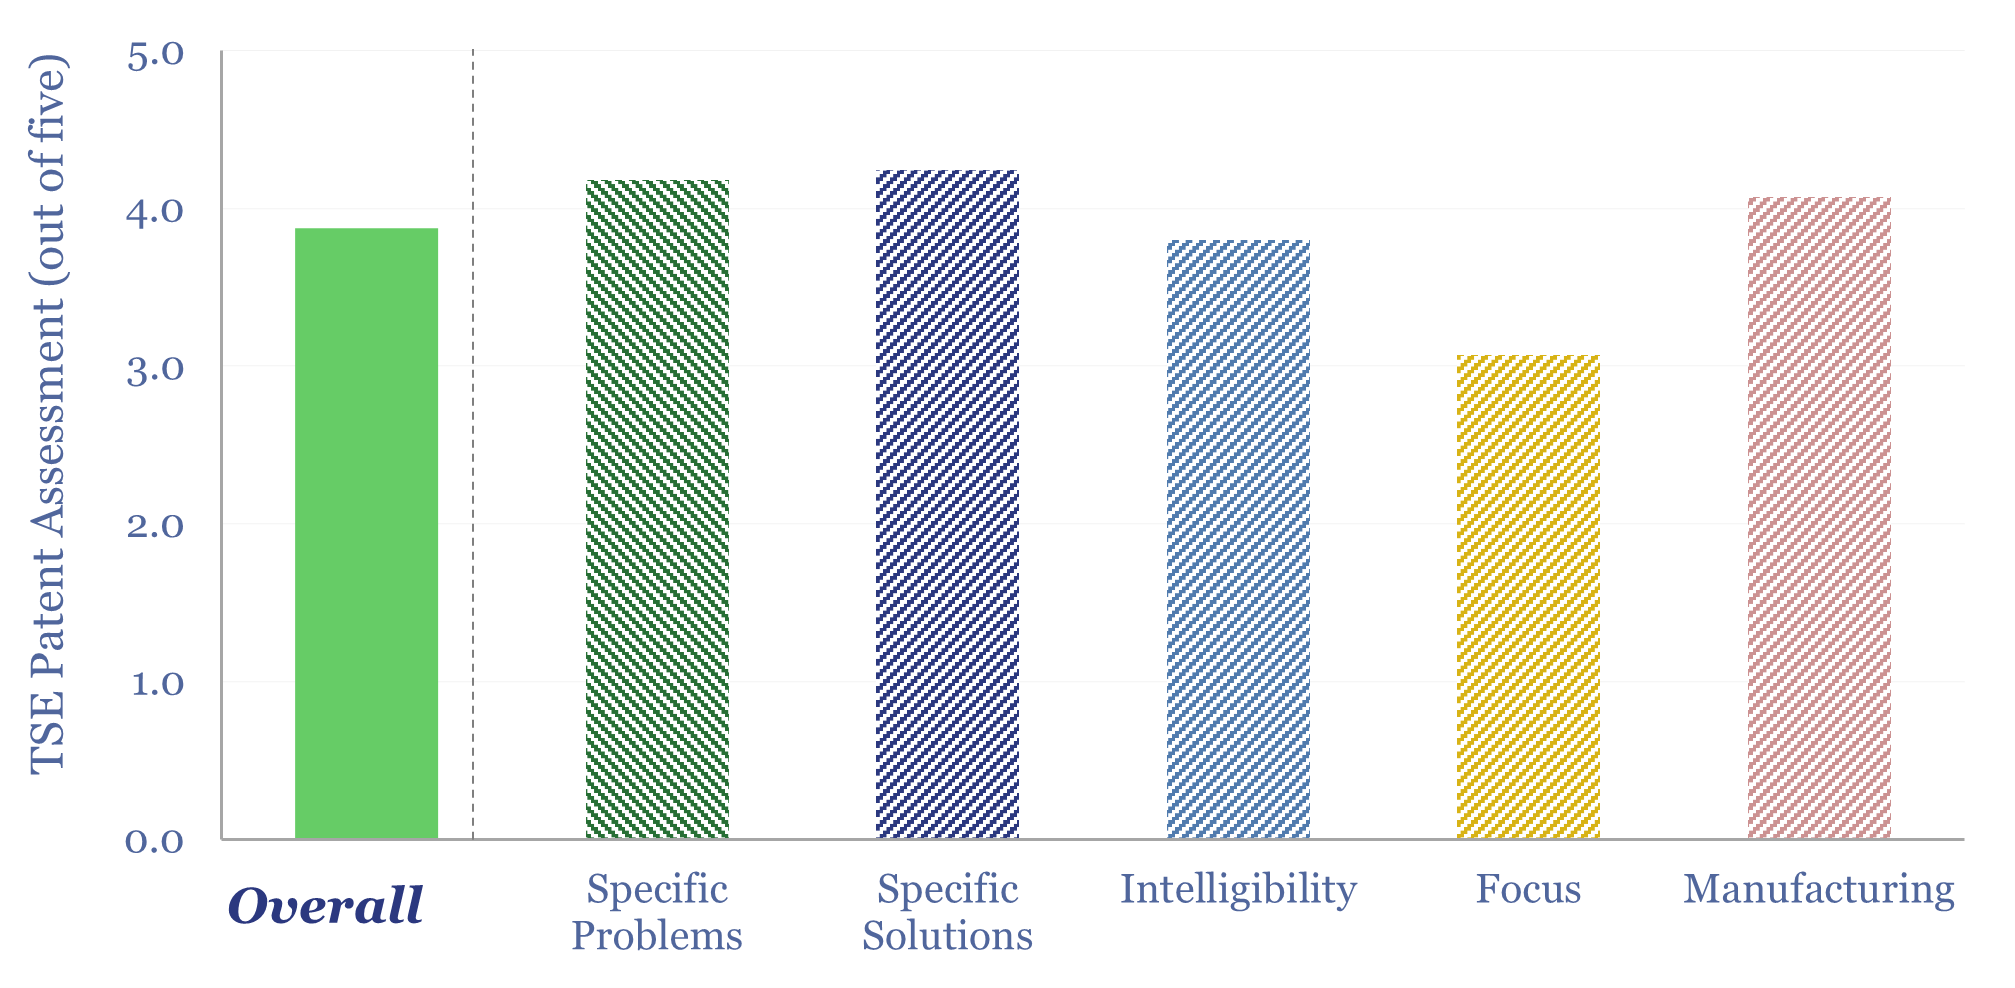
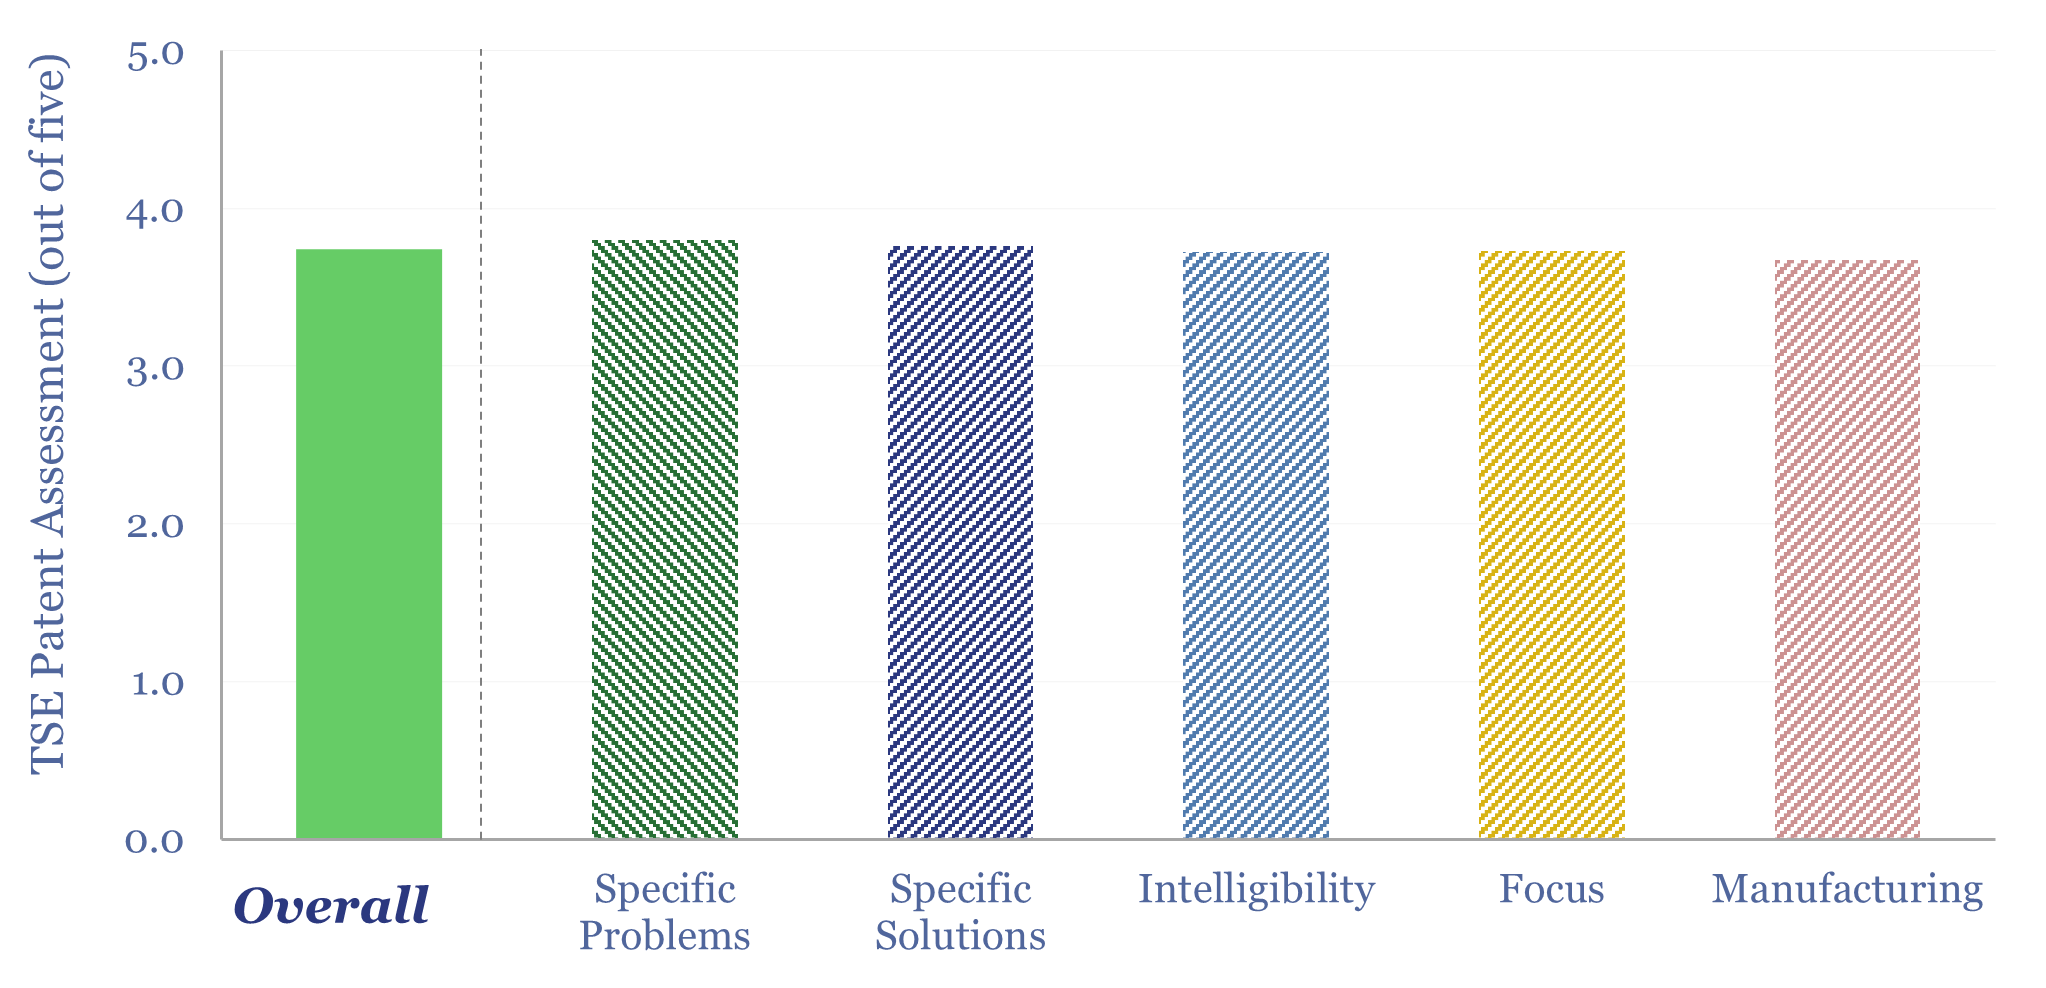
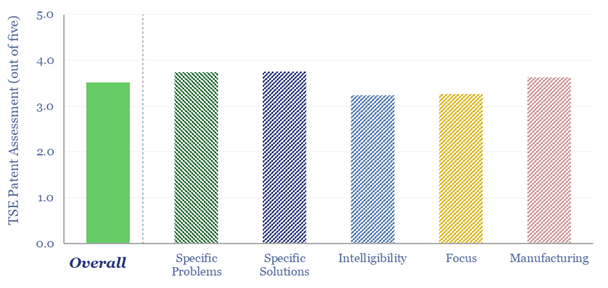
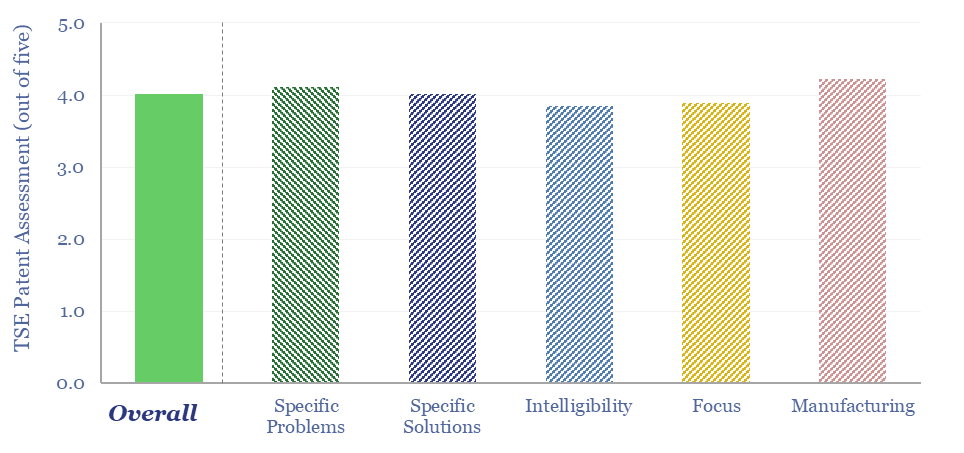
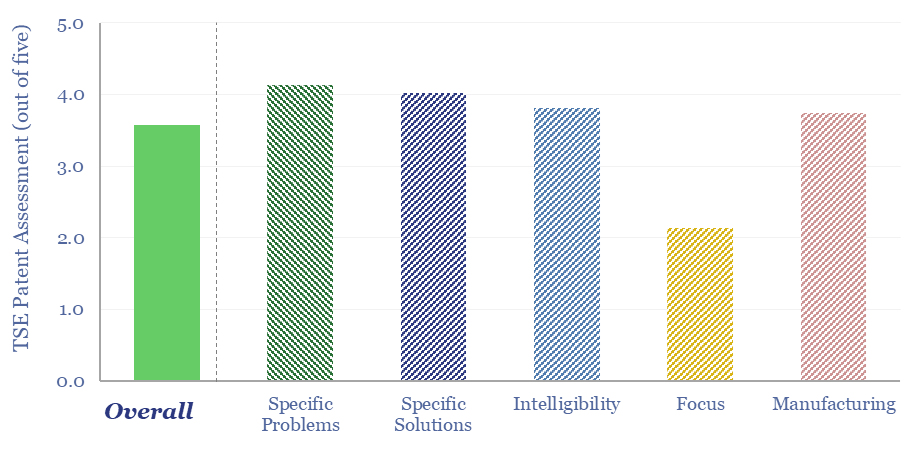
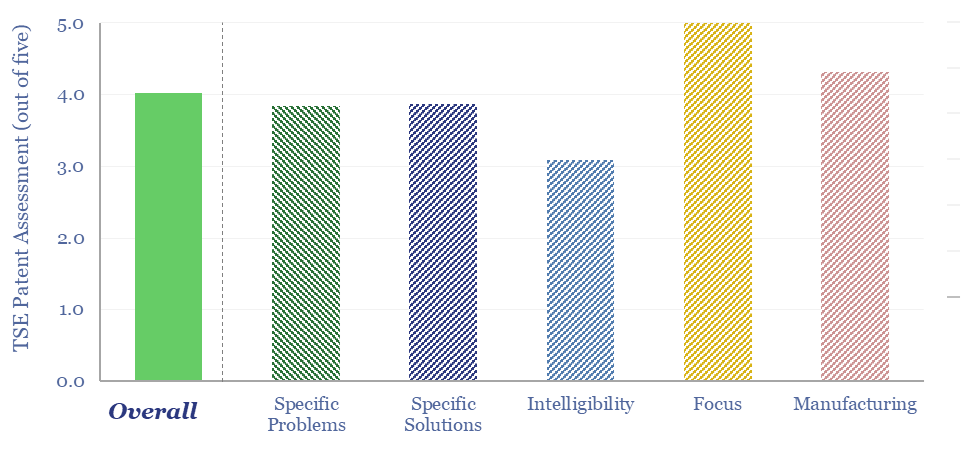
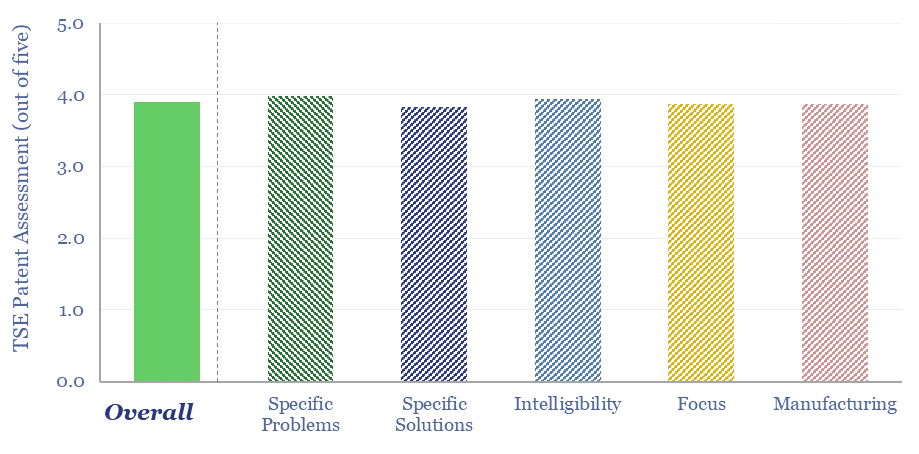
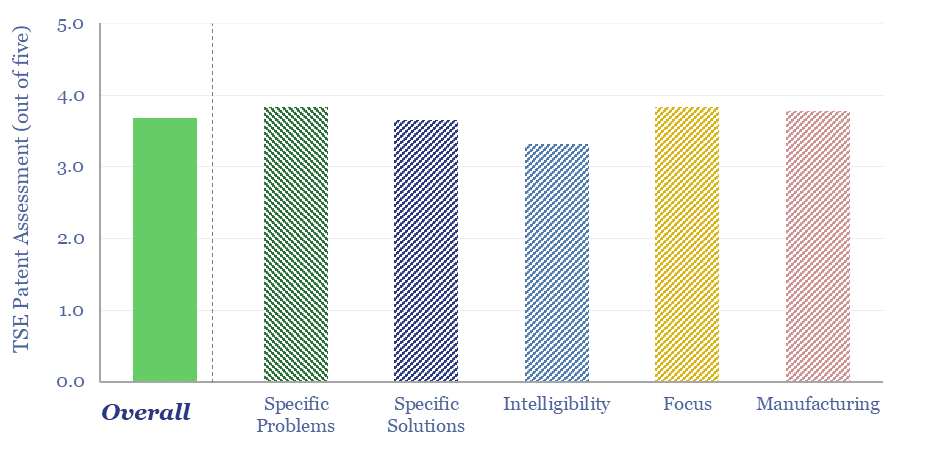
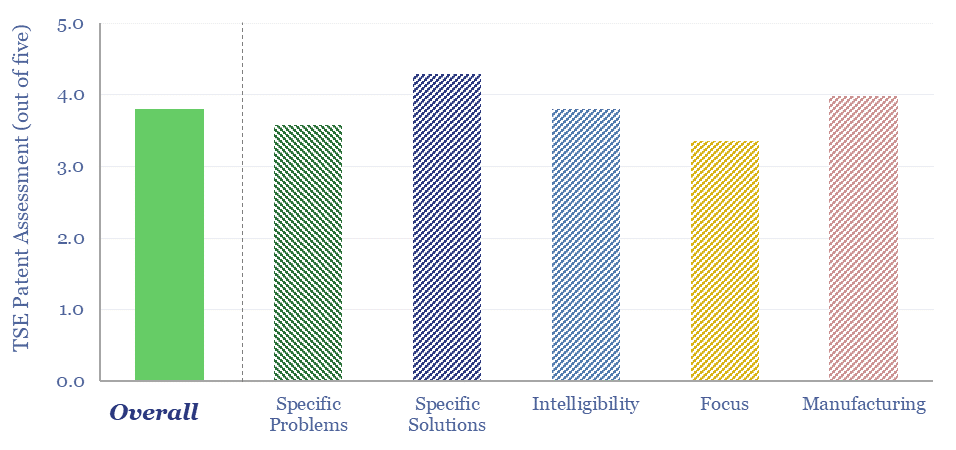
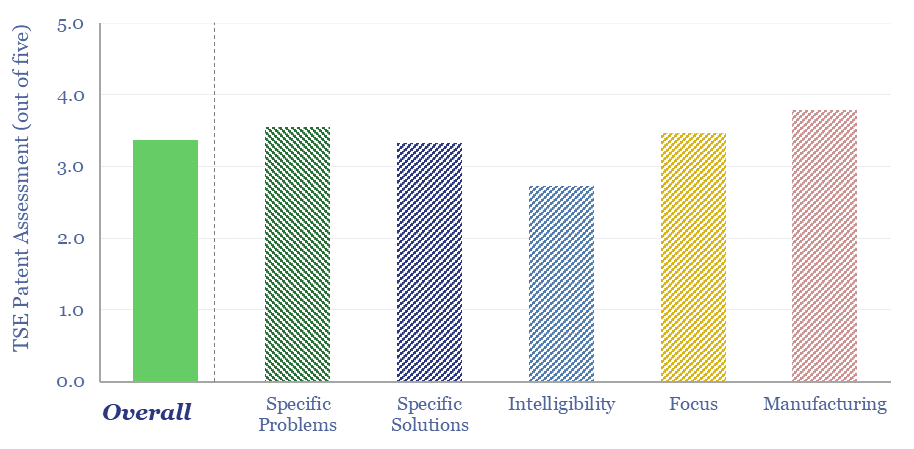
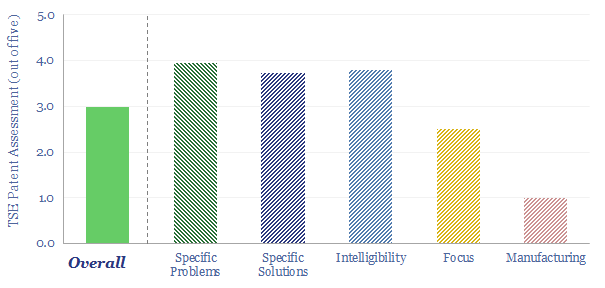
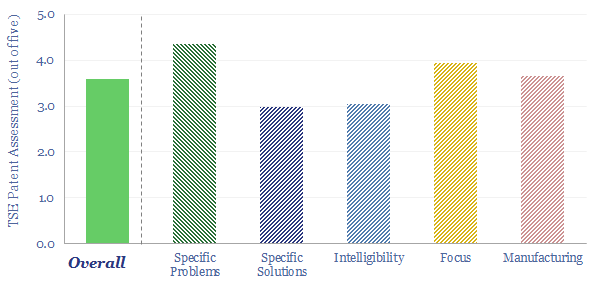
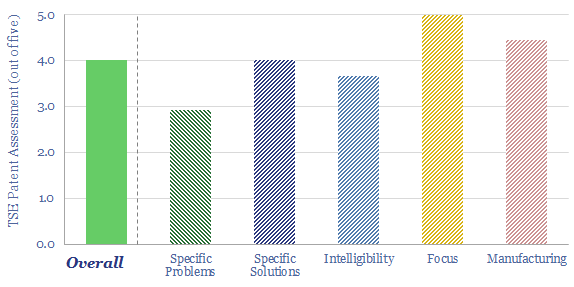
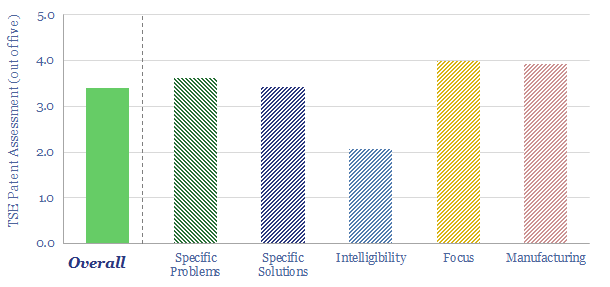
This data-file aggregates all of our patent assessments into a single reference file, so different companies’ scores can be compared and contrasted. Our average score is 3.5 out of 5.0. Skew is to the downside. Intelligibility is the biggest challenge. Scores correlate with TRL and revenues.
Download the Patent Screen?
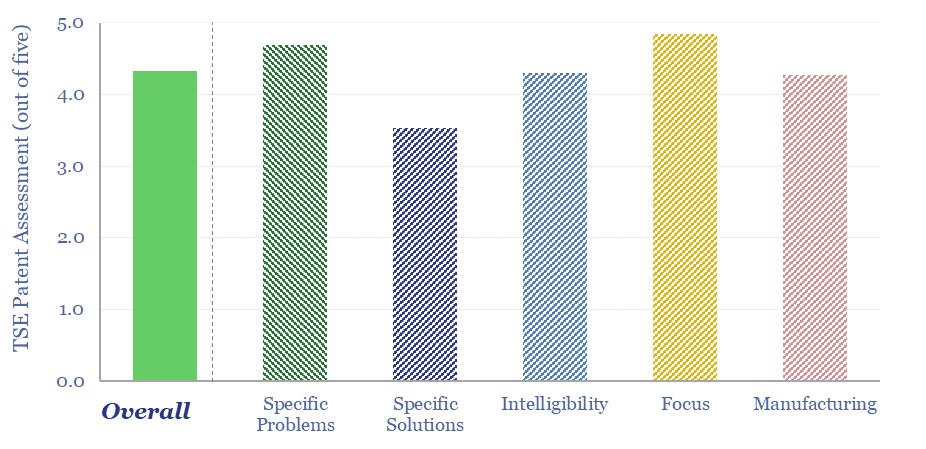
Details of Zipline drone delivery technology are derived in this data-file, based on reviewing over 15 highly detailed patent families from the company. We see a moat around specific hardware innovations, a low cost sensor suite, inherent safety from seven layers of safety protections, and a sophisticated fleet management system.
Download the Patent Screen?
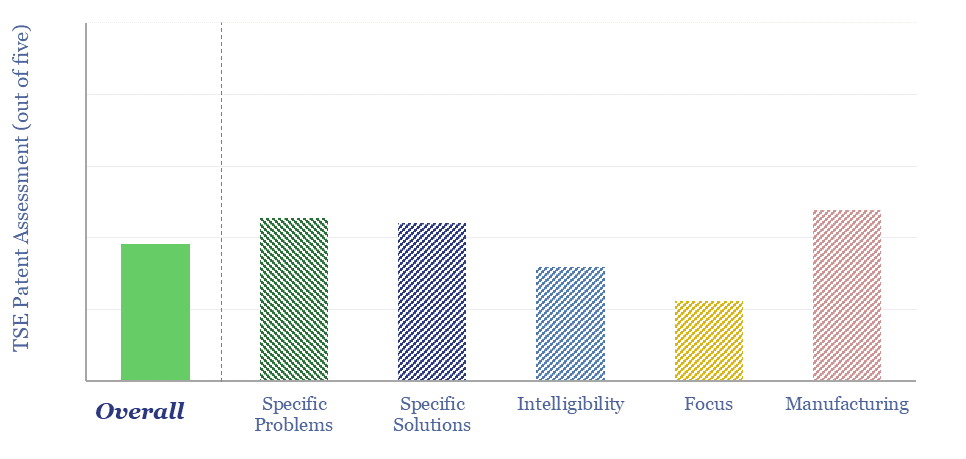
Contemporary Amperex Technology Co. Limited (CATL) is a Chinese battery manufacturer, HQ’d in Fusian, founded in 2011, with >30,000 employees. It may produce as many as one-third of all the lithium ion batteries in the world. This data-file assesses whether it has made a breakthrough in sodium ion batteries.
Download the Patent Screen?
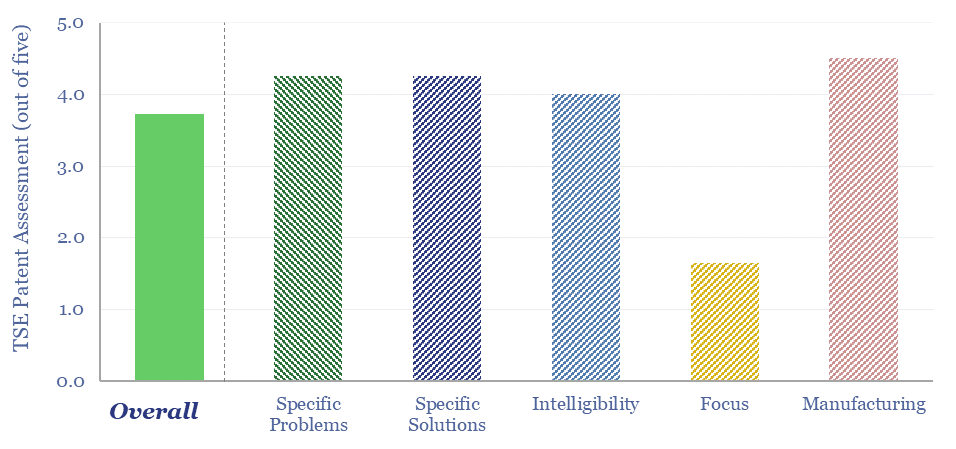
Fervo Energy is a leader in enhanced geothermal systems, harvesting 400°F+ heat from hot, deep rock formations, as fluids flow from fracced horizontal injectors to fracced horizontal producers. This Fervo Energy technology review is based on reviewing a dozen patent families. Fervo draws on fiber optic sensing data to optimize the well completion process and maximize heat rates.
Download the Patent Screen?
We have screened 65 Schlumberger AI and machine learning patents, filed in 2024-25. This is more than any other energy company. We expect AI to improve shale well productivity, entrench the reliance on Schlumberger tools and services, while also reducing costs, labor, time and net energy use in oil and gas.
Download the Patent Screen?
Aixtron has a market leading position in GaN MOCVD technology, which is increasingly used in the power electronics of data centers, solar and EVs. This data-file assesses 20 patents from Aixtron and Veeco, to unpack how GaN MOCVD works, what are the key challenges, and to quantify Aixtron’s potential moat.
Download the Patent Screen?
Enphase is a global leader in microinverters. In 2026, it released its first GaN-based microinverter, reducing weight by 25% and volume by 35%. Specific innovations come out in the patents and suggest more radical changes lie ahead, for even more power dense microinverters based on cycloconverter topologies. But does this confer any kind of edge in developing the down-converters for larger future AI racks?
Download the Patent Screen?
ANYbotics’ quadrupedal inspection robot, ANYmal, has been ruggedized for industrial inspections. We reviewed ANYbotics’ patents and case studies, which suggest growing applications, a moat around the technology, and great upside for robots across energy, mining and manufacturing. Details and conclusions are in this data-file.
Download the Patent Screen?
Lancium data center technology is used to develop Clean Campuses, which can separate large compute requirements into critical and flexible clusters. The flexible clusters tackle non-time critical loads, often powered directly by microgrids, and providing a Controllable Load Resource, which can demand shift to smooth the volatility of renewables? Hence we reviewed Lancium’s patents.
Download the Patent Screen?
Rockwell Automation is the largest pure-play automation company in the world. It integrates real-time data and controls thousands of components across typical industrial facilities, often saving energy, costs and raising throughputs. This data-file reviews its product offering, case studies and IoT and automation acronyms.
Download the Patent Screen?
What do the instrumentation and controls, deployed by companies like Emerson, actually do? And will the rise of AI accelerate their deployment? We have tried to answer these questions by reviewing 30 case studies from Emerson’s product suite. This highlights an end-to-end offering to gather vast quantities of data from, and then optimize industrial assets.
Download the Patent Screen?
Deep Fission is designing a next-generation nuclear reactor, placing small modular reactors in 1-mile-deep boreholes, which provide exceptional containment, and may eliminate up to 80% of the surface costs of large nuclear plants. We find strong inherent safety features and can de-risk c50% lower costs than large fission reactors via the Deep Fission technology.
Download the Patent Screen?
Gecko Robotics is a leader in AI+Robotics (AIR), which can save tens of millions of dollars per year, when autonomous asset inspections are used to eliminate down-time and optimize maintenance operations. The company has already reached $1.25bn of valuation. The value hinges on the marriage of specialized hardware with an AI platform. This holds lessons for the future of robotics and across the industrial world?
Download the Patent Screen?
Rare Earth recycling may recover Rare Earths at 50% lower costs and with over 90% less energy and CO2 than primary production, as long as the recycling process is simple, and only requires a small quantity of readily available commodity chemicals. This is exemplified by patents from REEcycle, which can recover over 90% of the Rare Earths in scrap magnets with over 99% purity.
Download the Patent Screen?
VoltaGrid has become the largest provider of mobile, natural gas reciprocating engines in the US, reaching GW-scale in 2025, in order to rapidly energize data centers, e-frac operations in shale, and other micro-grids in mining and industry amidst power grid bottlenecks. This data-file reviewed VoltaGrid’s mobile micro-grid technology and patents.
Download the Patent Screen?
Itron is a US-leader in smart energy meters and smart energy networks. Once you have these smart meters widely deployed across the electricity network, you can start to do really interesting things. This data-file gathers concrete examples of Itron’s smart energy network technology, based on reviewing 15 patents.
Download the Patent Screen?
Cognex machine vision technology is used to ID products, inspect products, guide robotics and gauge sizes. This data-file reviews 20 case studies, with payback periods typically below 1-year. Increasing capabilities of AI are already extending use cases for these systems. We conclude this trend will continue, and also unlock more demand for industrial robots.
Download the Patent Screen?
Water is used in heat exchangers, in data-center cooling and power plant cooling. These are interesting areas, which have featured in our research. But what opportunities to raise performance and lower water use? Ecolab water management technology monitors the composition of industrial water and then optimizes additives against scaling, fouling and corrosion. Recent patents will support the rise of AI.
Download the Patent Screen?
Exail Technologies is listed in Paris and focuses on navigational and maritime robotics. It has a range of maritime drones, with applications from mine-sweeping to assisting with offshore wind, offshore oil and gas and civil infrastructure projects in coastal waters. A key to these drones is incorporating Exail’s Inertial Navigation Systems. We have reviewed the technology.
Download the Patent Screen?
Doosan Enerbility is a power plant manufacturer, headquartered in Korea, specializing in nuclear plant construction, gas plant construction, offshore wind, civil engineering and parts manuacturing. In this patent review, we assessed Doosan Enerbility gas turbine technology. We can de-risk its claims for a 43%-efficient simple-cycle turbine, 60%+ efficient CCGT, and 1,600ºC turbine inlet temperatures.
Download the Patent Screen?
Microwave Chemical is a small-cap company, developing microwave-based heating solutions, across over a dozen use cases, from acrylic recyling, to producing food/cosmetic compounds, to carbon fiber (particularly interesting!). We reviewed a dozen of the company’s patents in this data-file, which is a Microwave Chemical technology review and finds a moat in efficient microwave heating.
Download the Patent Screen?
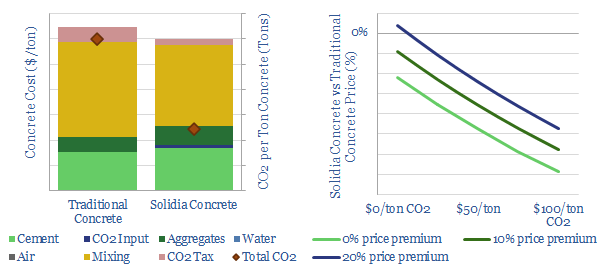
This data-file explores Leilac low-carbon cement technology, which separates the calcination stage, within an indirectly heated reactor, so that 98% pure CO2 can be gathered and sequestered, with requiring post-combustion CCS (amines). Patents from parent company, Calix, lock up the technology, with clear and intelligible details, although this also shows where the challenges are.
Download the Patent Screen?
This Smart Wires technology review finds that Static Synchronous Series Compensators (SmartValve) and dynamic line rating software (SUMO) can increase throughput along existing transmission lines by 20-100%+. The patents confer a visible moat around SmartValve and focus on improving electrical performance reducing deployment costs.
Download the Patent Screen?
Shanghai Electric gas turbine technology is contrasted against the Western gas turbine leaders in this data-file, based on reviewing 20 patents from 2021-24. Shanghai Electric is clearly trying to compete in this space, and the patent review uncovered interesting details into turbine temperatures, efficiencies, reliability, AI+sensing and manufacturing costs.
Download the Patent Screen?
Howmet is an engineered metals company, and the world’s #1 supplier of blades and vanes for jet engines and gas turbines. It has claimed an edge in direct-casting cooling channels (rather than drilling them) and bond coats that improve the adherence of Thermal Barrier Coatings. Our Howmet gas turbine technology review found support for these claims, via reviewing a dozen patents.
Download the Patent Screen?
Kraken Technologies is an operating system, harnessing big data across the power value chain, from asset optimization, to grid balancing, to utility customer services. We reviewed ten patents, which all harness big data, of which 65% optimize aspects of the grid, and 40% are using AI. This supports the deployment of distributed energy, renewables and EVs.
Download the Patent Screen?
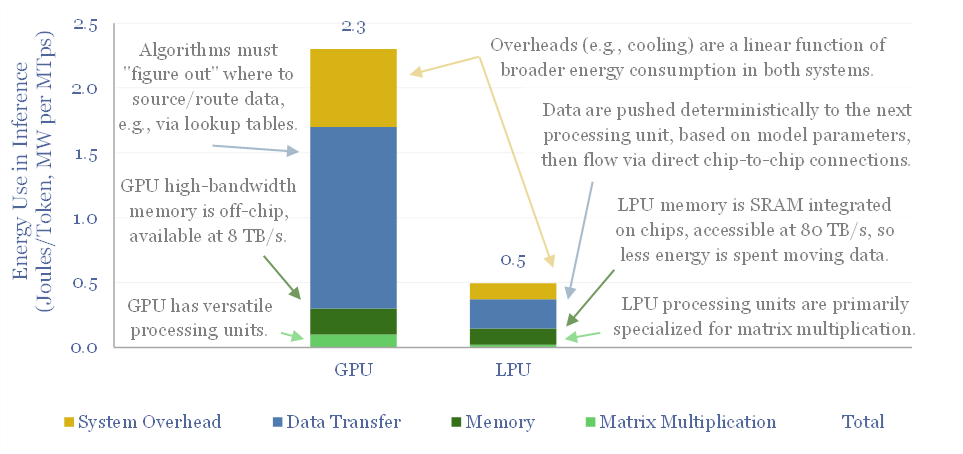
Groq has developed LPUs for AI inference, which are up to 10x faster and 80-90% more energy efficient than today’s GPUs. This 8-page Groq technology review assesses its patent moat, LPU costs, implications for our AI energy models, and whether Groq could ever dethrone NVIDIA’s GPUs?
Download the Patent Screen?
Bi-Directional Bipolar Junction Transistors are an emerging category of semiconductor-based switching device, that can achieve lower on-state voltage drops than MOSFETs and softer, faster switching than IGBTs, to improve efficiency and lower component count in bi-directional power converters. This data-file screens B-TRAN patents from Ideal Power.
Download the Patent Screen?
Can we de-risk Air Products’s ammonia cracking technology in our roadmaps to net zero, which is crucial to recovering green hydrogen in regions that import green ammonia from projects such as Saudi Arabia’s NEOM. We find strong IP in Air Products’s patents. However, we still see 15-35% energy penalties and $2-3/kg of costs in ammonia cracking.
Download the Patent Screen?
This patent screen reviews Eastman’s molecular recycling technology. Specifically, Eastman is spending over $2bn, to construct 3 plants, with 380kTpa of capacity, to break down hard-to-recycle polyesters back into component monomers, with 20-80% lower CO2 intensity than virgin product. We find evidence for 30-years of fine-tuning, and can bridge to 10% IRRs if buyers pay sufficient premia for the recycled outputs.
Download the Patent Screen?
Prysmian E3X technology is a ceramic coating that can be added onto new and pre-existing power transmission cables, improving their thermal emissivity,so they heat up 30% less, have 25% lower resistive losses, and/or can carry 25% increased currents. This data-file locates the patents underpinning E3X technology, identifies the materials used, and finds a strong moat.
Download the Patent Screen?
Cemvita is a private biotech company, based in Houston, founded in 2017. It has isolated and/or engineered more than 150 microbial strains, aiming to valorize waste, convert CO2 to useful feedstocks, mine scarce metals (e.g., direct lithium extraction) and “brew” a variant of gold hydrogen from depleted hydrocarbon reservoirs. This data-file is our Cemvita Factory technology review, based on exploring its patents.
Download the Patent Screen?
Oklo is a next-generation nuclear company, based in California, recently going public via SPAC at a $850M valuation, backed by Sam Altman, of Y-Combinator and OpenAI fame. Oklo’s fast reactor technology absorbs high energy neutrons in liquid metal and targets ultimate costs of 4c/kWh. What details can we infer from assessing Oklo’s patents, and can we de-risk the technology in our roadmap to net zero?
Download the Patent Screen?
Cummins is a power technology company, listed in the US, specializing in diesel engines, underlying components, exhaust gas after-treatment, diesel power generation and pivoting towards hydrogen. We reviewed 80 patents from 2023-24. What outlook for Cummins technology and verticals in the energy transition?
Download the Patent Screen?
Is Babcock and Wilcox’s BrightLoop technology a game-changer for producing low-carbon hydrogen from solid fuels, while also releasing a pure stream of CO2 for CCS? Conclusions and deep-dive details are covered in this data-file, allowing us to guess at BrightLoop’s energy efficiency and a moat around Babcock’s reactor designs?
Download the Patent Screen?
This data-file is our LONGi technology review, based on recent patent filings. The work helps us to de-risk increasingly efficient solar modules, a growing focus on perovskite-tandem cells, and low-cost solar modules, with simple manufacturing techniques that may ultimately displace bottlenecked silver from electrical contacts. Key conclusions in the data-file.
Download the Patent Screen?
Origen Carbon Solutions is developing a novel DAC technology, producing CaO sorbent via the oxy-fuelled calcining of limestone with no net CO2 emissions. It is similar to the NET Power cycle, but adapted for a limestone kiln. The concept is very interesting. Our base case costs are $200-300/ton of CO2. This data-file contains our Origen DAC technology review.
Download the Patent Screen?
Solar encapsulants are 300-500μm thick films, protecting solar cells from moisture, dirt and degradation; electrically insulating them at 4 x 10^15 Ωcm resistivity; and yet allowing 90% light transmittance. The industry is moving away from commoditized EVA towards specialized blends of co-polymers and additives. Is there a growing moat around Mitsui Chemicals’ solar encapsulants?
Download the Patent Screen?
This data-file reviews Verdox DAC technology, optimizing polyanthraquinones and polynaphthoquinones, then depositing them on porous carbon nano-tube scaffolds. These quinones are shown to selectively adsorb CO2 when a voltage is applied, then desorb them when a reverse voltage is applied, unlocking 70% lower energy penalties than incumbent DAC?
Download the Patent Screen?
Solvay is a chemicals company with growing exposure to battery materials, especially the PVDF binders that hold together active materials in the electrodes. But also increasingly in electrolyte solvents, salts and additives. Interestingly, our patent review finds optimizations of this overall system can improve the longevity and energy density of batteries, which may also lead to consolidation across the battery supply chain?
Download the Patent Screen?
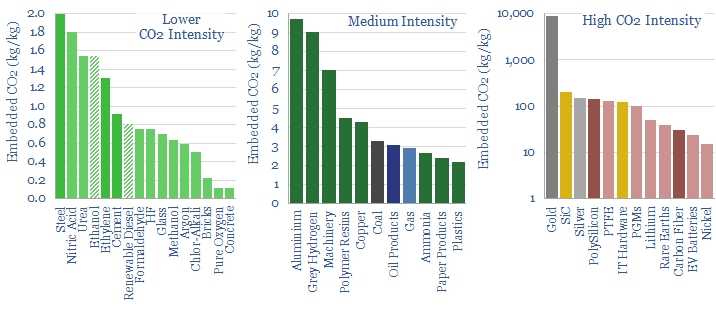
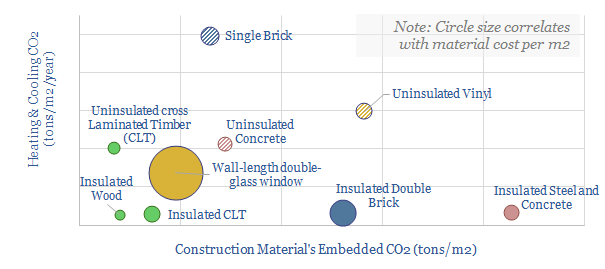
This data-file tabulates the energy intensity and CO2 intensity of materials, in tons/ton of CO2, kWh/ton of electricity and kWh/ton of total energy use per ton of material. The build-ups are based on 160 economic models that we have constructed to date, and simply intended as a helpful summary reference. Our key conclusions on CO2 intensity of materials are below.
Download the Data?
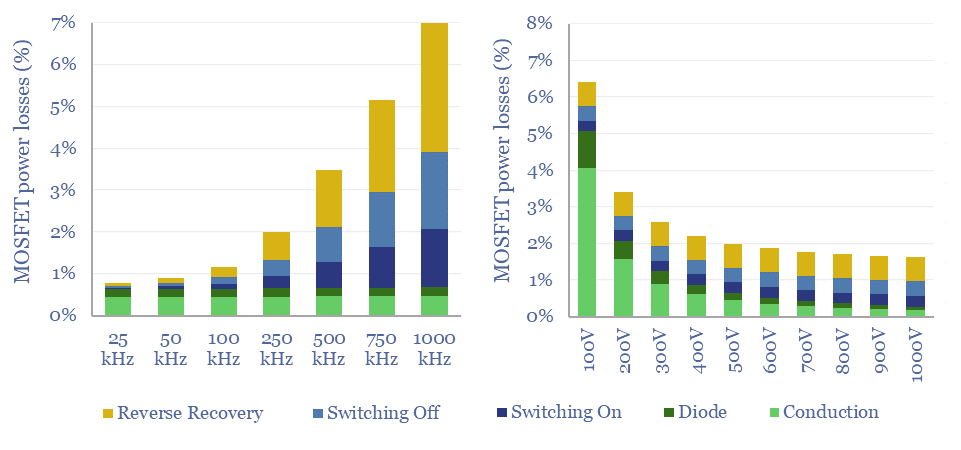
MOSFETs are fast-acting digital switches, used to transform electricity, across new energies and digital devices. MOSFET power losses are built up from first principles in this data-file, averaging 2% per MOSFET, with a range of 1-10% depending on voltage, switching, on resistance, operating temperature and reverse recovery charge.
Download the Data?
Global CO2 emissions rose from 32GTpa of CO2-equivalents in 1990 to 54GTpa in 2024, and are seen optimistically declining to 30GTpa by 2050, on a gross basis. This global CO2 emisisons breakdown covers 33 sources that each explain over 0.5% of global CO2e emissions, as a way of tracking emissions by source, by year, and our projections in the energy transition.
Download the Data?
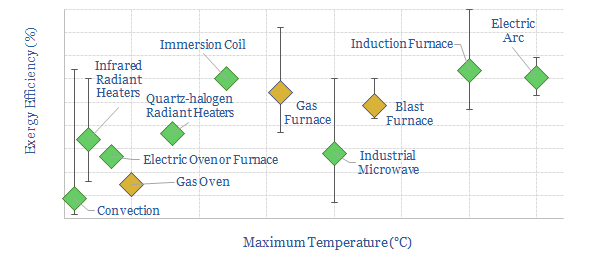
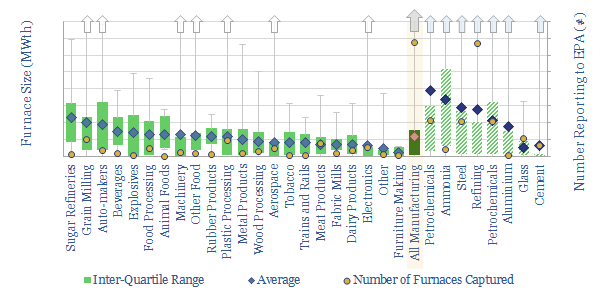
Industrial heat consumes over 10% of all global primary energy. This data-file is a summary of processes that use industrial heat, the specific heating technologies, temperatures, residence times, reactor designs, energy intensity (in kWh/ton) and efficiency, ranging across 20 process technologies and heating technology types.
Download the Data?
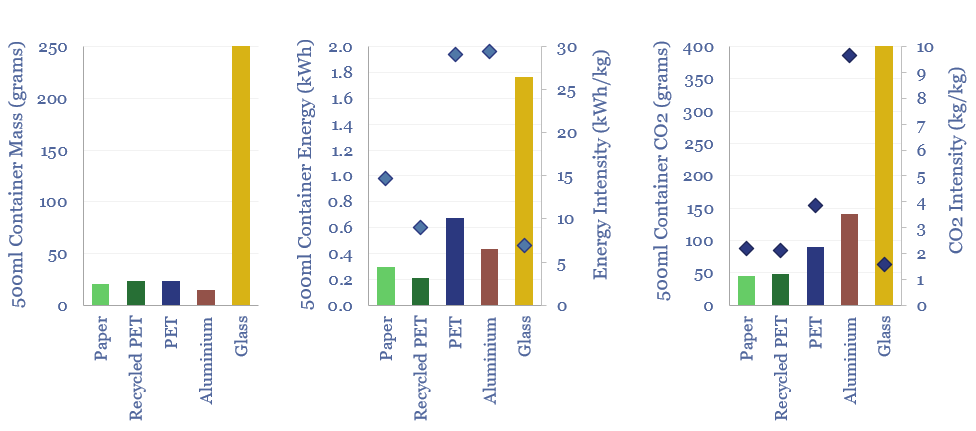
The energy intensity of plastic products and the CO2 intensity of plastics are built up from first principles in this data-file. Virgin plastic typically embeds 3-4 kg/kg of CO2e. But compared against glass, PET bottles embed 60% less energy and 80% less CO2. Compared against virgin PET, recycled PET embeds 70% less energy and 45% less CO2. Aluminium packaging is also highly efficient.
Download the Data?
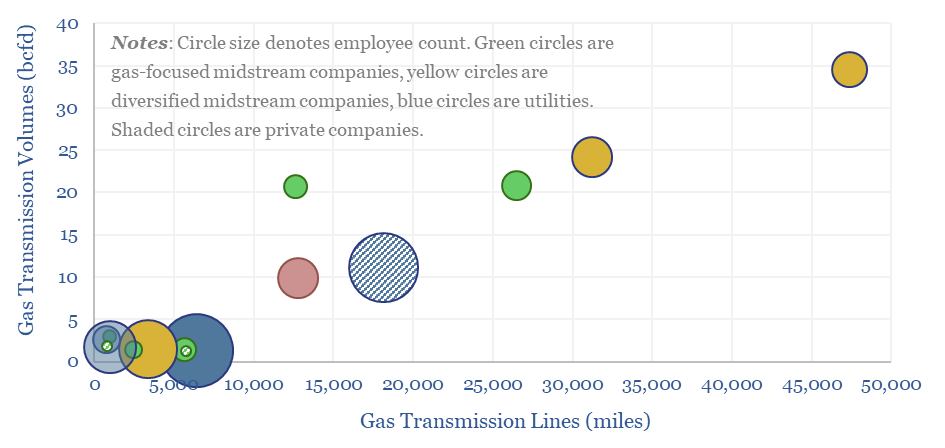
This data-file aggregates granular data into US gas transmission, by company and by pipeline, for 40 major US gas pipelines which transport 45TCF of gas per annum across 185,000 miles; and for 3,200 compressors at 640 related compressor stations.
Download the Data?
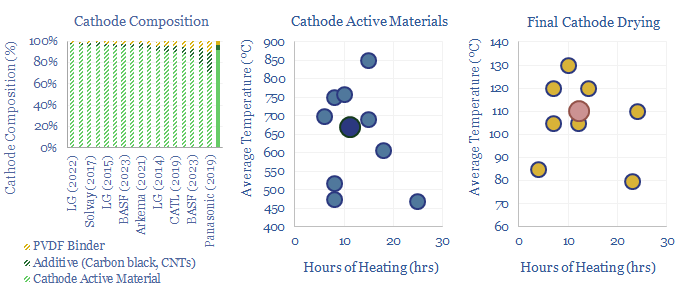
Lithium ion batteries famously have cathodes containing lithium, nickel, manganese, cobalt, aluminium and/or iron phosphate. But how are these cathode active materials manufactured? This data-file gathers specific details from technical papers and patents by leading companies such as BASF, LG, CATL, Panasonic, Solvay and Arkema.
Download the Data?
What is the energy intensity of fiber optic cables? Our best estimate is that moving each GB of internet traffic through the fixed network requires 40Wh/GB of energy, across 20 hops, spanning 800km and requiring an average of 0.05 Wh/GB/km. Generally, long-distance transmission is 1-2 orders of magnitude more energy efficient than short-distance.
Download the Data?
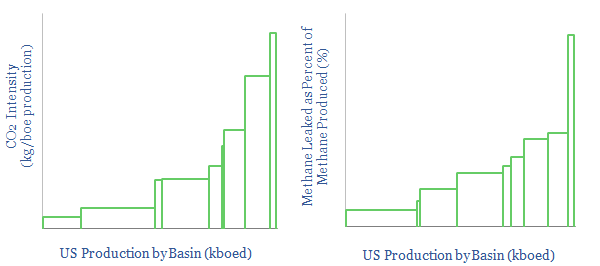
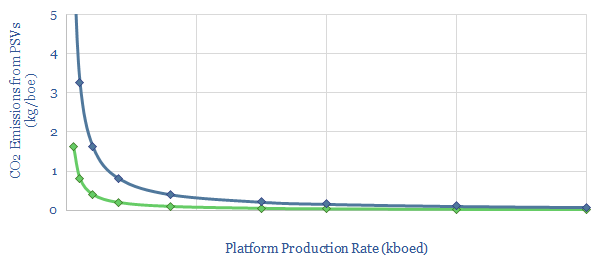
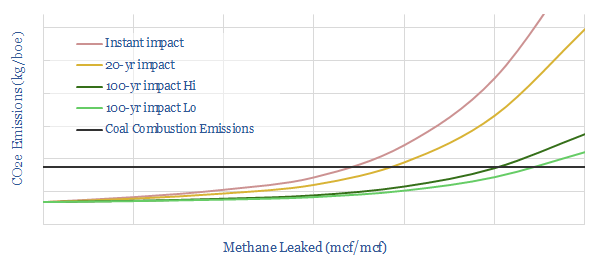
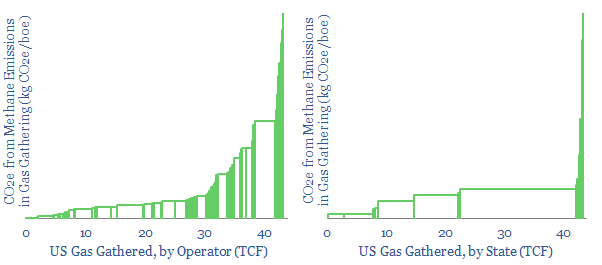
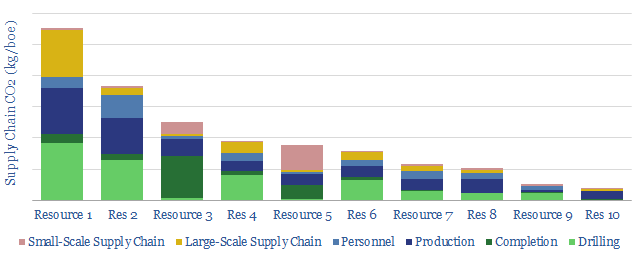
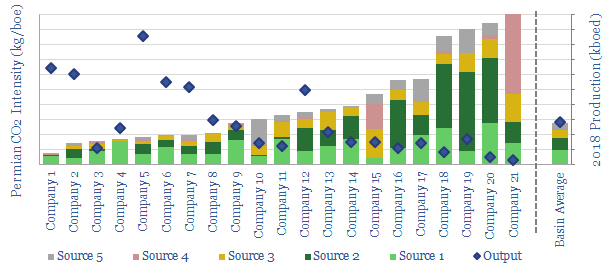
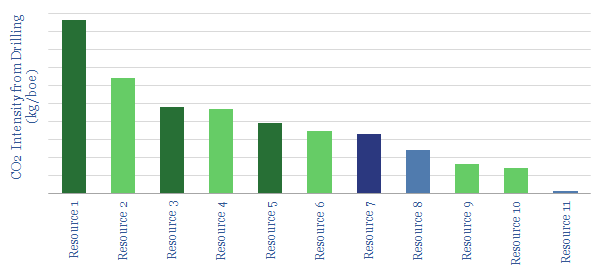
The CO2 intensity of oil and gas production is tabulated for 425 distinct company positions across 12 distinct US onshore basins in this data-file. Using the data, we can aggregate the total upstream CO2 intensity in (kg/boe), methane leakage rates (%) and flaring intensity (in mcf/boe), by company, by basin and across the US Lower 48.
Download the Data?
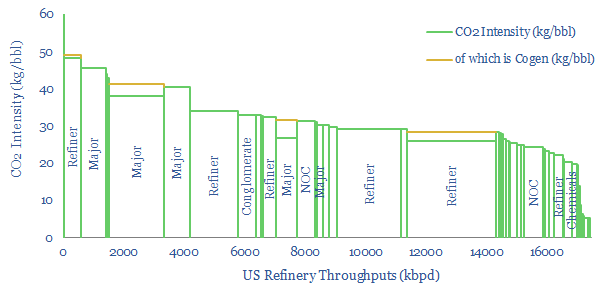
This US refinery database covers 125 US refining facilities, with an average capacity of 150kbpd, and an average CO2 intensity of 33 kg/bbl. Upper quartile performers emitted less than 20 kg/bbl, while lower quartile performers emitted over 40 kg/bbl. The goal of this refinery database is to disaggregate US refining CO2 intensity by company and by facility.
Download the Data?
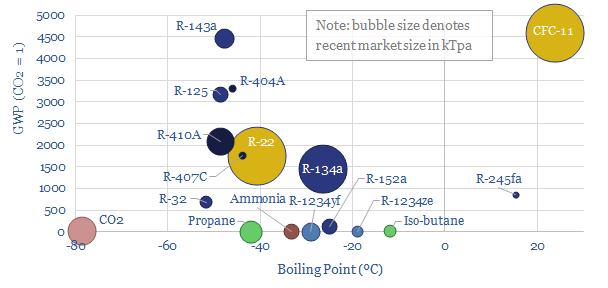
This data-file is a breakdown of c1MTpa of refrigerants used in the recent past for cooling, across refrigerators, air conditioners, in vehicles, industrial chillers, and increasingly, heat pumps. The market is shifting rapidly towards lower-carbon products, including HFOs, propane, iso-butane and even CO2 itself. We still see fluorinated chemicals markets tightening.
Download the Data?
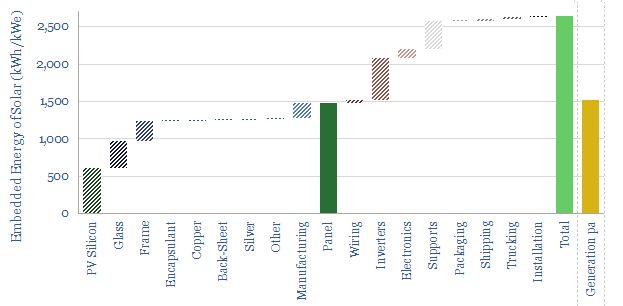
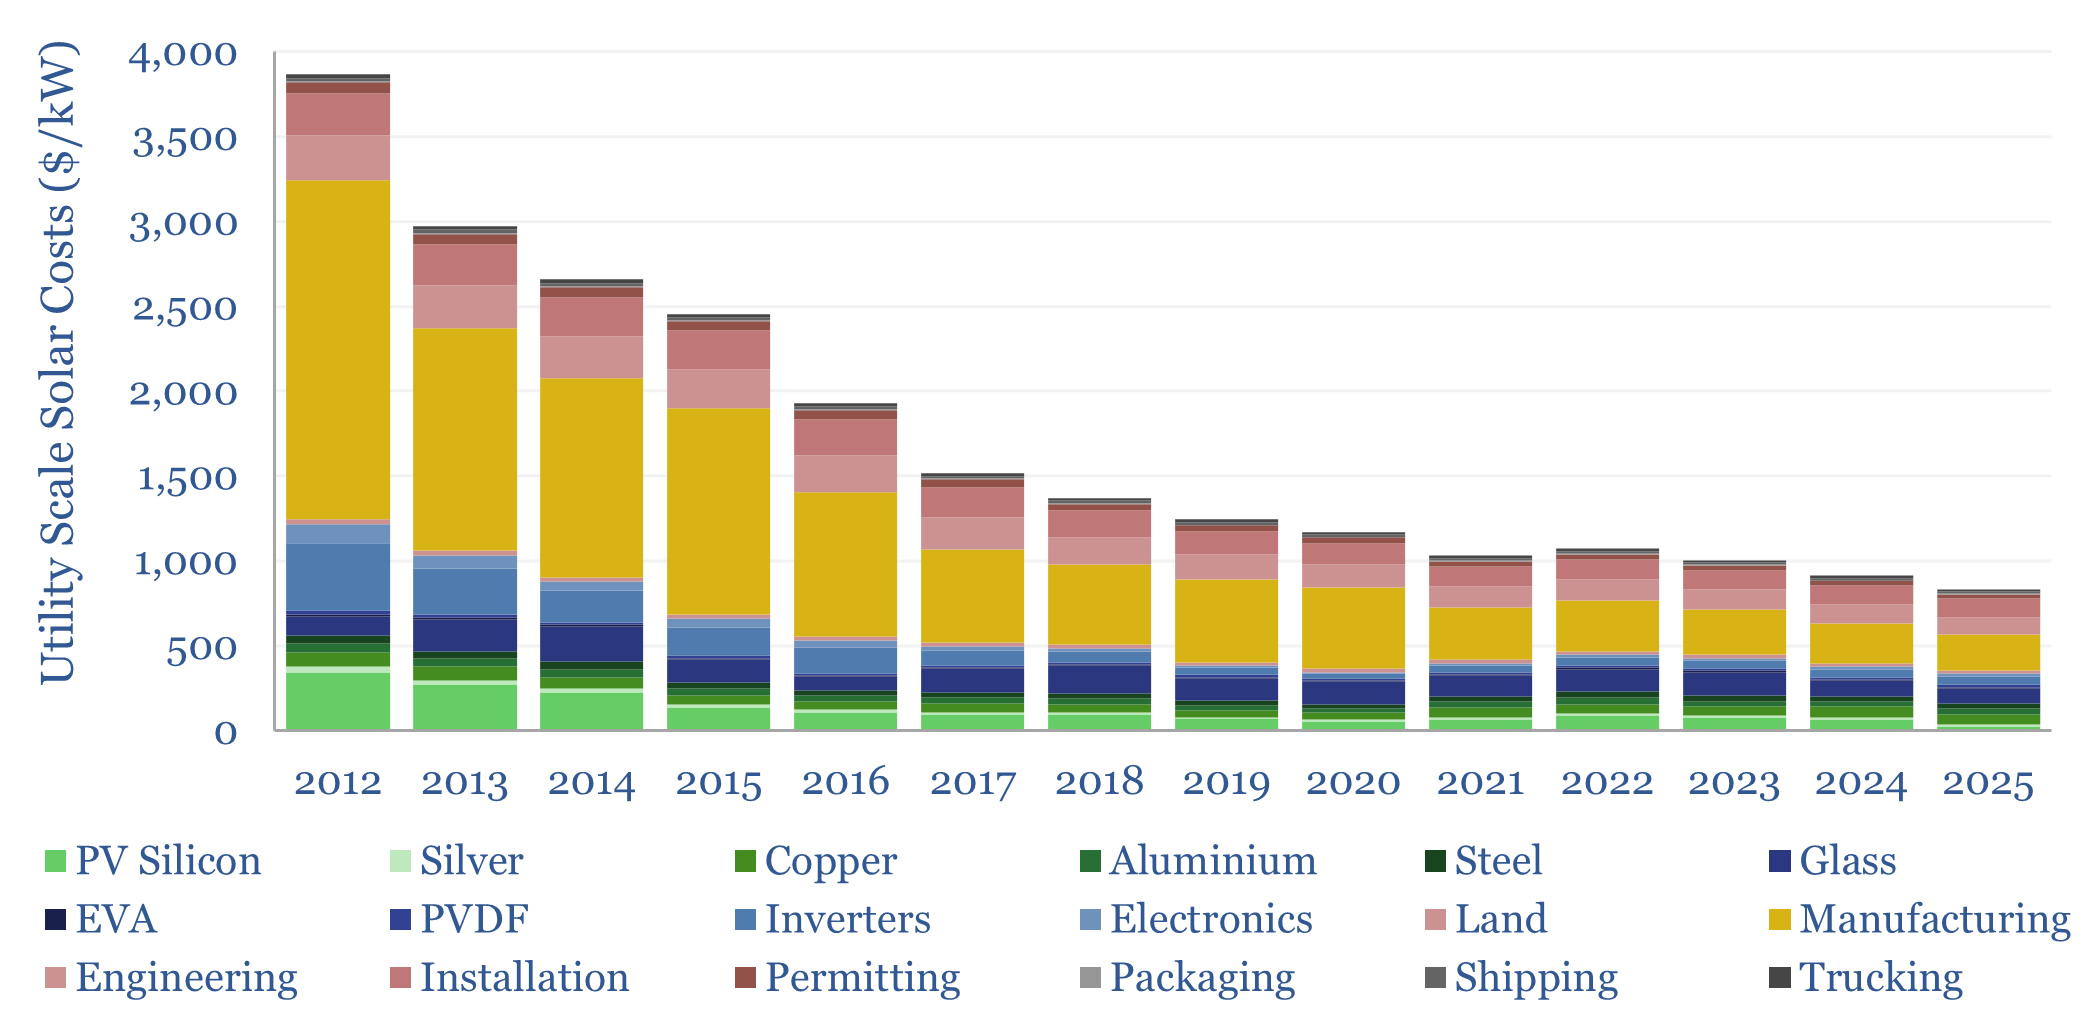
What is the energy payback and embedded energy of solar? We have aggregated the consumption of 10 different materials (in kg/kW) and around 10 other energy-consuming line-items (in kWh/kW). Our base case estimate is 2.5 MWH/kWe of solar and an energy payback of 1.5-years. Numbers and sensitivities can be stress-tested in the data-file.
Download the Data?
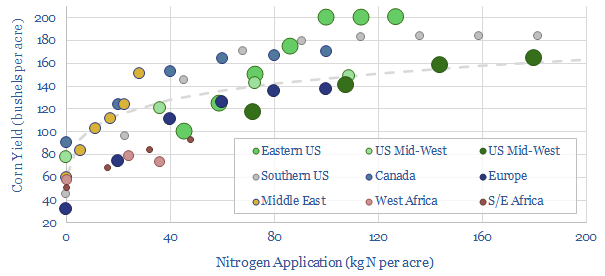
How much does fertilizer increase crop yields? Aggregating all of the global data, a good rule of thumb is that up to 200kg of nitrogen can be applied per acre, increasing corn crop yields from 60 bushels per acre (with no fertilizer) to 160 bushels per acre (at 200 kg/acre). But the relationship is logarithmic, with diminishing returns.
Download the Data?
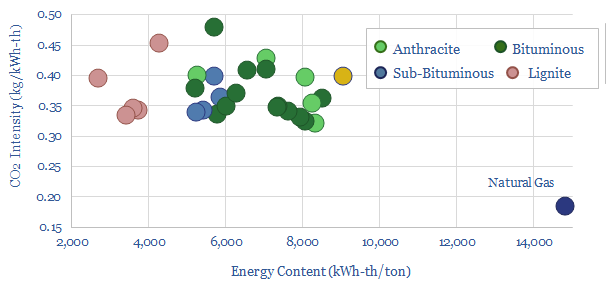
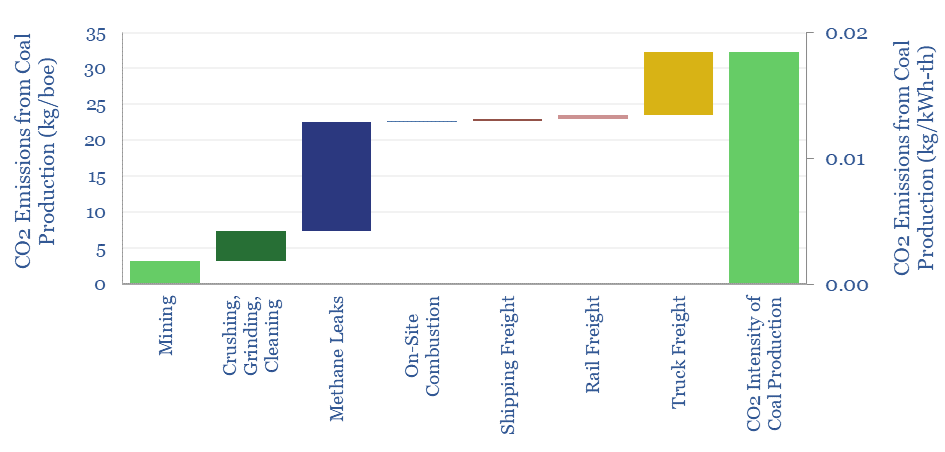
The CO2 intensity of coal is estimated at 0.37kg/kWh of thermal energy, at a typical coal grade comprising 63% carbon and 6,250 kWh/ton of energy content. This is the average across 25 samples in our data-file, while moisture, ash and sulphur are also appraised. Coal is 2x more CO2 intensive than natural gas.
Download the Data?
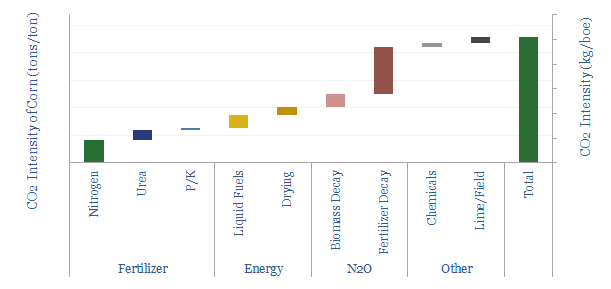
The CO2 intensity of producing corn averages 0.23 tons/ton, or 75kg/boe. 50% is from N2O emissions, a powerful greenhouse gas, from the breakdown of nitrogen fertilizer. Producing 1 kWh of food energy requires 9 kWh of fossil energy.
Download the Data?
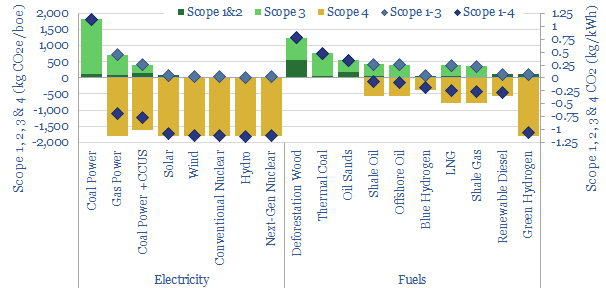
Scope 4 CO2 emissions capture the CO2 that is avoided by use of a product. Many energy investments with positive Scope 1-3 emissions have deeply negative Scope 1-4 emissions. Numbers are quantified and may offer a more constructive approach to decarbonization investments.
Download the Data?
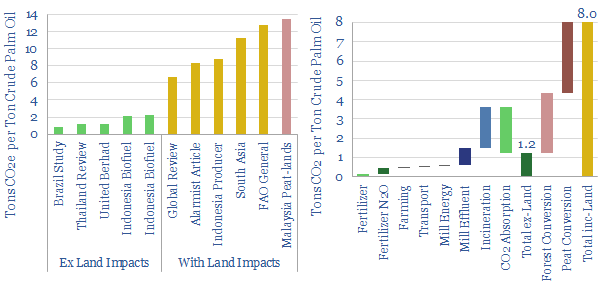
Global palm oil production runs at 80MTpa, for food, HPC and bio-fuels. Carbon intensity is 1.2 tons CO2e per ton of crude palm oil, excluding land use impacts, and 8.0 tons/ton on a global basis including land use impacts. This means once a bio-fuel has more than c35% palm oil in its feedstock, it is likely to be higher carbon than conventional diesel.
Download the Data?
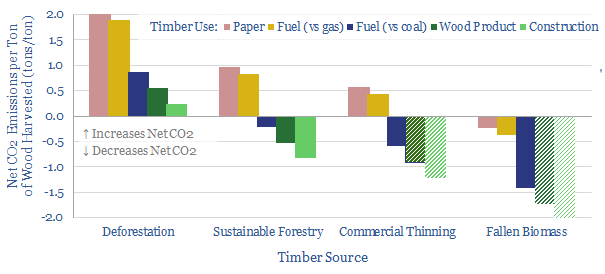
This data-file calculates the CO2 intensity of wood in the energy transition. Context matters, and can sway the net climate impacts from -2 tons of emissions reductions per ton of wood through to +2 tons of incremental emissions per ton of wood. Calculations can be stress-tested in the data-file.
Download the Data?
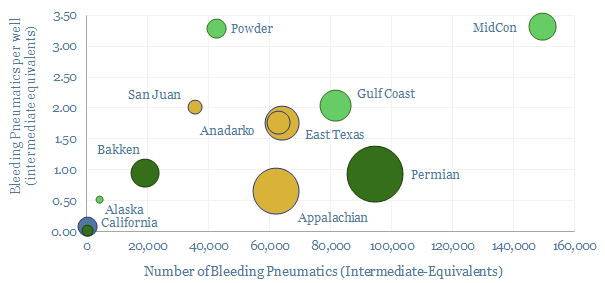
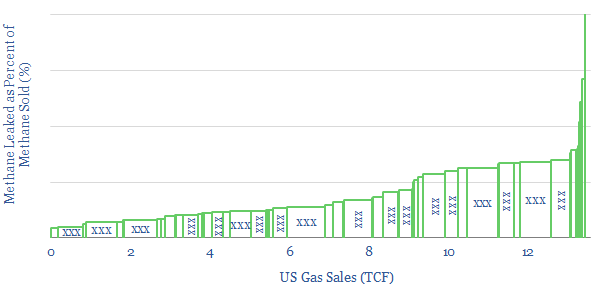
Methane leaks from 1M pneumatic devices across the US onshore oil and gas industry comprise 50% of all US upstream methane leaks and 20% of upstream CO2. This file aggregates the data. Rankings reveal operators with a pressing priority to replace >100,000 medium and high bleed devices, and other best-in-class companies.
Download the Data?
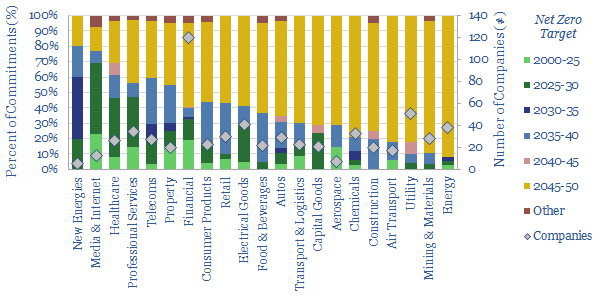
630 companies have now pledged to reach some variant of net zero by early-2022. The average year for this ambition is 2044. Although it varies by sector. 50% of companies are including some Scope 3 emissions in their definitions. This data-file presents our conclusions by sector.
Download the Data?
There are 1,500 industrial furnaces in the US manufacturing sector, with average capacity of 60MWth, c90% powered by natural gas, and thus explaining over 3.5 bcfd of US gas demand (4-5% of total). This is an unbelievably complex landscape, but we have captured as much facility-by-facility data as possible.
Download the Data?
This data-file summarizes the costs of capturing CO2. The lowest-cost options are to access pure CO2 streams that are simply being vented at present. Next are blue hydrogen, steel and cement, which could each have GTpa scale. Power stations place next, at $60-100/ton. DAC is carbon negative but expensive.
Download the Data?
The most important determinant of cooking’s CO2 intensity is consumer behaviour. At today’s energy costs and grid mix, gas-fired cooking yields the lowest costs. Sometimes electrification of cooking will decrease CO2 and sometimes not. Electric induction is most efficient, but 2-3x more expensive than gas and electric hobs.
Download the Data?
This data-file calculates the costs, the embedded energy and the embedded CO2 of different construction materials, both during their production and for ongoing heating and cooling. Insulated wood and cross-laminated timber have the lowest CO2 intensities and can be extremely cost competitive.
Download the Data?
This data-file illustrates the outsized contribution of blue carbon ecosystems in the carbon cycle, looking across mangroves, tidal marshes, sea grasses and peat bogs. Degradation of blue carbon ecosystems continues with vast CO2 consequences, comparable to the entire global cement industry.
Download the Data?
The aim of this data-file is to compile CO2 concentrations in industrial exhaust streams, as a molar percentage of flue gas. This matters for the costs of CO2 separation. Most promising CCS candidates are bio-ethanol plants, industrial hydrogen production and some gas processing, followed by cement and steel plants.
Download the Data?
The average American consumes 36MWH of energy each year, emits 20 tons of CO2, spends $2,000 directly on energy (6% of income) and $4,500 including the energy embedded in goods and services (15% of income). A CO2 price of $75/ton may fully decarbonize the US but would absorb another 5% of average income.
Download the Data?
The costs of 3D printed products are estimated between $10-100/kg in this data-file, in order to earn a 10% IRR on constructing and running an additive manufacturing machine, net of labor costs, energy costs, maintenance and materials. Economic costs, energy intensity and CO2 intensity vary as a function of the material and can be stress-tested in the model.
Download the Data?
CO2-cured concrete has c60% lower emissions than traditional concrete, which is the most widely used construction material on the planet, comprising 4bn tons of annual CO2 emissions, or 8% of the global total. This data-file profiles the CO2 and economic costs of Solidia versus traditional cement, to size the opportunity.
Download the Data?
US bioethanol plants produce 1Mbpd of liquid fuels, with an average CO2 intensity of 85kg/boe. Overall, corn-based bioethanol has c40% lower CO2 than oil products. We screened the leaders and laggards by CO2-intensity, covering Poet, Valero, Great Plains, Koch, Marathon and White Energy.
Download the Data?
Producing a ton of coal typically emits 0.19T of CO2, equivalent to 50kg/boe. The numbers comprise mining, methane leaks and transportation. Hence domestic coal production will tend to emit 2x more CO2 than gas production, plus c2x more CO2 in combustion. However, numbers vary widely based on input assumptions, such as methane lakage rates, btu content and transportation distances, which can be flexed in the model.
Download the Data?
This data-file calculates the contribution of Platform Supply Vessels (PSVs) to an oil and gas asset’s emissions. Our base case estimate is 0.1kg/boe for a productive asset in a well-developed basin. Numbers rise 4x in a remote basin, and by another c4x for smaller fields. 1kg/boe is possible. These emissions can be lowered by 10-20% through by LNG-fuelling or battery-hybridization.
Download the Data?
This data-file quantifies the CO2 intensity of oil sands mining and SAGD, line by line, based on real-world data. We also derive a CO2 curve ranking c2.5Mbpd of production across Alberta, to compare different operators. Steam-oil-ratios explain c60% of the variance in SAGD assets’ emissions.
Download the Data?
Methane leakages average 0.2% when distributing natural gas to end-customers, across the US’s 160 retail gas networks. Leakages are most correlated with the share of sales to smaller customers. 80 distinct gas companies are ranked in this data-file. State-owned utilities appear to have 2x higher leakage rates versus public companies.
Download the Data?
This model disaggregates the CO2 emissions of producing shale oil, across 14 different contributors: such as materials, drilling, fracturing, supply chain, lifting, processing, methane leaks and flaring. CO2 intensity can be flexed by changing the input assumptions. Our ‘idealized shale’ scenario follows in a separate tab, showing how Permian shale production could become ‘carbon neutral’.
Download the Data?
With methane emissions fully controlled, burning gas is c60% lower-CO2 than burning coal. However, taking natural gas to cause 120x more warming than CO2 over a short timeframe, the crossover (where coal emissions and gas emissions are equivalent) is 4% methane intensity. The gas industry must work to mitigate methane.
Download the Data?
Gas gathering and gas processing are 50% less CO2 intensive than oil refining. Nevertheless, these processes emitted 18kg of CO2e per boe in 2018. Methane matters most, explaining 1-7kg/boe of gas industry CO2-equivalents. This data-file assesses 850 US gas gathering and processing facilities, to screen for leaders and laggards, by geography and by operator.
Download the Data?
What is more CO2-intensive: the c4,000 truck trips needed to complete a shale well, or giant offshore service vessels (OSVs), which each consume >100bpd of fuel? This data-file quantifies the CO2 intensity of supply-chains, for 10 different resource types, as a function of 30 input variables.
Download the Data?
This data-file tabulates Permian CO2 intensity, based on regulatory disclosures from 20 of the leading producers to the EPA. The data are disaggregated by company, across 18 different categories, such as combustion, flaring, venting, pneumatics, storage tanks and methane leaks. There are opportunities to lower emissions.
Download the Data?
This data-file estimates the CO2 intensity of drilling oil wells, based on the fuel consumption of different rig types. Drilling wells is not the largest portion of the oil industry’s total CO2 intensity. Nevertheless there is a 50x spread between the best barrels at prolific onshore fields and the worst barrels at mature deepwater assets.
Download the Data?
Global hydrocarbon resources and global coal resources — in-place resources and economically recoverable resources — are estimated from first principles in this data-file. We see the world’s remaining economically recoverable reserves of oil and gas being 4x larger than remaining economically recoverable reserves of coal.
Download the Data?
Annual commodity prices are tabulated in this database for 70 material commodities, as a useful reference file; covering steel prices, other metal prices, chemicals prices, polymer prices, with data going back to 2012, all compared in $/ton. We have updated the data-file for 2025 data in April-2026.
Download the Data?
This data-file tabulates the ‘decline rates’ of 6,600 US solar power plants, going back to 2001. Solar power decline rates average -1.5% up to year 12, after which decline rates increase. This matters for the economics of solar projects.
Download the Data?
This data-file quantifies global carbon markets by category over time, including the EU ETS as an example of a compliance market, RECs, CCS and VERRA-certified “carbon credits”, across categories such as REDD, reforestation and other “carbon offsets”. We also draw analogies with charitable giving and forecast carbon markets out to 2050.
Download the Data?
This data-file aggregates wind generation by facility, across the US, at 1,500 wind farms, going back 25-years. Wind power decline rates average 1.1% per year, then accelerate to 2% per year in years 10-20. However wind generation is also noisy, typically varying +/- 7% YoY. This matters for the economics and ultimate share of wind.
Download the Data?
The energy consumption of global cellular networks is estimated at 250TWH pa in this data-file, by tabulating the deployment of 5G base stations, and other cellular towers, region-by-region. This matters as physical AI may require more cellular connections, across autonomous vehicles, drones and robotics.
Download the Data?
Global heat pump sales by country are tabulated in this data-file, for 14 countries/regions. Developed world heat pump sales rose at an 11% CAGR over the decade since 2012, reaching 6.5M units sold in 2022, but then unexpectedly fell by -10% to 2024. 2025 has seen the start of a recovery, with sales rising 4% YoY.
Download the Data?
More and more renewables projects are being co-developed with battery storage. On average, projects in 2026-30 that codeploy batteries will supplement each MW of renewables capacity with 0.8MW of battery capacity, which in turn offered 4-hours of energy storage per MW of battery capacity, for 3.3 MWH of energy storage per MW of renewables.
Download the Data?
Electrical loads in vehicles typically average 1kW, in order to power HVAC, computers, engine cooling, steering, sensors and entertainment. This equates to 500TWH of electricity demand globally within ICEs, even before considering electrification. Fully autonomous vehicles would likely consume another 1-3kW again for on-board AI chips.
Download the Data?
This data-file is a calculator for steam pipe insulation, calculating heat losses and external temperatures of hot surfaces from first principles, as a function of the industrial insulation thickness. Higher energy prices incentivize additional insulation, although there can be diminishing returns.
Download the Data?
This data-file models residential heating energy from first principles, taking an example in Northern Europe, for a house with 150m2 floor space, requiring 15MWth of heat (space heating and hot water), which is met by consuming 5MWH-e pa in a heat pump, costing $1,500/year. But this can also be optimized.
Download the Data?
Which countries are self-sufficient in refining capacity? Which countries export oil products? And which are least self-reliant, thus needing to import oil products, and potentially facing shortfalls in disrupted markets? This data-file estimates global oil refining self-sufficiency by country.
Download the Data?
Global shale basins are currently producing 12Mbpd of liquids and 110bcfd of gas, across over 20 basins, with over 1 trn bbls of oil resources and 13,000 TCF of gas resources. 3% of all global shale resource has been produced to date. This data-file tabulates resources and production across each basin.
Download the Data?
There is an ocean of oil (and gas) still to find, even in some of the most mature hydrocarbon basins in the world, but finding it will almost certainly require improved seismic, possibly enhanced by AI, as shown by this case study, tracking the sizes of oil resources, discovered off Norway, from 1969 to present.
Download the Data?
This data-file is a geothermal reservoir model, showing how a lateral well could harvest heat from the sub-surface, cool the rock surrounding the well, and ultimately settle at a “steady state” (in MW-th), where the flow of heat into the well from surrounding rock layers matches the rate of heat extraction. Inputs can be stress-tested.
Download the Data?
This data-file aggregates the monthly production data from 10,000 wells in the Bakken, which were drilled and completed over the past decade from 2015 to early 2026. Average Year 1 oil production quadrupled from 2006 to reach 360bpd in 2015-16, continued rising to a peak of 460bpd in 2021, flatlined at 440bpd in 2022-24 and fell to 380bpd in 2025. Some may see this as a sign of resource maturation.
Download the Data?
This data-file aims to give a helpful, basic overview of the $40bn pa compressor market, between centrifugal, reciprocating and screw compressors. A typical industrial unit is 50kW and costs $850/kW on an installed basis. Companies and efficiency calculations are also given.
Download the Data?
This data-file tracks a sample of Marcellus shale well completion parameters, such as lateral length, stage count, proppant and water use and shut-in pressure. Together, these variables explain 40-50% of the variance in shale well productivity, implying the other 50-60% is down to skill and technology, from operators and service providers?
Download the Data?
This data-file summarizes the levelized cost of electricity, across 35 different generation sources, covering 20 different data-fields for each source. Costs of generating electricity can vary from 2-200 c/kWh. The is more variability within categories than between them. Numbers can readily be stress-tested in the data-file.
Download the Data?
India’s electricity demand is growing by 6-8% (+100-140 TWH) per year, but 75% of the total still comes from coal, which has itself grown at a 6% CAGR in the past half-decade. India seems to be industrializing primarly around coal + solar, in relatively equal proportions?
Download the Data?
China coal production costs are estimated on a full-cycle basis in this data-file, averaging $65/ton across large, listed miners, with assets in Shanxi, Inner Mongolia and Shaanxi, and 1.5-2x higher again for smaller regional prices. The costs had been increasing at $1.3/ton/year through 2023, but moderated in 2024-25. But could marginal Chinese coal prices hit LNG price parity around 2030?
Download the Data?
This data-file tabulates the Oil Majors’ exploration capex from the mid-1990s, in headline terms (in billions of dollars) and in per-barrel terms (in $/boe of production). Exploration spending quadrupled from $1/boe in 1995-2005 to $4/boe in 2005-19, and has since collapsed like a warm Easter Egg. Exploration has been de-prioritized. Perhaps wrongly?
Download the Data?
This data-file tabulates the five ‘Big Oil’ Super-Majors’ development capex from the mid-1990s, in headline terms (billions of dollars) and in per-barrel terms ($/boe of production). Real development capex quadrupled from $6/boe in 1995-2000 to $24/boe in 2010-15, collapsed to $10/boe, then recovered to $13.5/boe.
Download the Data?
Global commodity demand is levered to GDP. Specifically, for each +/- 1% acceleration or deceleration in global GDP, commodity demand tends to accelerate or decelerate by +/- 1.4%, with a 70% R-squared, across 25 examples that are indexed in this data-file. Oil demand sensitivity to GDP is particularly interesting.
Download the Data?
This data-file tracks Marcellus shale well productivity, by tabulating the monthly output from 13,000 wells across the Pennsylvania Marcellus, from 2015 to mid-2024. Average IP rates across the basin have risen at a 12% pa CAGR, from around 5 mmcfd in 2015 to 18 mmcfd in 2025. However, activity and productivity differ starkly by operator.
Download the Data?
Over 1,000 electric ships have now been deployed globally. Mostly small-scale. This data-file profiles 30 case studies of electric ships (on the examples tab) and compares the costs of large electric ships against 20,000 TEU container vessels that would otherwise be fueled by marine diesel.
Download the Data?
Wind and solar curtailments now average 8% across different grids that we have evaluated in this data-file, and have generally been rising over time, especially in 2024-25. The key reason is grid bottlenecks. Grid expansions are crucial for wind and solar to continue expanding.
Download the Data?
Reserve margins across major ISOs in the US power grid average 26% in 2026, are seen declining to 10% in the next decade by NERC, and turning negative in regions such as PJM and MISO. Surging power demand and resource retirements are the culprits, although may not unfold as feared. This data-file tabulates reserve margin forecasts, by ISO region, and over time.
Download the Data?
How much energy would be required to support ongoing launches of Starship spacecrafts into Low Earth Orbit? And what capital equipment would be needed to liquefy this LNG fuel and oxygen propellant? This data-file calculates hourly launches would require 1.4bcfd of gas, 9MTpa of LNG liquefaction, 34MTpa of oxygen ASUs, 1.4GW of compression power and $20bn of investment?
Download the Data?
US electricity sales reached 4,430 TWH in 2024, rising +3% YoY, and bringing the trailing ten-year CAGR to 1% pa. The current breakdown is 37% residential, 37% commercial, 26% industrial. All three are now growing. To help understand load growth, this data-file is a breakdown of US electricity demand by sector, by use and over time, with forecasts to 2050.
Download the Data?
US gas power generation by facility is broken down in this data-file, across 1,850 active gas-power plants, supplying 40% of all US electricity. Descriptive statistics are available in the summary tab, a state-by-state breakdown follows in the PlantsByState tab and underlying data on all 3,000 historical facilities are provided in the AllGasPlants tab.
Download the Data?
In solar-heavy grids, power prices trough around mid-day, then ramp up rapidly as the sunset. This price distribution over time is known as the duck curve. US power prices are getting 25-30% more ducky each year, based on some forms of measurement. Power prices are clearly linked to the instantaneous share of wind/solar in grids.
Download the Data?
Cost of grid connection is shaping up to be a major bottleneck for the continued acceleration of new energies. A good baseline is to expect $100-300/kW of grid inter-connection costs, or $3-10/kW-km, over a typical distance of 10-70 km. But the requirement to fund network upgrade costs can push grid connections to cost more than developing renewables projects themselves?!
Download the Data?
Solar costs have deflated by 70% in the past decade to $800/kW in 2025. 60% has been the scale-up to mass manufacturing, and 40% has been rising efficiency of solar modules. Doubling the efficiency, and thereby the output of solar modules, can halve costs again.
Download the Data?
A large industrial gas turbine contains over 100,000 components. This data-file breaks down a gas turbine by component, across 45 component types, explaining what each component does, estimating its typical mass (in kg), its typical cost (in $/kW and $/kg) and how it is manufactured.
Download the Data?
How is AI affecting materials development? This Excel data-file tabulates 20 recent case studies, across pharmaceuticals, solar, batteries, CCS, plastics, semiconductors, superalloys and superconductors. We conclude AI is a step-change for improved materials development, it is happening now and it is commercially relevant.
Download the Data?
The cost of low-Earth orbit satellites has declined at about 5-10% pa, since the year 2000. A satellite costs $100,000-200,000/kg. Launch costs are now $1,000-10,000/kg, although the scatter is broad, and potentially higher for small payloads on low-utilization rockets. Within that, fuel costs are around $10/kg. This data-file captures the costs of space launch.
Download the Data?
DC-DC power converters are used to alter the voltage in DC circuits, such as in wind turbines, solar MPPT, batteries and digital/computing devices. This data-file is a breakdown of DC-DC power converters’ electrical efficiency, which will typically be around 95%. Losses are higher at low loads. We think there will be upside for increasingly high-quality and efficient power electronics as part of the energy transition.
Download the Data?
This data-file tracks the progress in deploying AI in the coal industry, and deploying robots in the coal industry, based on the evidence from patents filed in 2025 and early 2026. AI is increasingly under study, but mainly for safety and monitoring applications, and often specifically to combat resource depletion, which is discussed in c30% of the patents.
Download the Data?
How is AI being deployed in the oilfield? Is it unlocking more production, or deflating cost-curves? And who benefits? Answers to all of these questions are evidenced by reviewing 40 case studies of AI in the oil industry, from the past year, as described in technical papers from the Society of Petroleum Engineers.
Download the Data?
What is interesting about AI is shifting. Away from large centralized data centers and towards AI chips embedded in devices at the grid edge. And away from the general and towards highly specific applications and contexts. The AI cameras in our driveway recently picked up a Eurasian lynx this summer, which exemplifies both shifts, as discussed in our latest video.
Read More?
This video reflects on our favorite AI case studies of 2026, and what they mean for energy, industrials and equity markets. 1-2 year payback periods mean mild supply chain pull, then deep, persistent deflation. Most case studies are sub-kW scale. And maybe the few GW-scale deployments are “one and done”. Implications follow…
Read More?
This video captures our top five reflections on energy, materials and industrials in 2025, which are also reasons for excitement in 2026. New technologies are unlocking new opportunities, re-shaping cost curves, “uncommoditizing commodities”, unlocking more energy and demand-side flexibility, and we are building high-conviction conclusions to create value amidst this transition.
Read More?
Training an AI chat-bot for the TSE website has been a cool project for us, over the past 2-months. But today’s AIs struggle in gauging which content is most important to decision-makers. Hence, we went through the entire TSE research library, and simply added our own subjective “importance score” to every report and data-file. So you can now search the TSE website and rank the results by importance. These direct experiences with AI matter for some key debates in AI energy consumption.
Read More?
This is the first video in a new series, highlighting additional angles on high-conviction ideas. We see future US load growth at 1-3% per year, not 5-10% per year, based on detailed modelling. But are there biases that make load growth prone to being over-estimated? We also explore where we could be wrong in our thesis, and other musings from September-2025.
Read More?
This podcast explores the future of autonomous mobility, via a discussion between Martin Viecha, founder and CEO of MV Motion, and Rob West, founder and lead analyst of Thunder Said Energy. Autonomous mobility is potentially now at a biting point for transforming urban mobility, accelerating urban EVs, and also oil demand for long-distance autonomous ICEs?
Read More?
Classic blunders famously include “never start a land war in Asia” and “never go up against a Sicilian when death is on the line”. But this video sets out what we believe are the three classic blunders that should be avoided by energy analysts, and in the energy transition, based on our own experiences over the past 15-years.
Read More?
How will AI change the research and investment worlds? Our view is that large language models (LLMs) will soon surpass human analysts in assimilating and summarizing information. Hence this video explores three areas where human analysts can continue to earn their keep, and possibly even help decision-makers beat the ‘consensus engines’.
Read More?
The number one topic in energy this year has been the rise of AI. Which might not seem like an energy topic. Yet it is inextricably linked with power grid bottlenecks, the single biggest issue for energy markets in the mid-late 2020s. The goal of today’s video is to recap our key conclusions. There is an accompanying presentation for TSE clients, plus links to our underlying work.
Read More?
It is a rite of passage for every energy analyst to rent an electric vehicle for an EV road trip, then document their observations and experiences. Our conclusions are that range anxiety is real, chargers benefit retailers, economics are debatable, power grids will be the biggest bottleneck and our EV growth forecasts are not overly optimistic.
Read More?
This video explains email mailing lists, SPF, DKIM, DMARC, lessons learned over 15-years, and an unfortunate issue from December that prevented 4,000 subscribers from receiving our research. We’re sorry. We’ve fixed it! And some comments follow below to make sure important research reaches you.
Read More?
In October-2022, we wrote that high interest rates could create an ‘unbridled disaster’ for new energies in 2023. So where could we have done better in helping our clients to navigate this challenging year? Our new year’s resolutions are clearer conclusions, predictions over moralizations, and looking through macro noise to keep long-term mega-trends in mind.
Read More?
Many questions that matter in the energy transition are engineering questions, which flow through to energy economics: which technologies work, what do they cost, what energy penalties they have, and which materials do they use? We see an intersection for economics and engineering in our energy transition research.
Read More?
This video covers our top five reflections after 3.5 years, running a research firm focused on energy transition. The greatest value is found in low-cost decarbonization technologies, resource bottlenecks and hidden nuances and bottom-up opportunities.
Read More?
This gloomy video explores growing fears that the energy transition could ‘fall apart’ in the mid-late 2020s, due to energy shortages and geopolitical discord. Constructive solutions will include debottlenecking resource-bottlenecks, efficiency technologies and natural gas pragmatism.
Read More?
Energy transition is like a game of chess: impossible to get right, unless you are looking at the entire board. Rigid coverage models do not work. This video explores the emergence of energy strategist roles at firms that care about energy transition, and how to become a ‘grand master’ in 2022.
Read More?
This short note is a progress update, including videos and drone footage, on our aspirations to undertake a series of reforestation projects in Estonia. It covers considerations for selecting land; and our first small investment to plant spruce in 2022.
Read More?
After six months living in Tallinn, Estonia, the history of the Baltic States has been swirling around in my mind. Especially a list of old jokes, told during Soviet times, about persistent industrial shortages, propaganda, the suppression of dissent and the ridiculousness of planned economies. This video explores whether there is any overlap with energy transition policies.
Read More?
This short video is a thinly-veiled critique of carbon markets. To do this, we use an analogy from the banking sector, followed by some observations on carbon prices and carbon offsets.
Read More?
This video contains my top five conclusions from some eye-opening real world experiences. Specifically, for the better part of the past six months, my wife and I have been working ‘nomadically’. I made it to 44 US States in total. This has changed my views on transition costs, mobility and nature.
Read More?
We are starting a new strand of research, evaluating the specific energy technologies of specific early-stage companies, to help drive the energy transition. This video lays out our rationale, and our methodology, which draws on two years of patent learnings.
Read More?
“As a no till farmer, I’m doing my part [on climate change… if the carbon market grows] farmers will change their practices”. These were the comments of an Iowa farmer that has now commercialized $330,000 of carbon credits from conservation agriculture. The case study shows how the carbon market is causing CO2-farming to expand and advance.
Read More?
This presentation covers our outlook for the US shale industry in the 2020s, and was presented at a recent investor conference. It covers the importance of shale oil supplies in balancing future oil markets, our outlook for 5% annual productivity growth, and the opportunity for carbon-neutrality to attract capital.
Read More?
Last year, we appeared on RealVision, advocating economic opportunities that can decarbonize the energy system. The “comments” surprised us, suggesting the topic of energy transition is extremely polarized. Historically, such ideological polarization has not ended well. This re-affirms the need for energy technologies.
Read More?
The Top Technologies in Energy
What are the top technologies to transform the global energy industry and the world? This data-file ties all our work together, summarising where we have a differentiated viewpoint, across all of our energy transition research to-date. For each technology, we summarise the opportunity, then we score its Economic Impact and Technology Readiness Level (TRL). The output is a “ranking” of the top technologies in energy. All of the companies mentioned in our research are screened here.
Energy Technology Research — Notes and Background
Our energy technology research aims to help decision-makers find economic opportunities that can improve the world’s energy system and industrial landscape. This page presents all of our recent research, in chronological order, in an array of different carousels. Our latest research is also sent out daily to subscribers on our distribution list.
Written Insights. Every Monday, we publish a 10-20 page, thematic research report. Each report tackles a specific technology or controversy, usually with the same concise structure: what is it? why does it matter? what does it cost? what are the technical challenges? which companies are leading in this theme, both public and private. We are not trying to write ‘war and peace’ in our research. Just to help decision-makers get to helpful, interesting answers, in a way that maximizes their ‘return on time’ spent reading.
Energy market models. All of our work links together into a mega-model for decarbonizing the world. In other words, we need to grasp how it will be possible to satisfy 100,000 TWH pa of human energy demand in 2050, while emitting no net CO2. Our different energy market models capture how much of each commodity and component we would need along the way, from wind/solar capacity installations, conventional energy sources such as oil and natural gas (combined with carbon capture and carbon removals), to long-distance power transmission, to all metals and materials. These are simple and useful models which can be flexed, in order to ballpark numbers and identify bottlenecks.
Economic models. What are the costs of different technologies in the energy transition? We construct economic models in order to capture costs, compare costs, and stress-test sensitivities. All of our models are in the same format. They calculate the marginal cost of product needed to achieve a 10% IRR, underlying capex, operating costs, energy costs (kWh/ton) and CO2 intensity (ton/ton).
Technology Screens and Company Screens. These screens aim to give a summary of the different companies in a particular supply chain, with useful data and summaries. This will either be based on breaking down the market by size, or by facility, or by screening patents.
Breakthrough Technologies. We have developed a five-point framework, for assessing the patents of different companies in the energy transition. The purpose of the framework is to assess which companies/technologies can more readily be de-risked in our roadmap to net zero, and which technologies may still have more risk attached to them (for more on the development of this framework, please see our video on evaluating risks in patents).
CO2 Intensity and Energy Intensity. Our carbon intensity research quantifies how much CO2e is released per unit of production, across materials, transportation, manufactured goods and energy itself. To do this, we aggregate data from technical papers, public data sources. In some cases, we have been able to build up industry “CO2 curves”, using publicly available data from sources such as EPA FLIGHT.
Industry Data. Some of our data-files simply contain useful industrial data, which we have spent time aggregating, cleaning and evaluating. We publish all the data behind our research, to help decision-makers save time, and to subtantiate our published conclusions. Every exhibit or chart in a Thunder Said Energy research report will contain a link to an underlying data-file, which is published somewhere on our website.
This website uses necessary cookies. Our cookies are simply to improve your experience. We do not undertake any advertising or targeting via our cookies. By clicking 'accept' or continuing to use the website, you consent to our use of cookies.AcceptTerms & Conditions
Privacy & Cookies Policy
Privacy Overview
This website uses cookies to improve your experience while you navigate through the website. Out of these, the cookies that are categorized as necessary are stored on your browser as they are essential for the working of basic functionalities of the website. We also use third-party cookies that help us analyze and understand how you use this website. These cookies will be stored in your browser only with your consent. You also have the option to opt-out of these cookies. But opting out of some of these cookies may affect your browsing experience.
Necessary cookies are absolutely essential for the website to function properly. This category only includes cookies that ensures basic functionalities and security features of the website. These cookies do not store any personal information.
Any cookies that may not be particularly necessary for the website to function and is used specifically to collect user personal data via analytics, ads, other embedded contents are termed as non-necessary cookies. It is mandatory to procure user consent prior to running these cookies on your website.