This data-file aggregates wind and solar statistical distributions, plotting solar generation and wind generation, every 5-minutes, across California, for the entirety of 2022, in order to understand their volatility and curtailment rates. The data suggest that wind and solar will most likely peak at 50-55% of renewables-heavy grids.
How will ramping up wind and solar increase volatility of other generation sources, lower the utilization rates of the overall grid, and where will wind and solar naturally peak?
We can answer these questions by evaluating 100,000 x 5-minute intervals of power generation, from California’s power grid in 2022, then calculating the statistical distributions of wind, solar and total demand.
Our key findings are in our recent research note, assessing where will wind and solar peak? (see below).
As always, we publish the data behind our analysis, to give transparency on the methodology, and assumptions can be stress-tested.
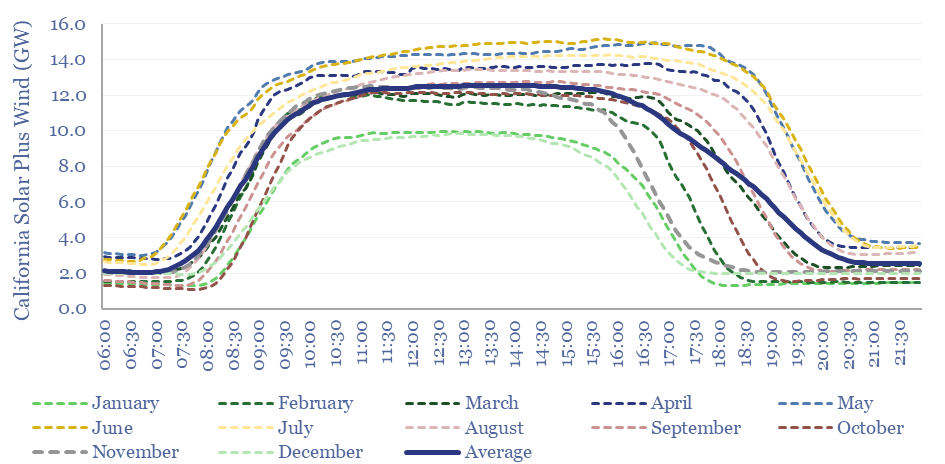
Tabs ending _Averages plot the average load across different five-minute intervals, across the year, showing wind and solar statistical distributions, and how they vary throughout the day, in different months.
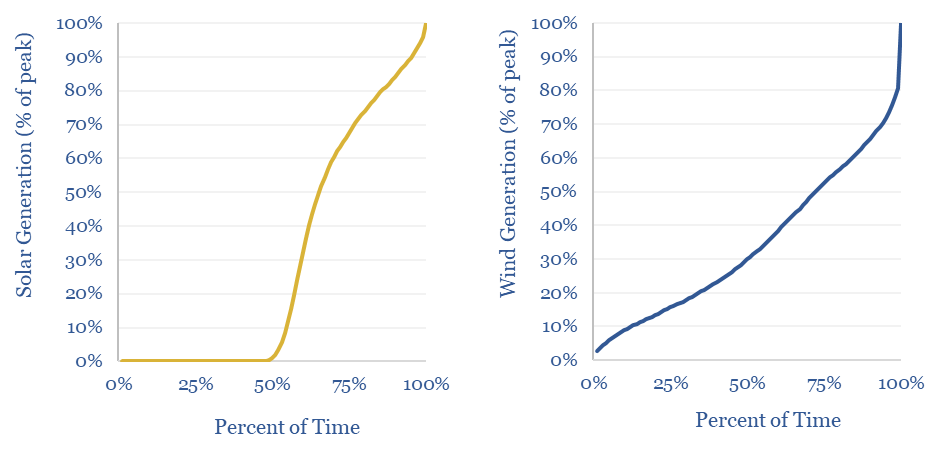
Tabs ending _DitsributionFlex plot the distribution of each time series, by percentile, across the entire year.
The analysis then asks: if the future distribution matches today’s distribution, how much of a hypothetical ‘constant’ grid load could wind, solar and wind+solar supply, at different curtailment thresholds.
If we assume that supply will stop growing when marginal capacity additions are likely to incur 30-60% curtailment rates, this suggests that solar would most likely peak out at 35-40% of a grid, wind would most likely peak out at 60-70% of a grid, while a mixture of wind and solar would most likely peak out at 50-55% of a grid.
Please see our broader research into power grids, into California’s grid and for similar statistical analysis of wind generation elsewhere, we have run similar analysis for the UK power grid.