Demand
-
Can residential solar cover residential AC demand?
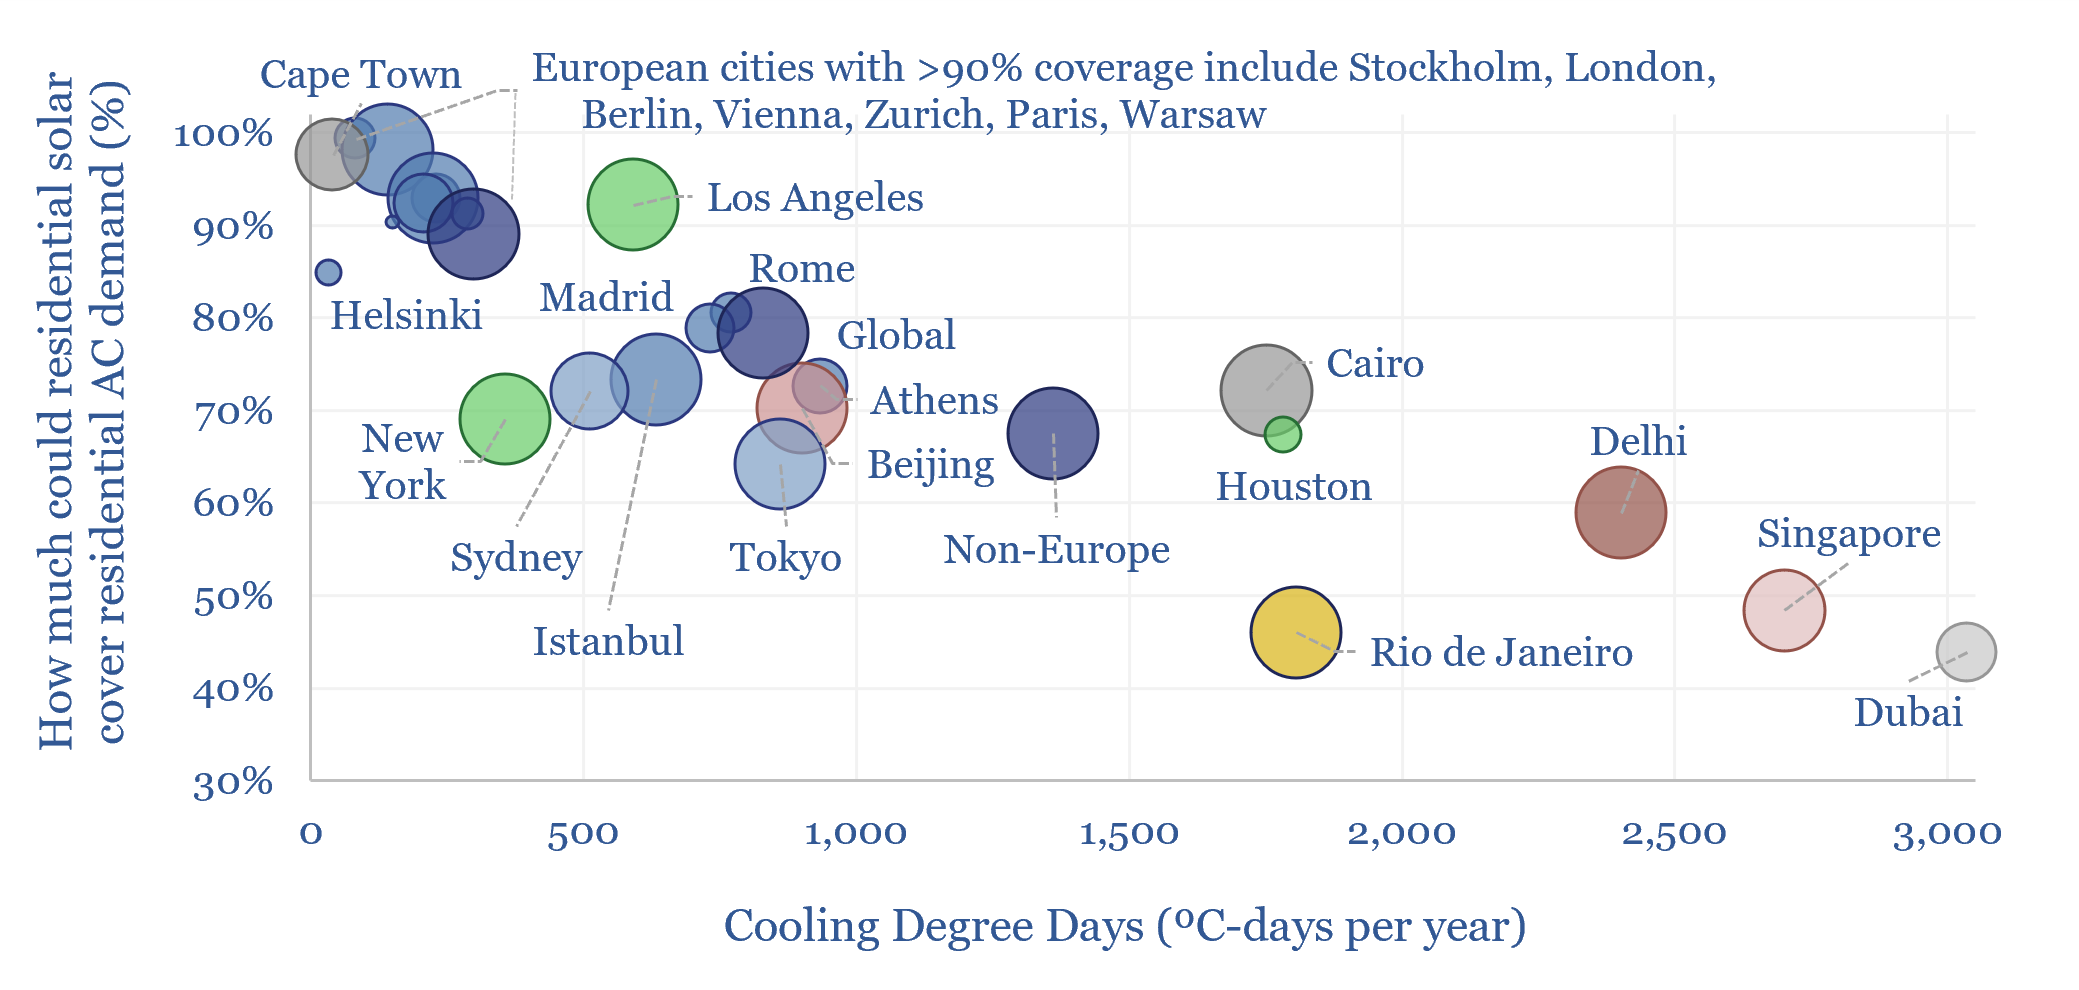
Can residential solar cover residential AC demand? To answer this question, we have downloaded hourly data across 2025, from NASA Earth Observatory, across 25 major cities. The average home, with 20m2 of solar modules (a 5kW array), can cover 80% of the energy costs of keeping indoor temperatures below 20C, rising above 90% in many…
-
Global energy: supply-demand model?
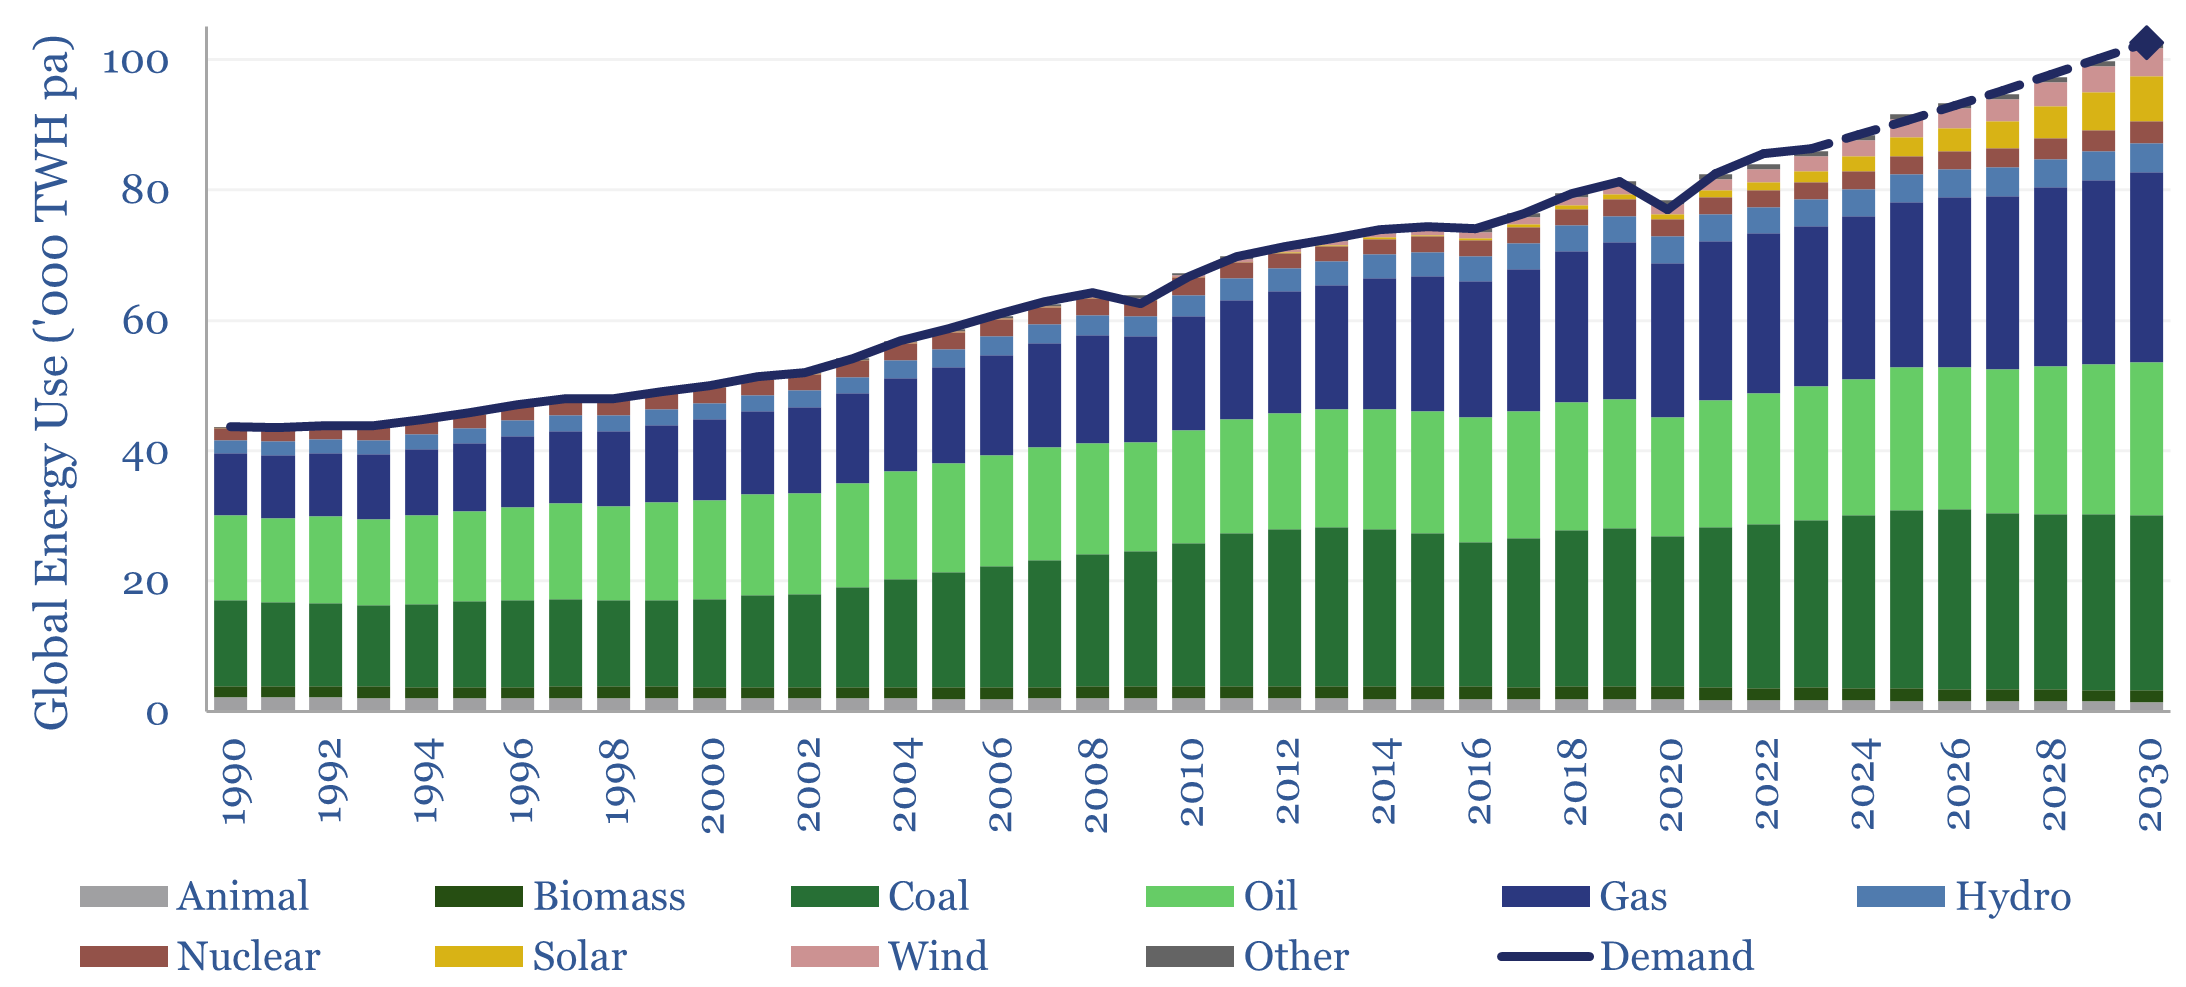
This global energy supply-demand model combines our supply outlooks for coal, oil, gas, LNG, wind and solar, nuclear and hydro, into a build-up of useful global energy balances in 2023-30. 2026 will be a year of recalibration, as global energy markets shift from c1% over-supply in 2025 to -0.5% under-supply in 2027?
-
Capital goods: book-to-bill ratio tracker?
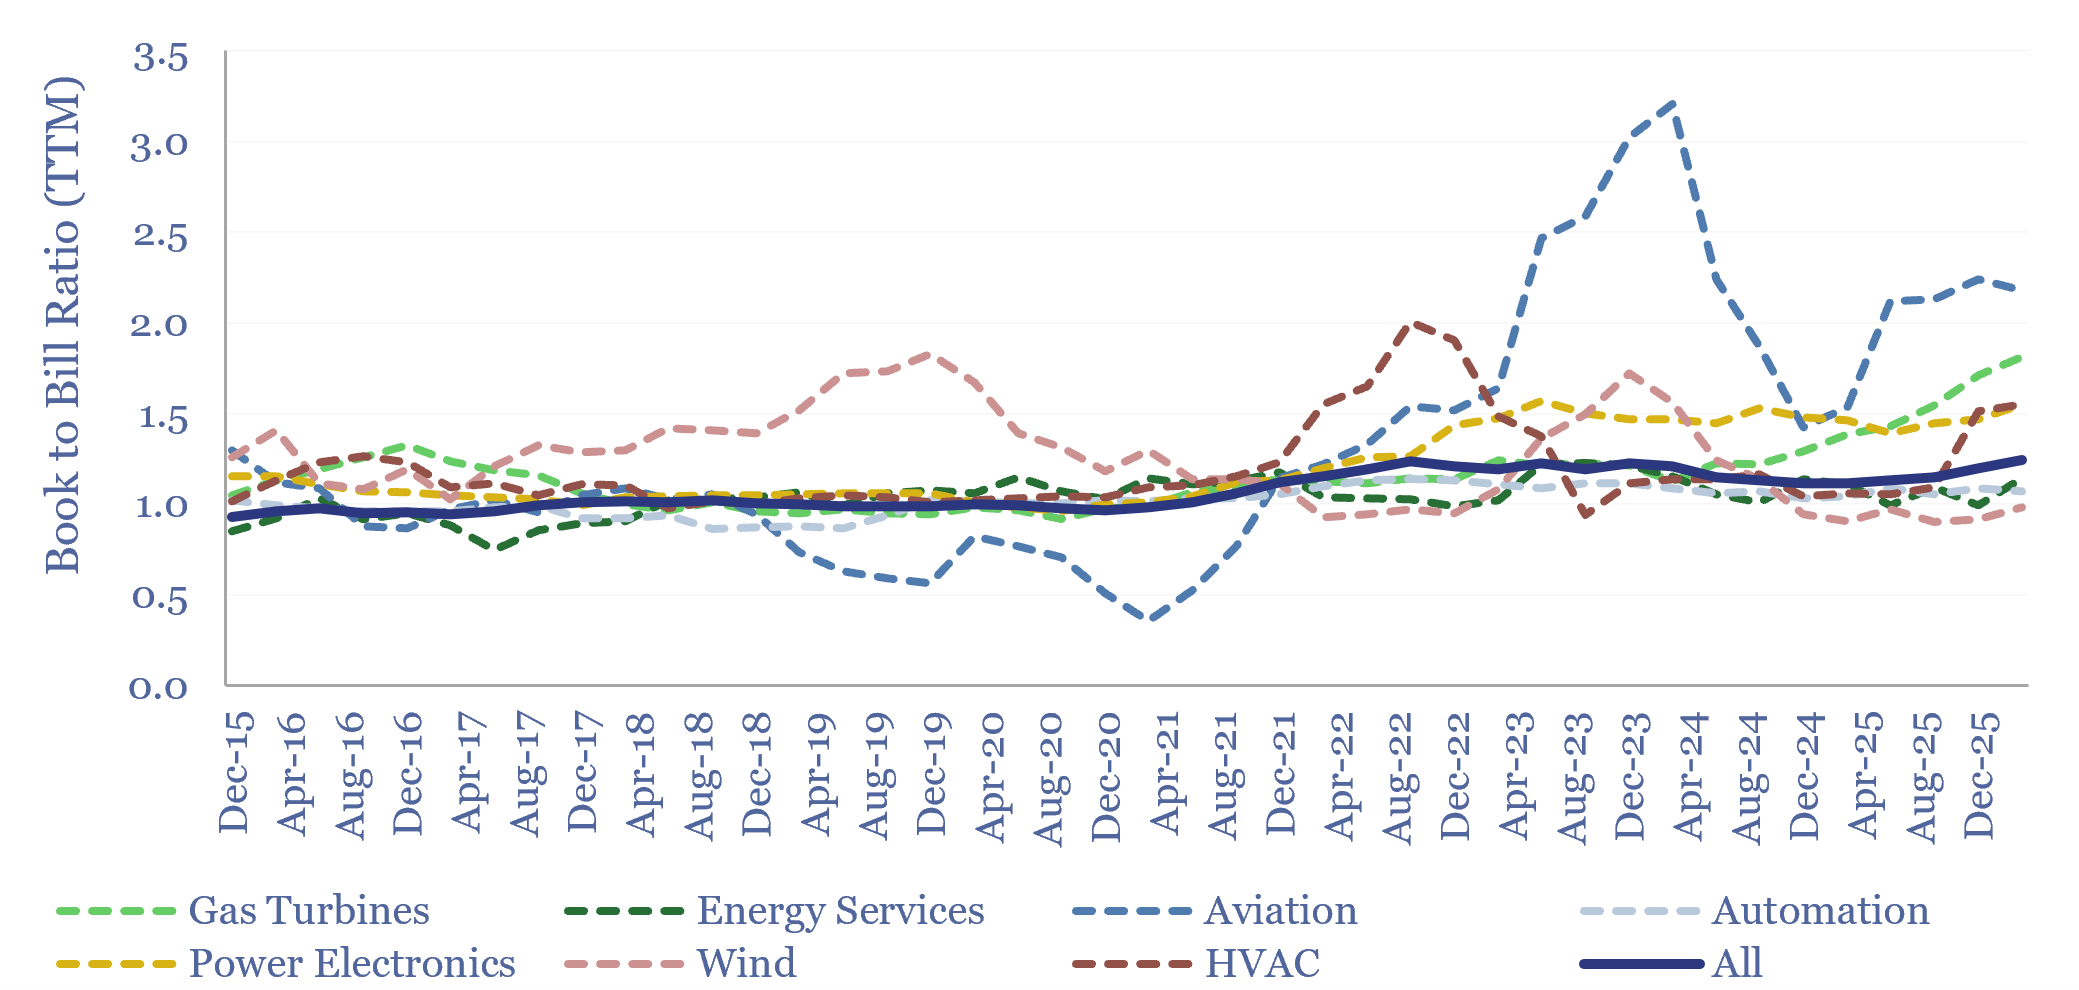
How long will boom times last in capital goods categories, including for AI data center construction? To answer this question, we have started tracking book-to-bill ratios, across 40 capital goods categories, from companies quarterly results. Booms occur when book-to-bill exceeds 1.5x, and typically last 2-years.
-
Zipline: drone delivery technology?
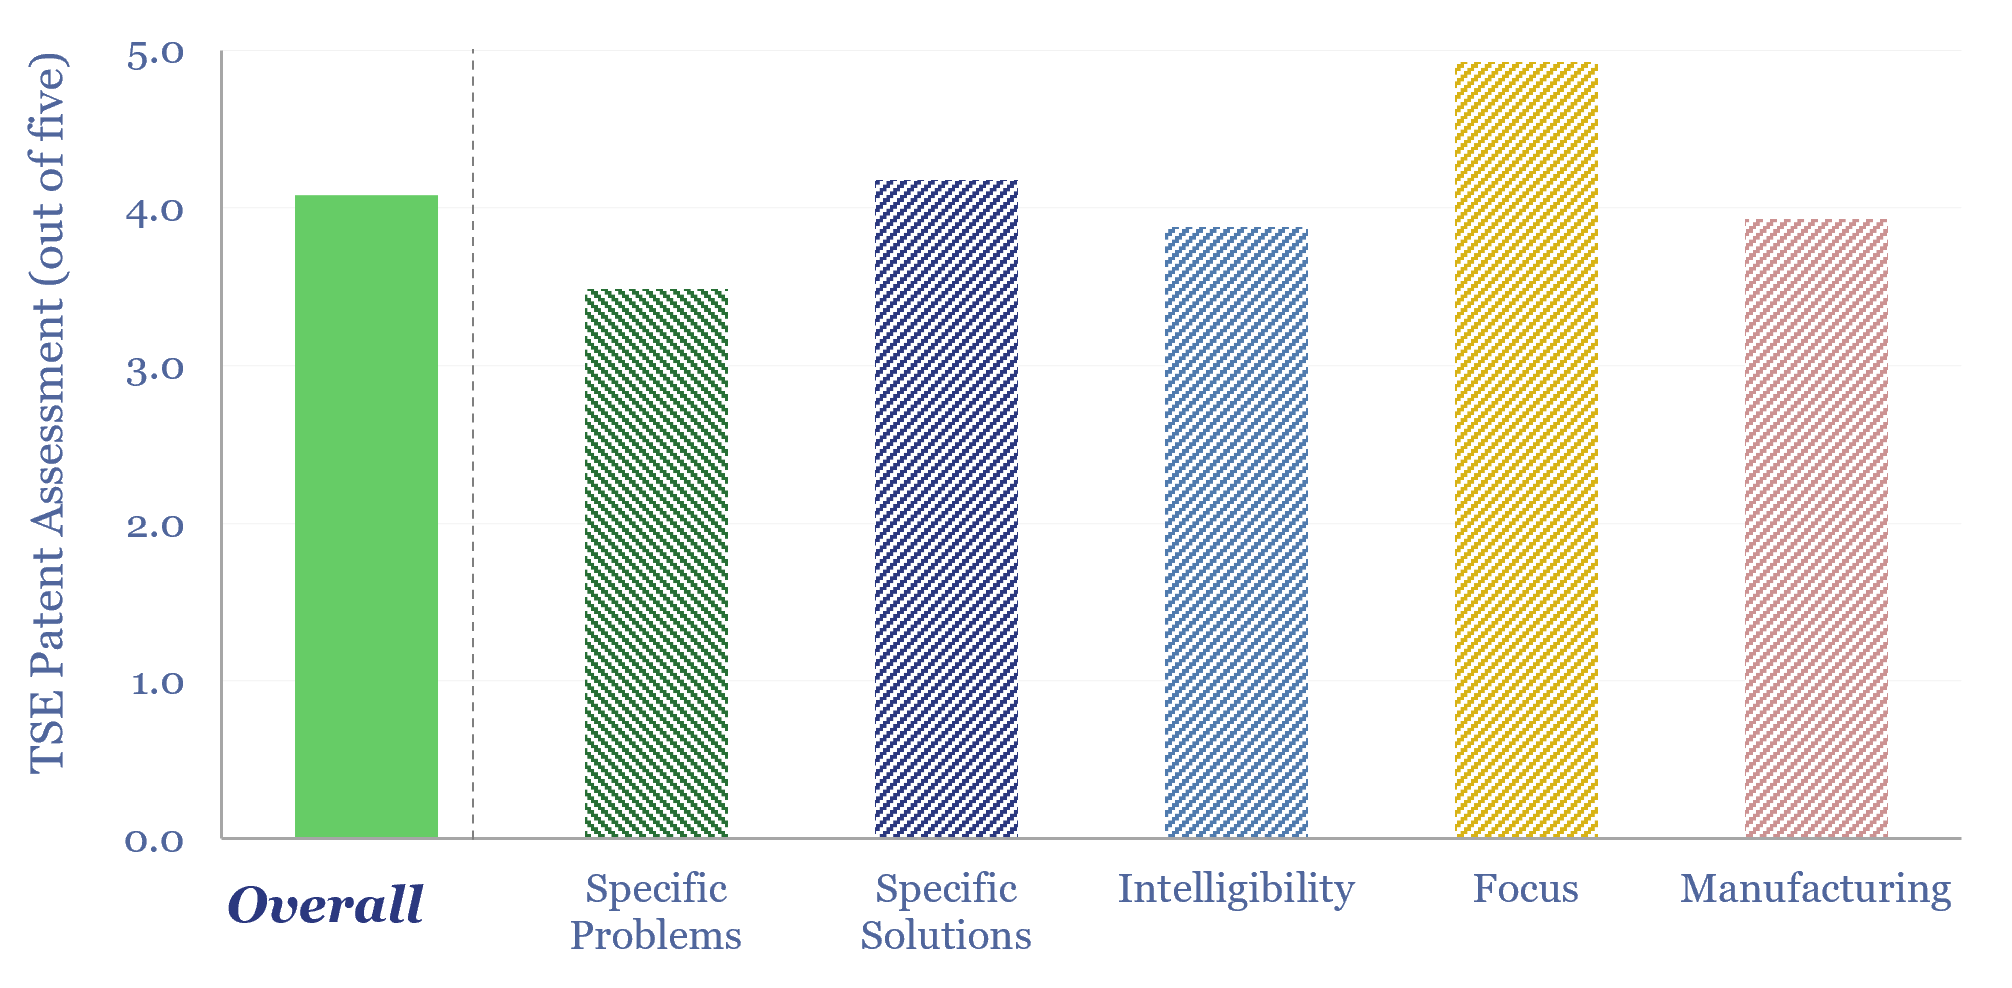
Details of Zipline drone delivery technology are derived in this data-file, based on reviewing over 15 highly detailed patent families from the company. We see a moat around specific hardware innovations, a low cost sensor suite, inherent safety from seven layers of safety protections, and a sophisticated fleet management system.
-
Residential heating costs: boilers, furnaces, electric and heat pumps?
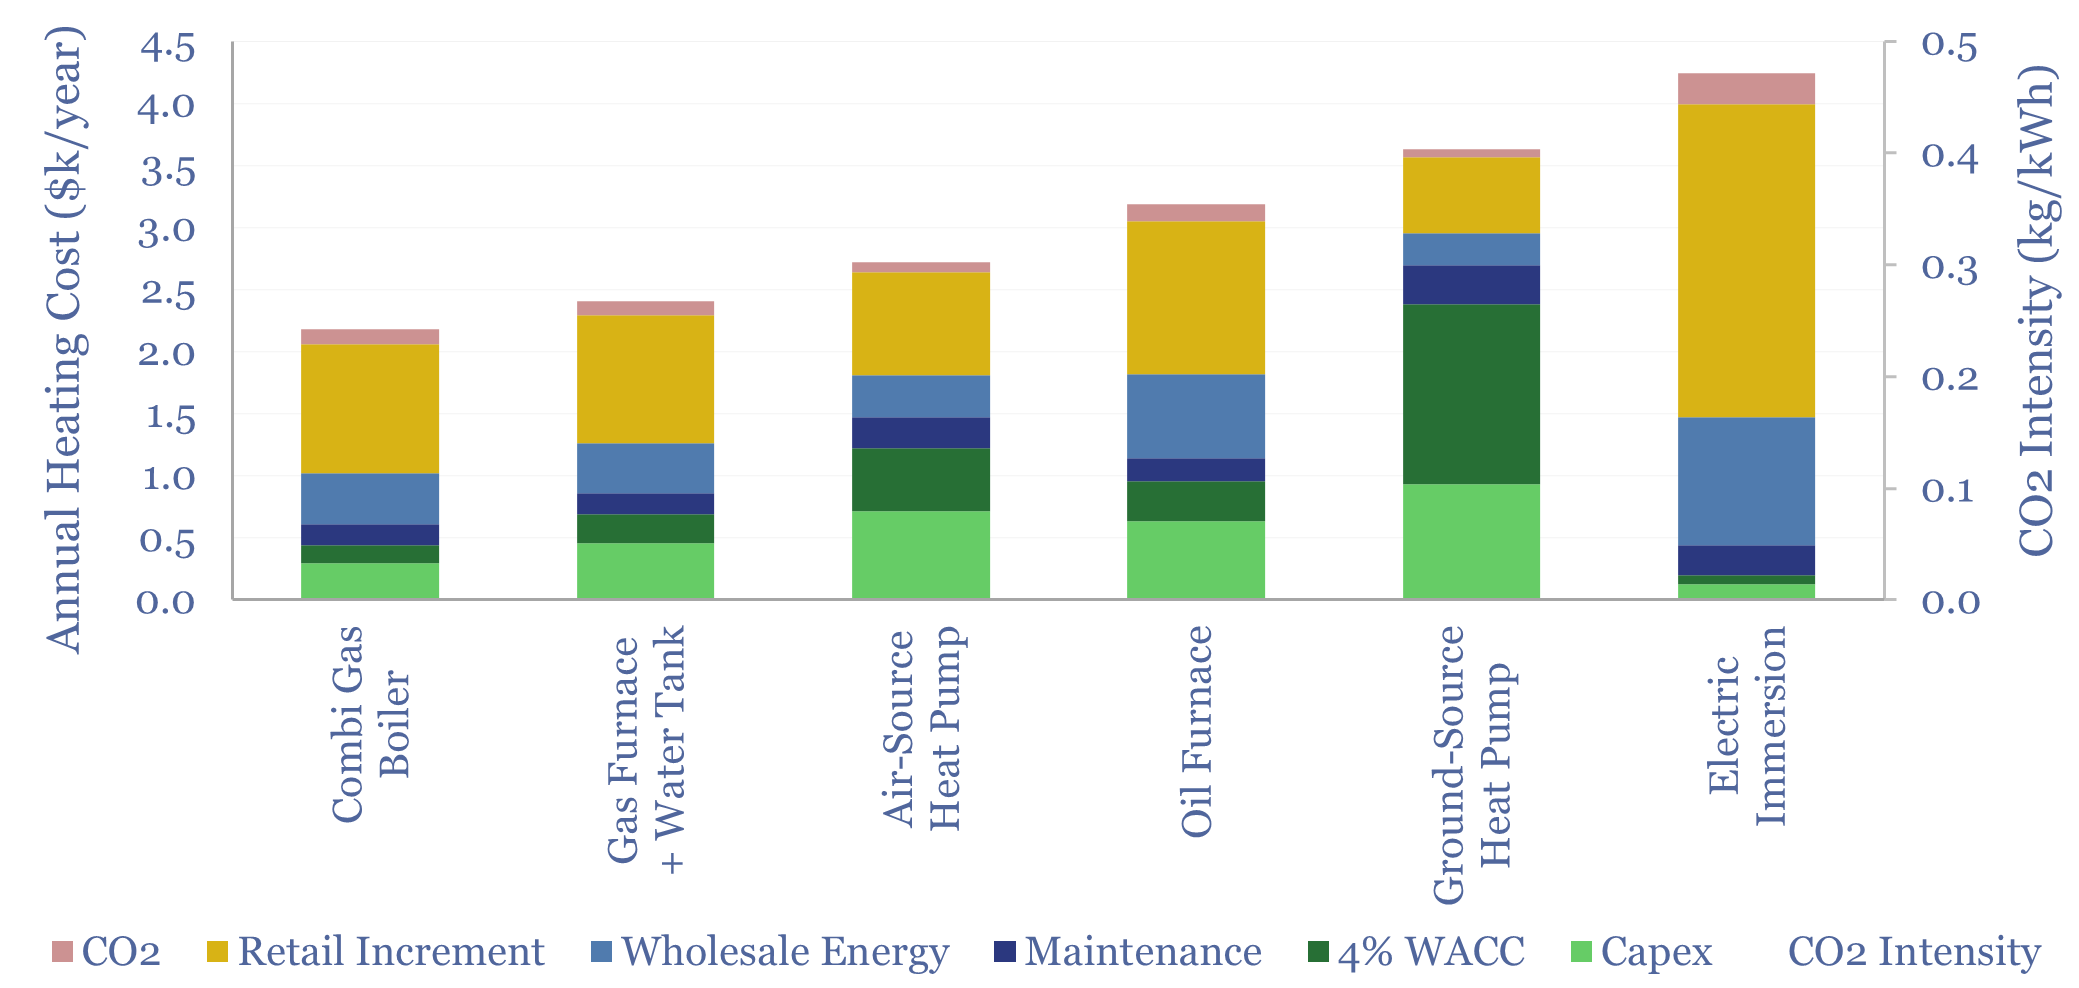
Residential heating costs are compared and contrasted in this data-file, for gas-fired combi boilers, gas furnaces and hot water tanks, oil furnaces and hot water tanks, purely electric heating systems including immersion heaters, air-source heat pumps and ground-source heat pumps. Capex, maintenance and input energy prices can be stress-tested.
-
Could thermoelectric materials change the world?
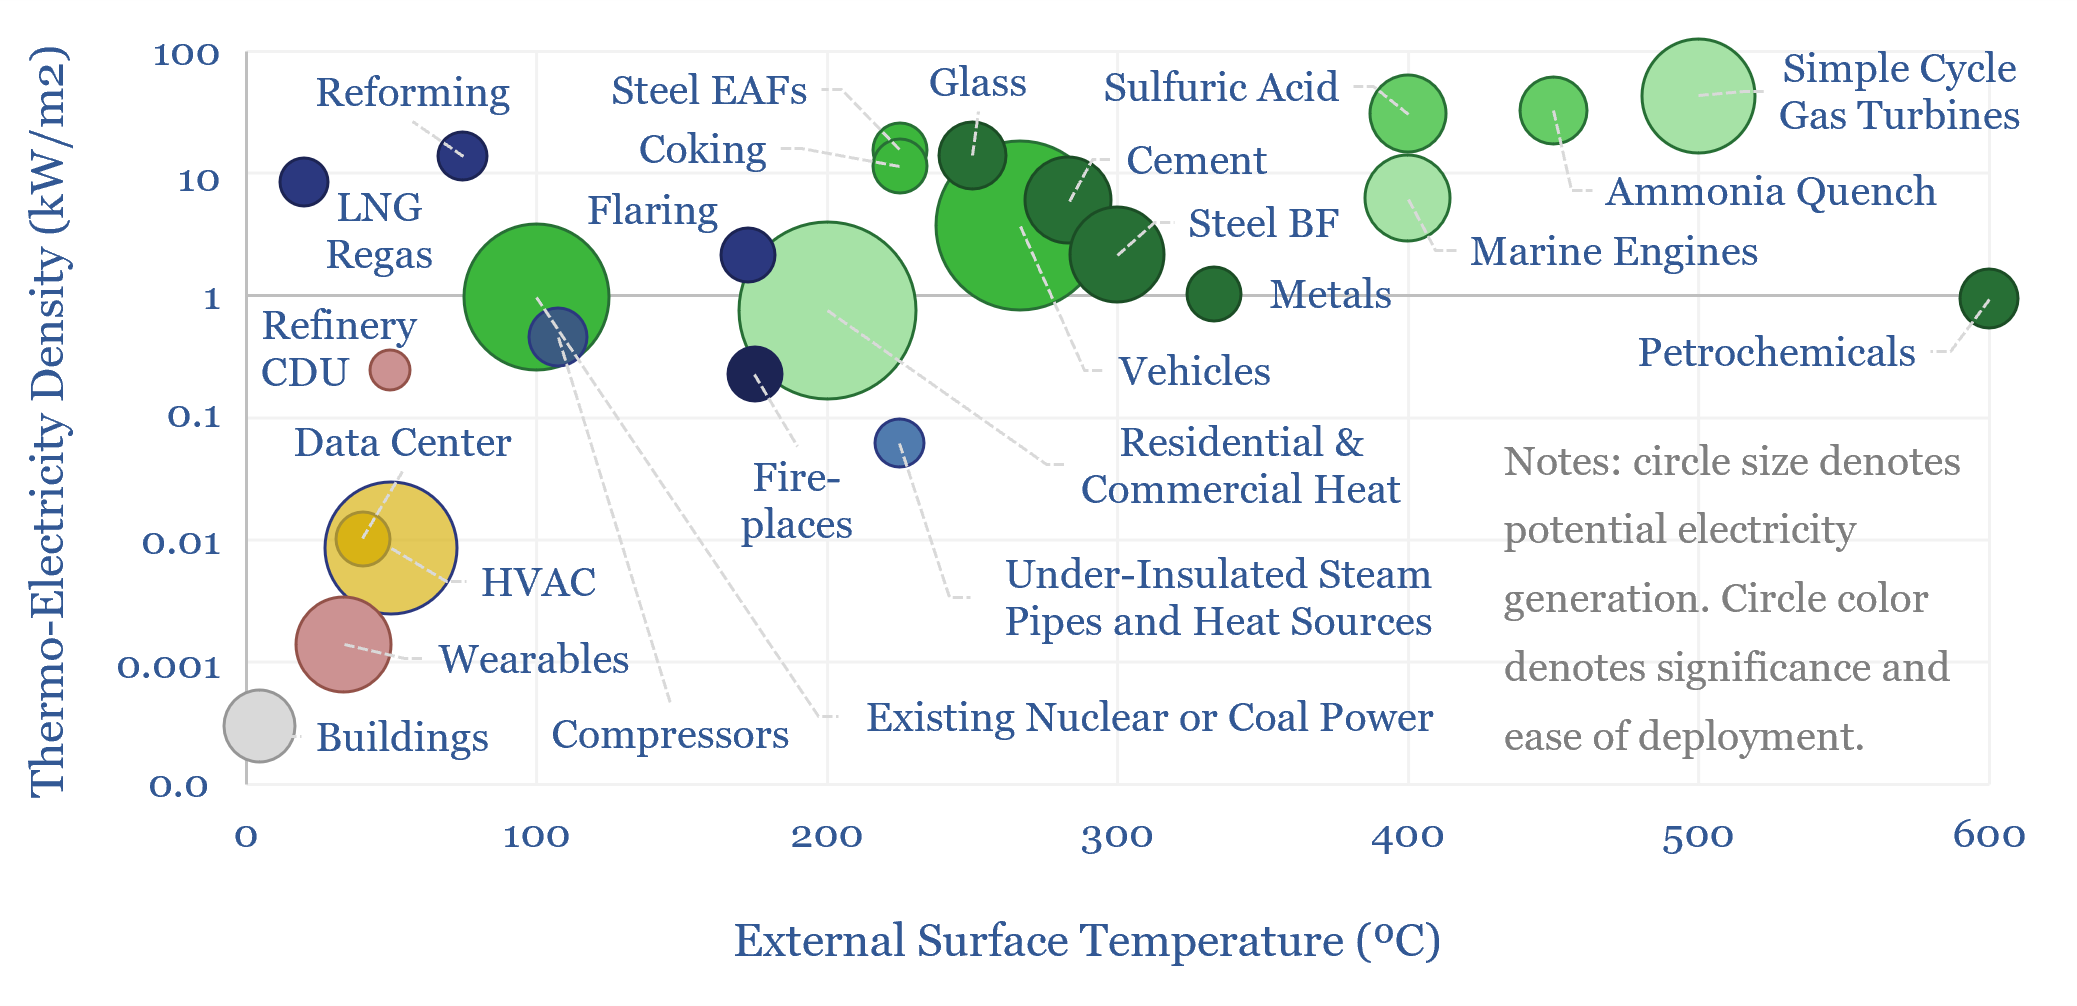
Next-generation thermoelectrics, if discovered by AI, could be a world-changer, converting heat to electricity at 10-50% efficiency, costing $500/kWe. 10,000 TWH of incremental electricity could be generated, worth $500-1,000bn pa. This 17-page report outlines our ‘top ten’ use cases for thermoelectrics.
-
Residential heating energy from first principles?

This data-file models residential heating energy from first principles, taking an example in Northern Europe, for a house with 150m2 floor space, requiring 15MWth of heat (space heating and hot water), which is met by consuming 5MWH-e pa in a heat pump, costing $1,500/year. But this can also be optimized.
-
Internet energy consumption: data, models, forecasts?
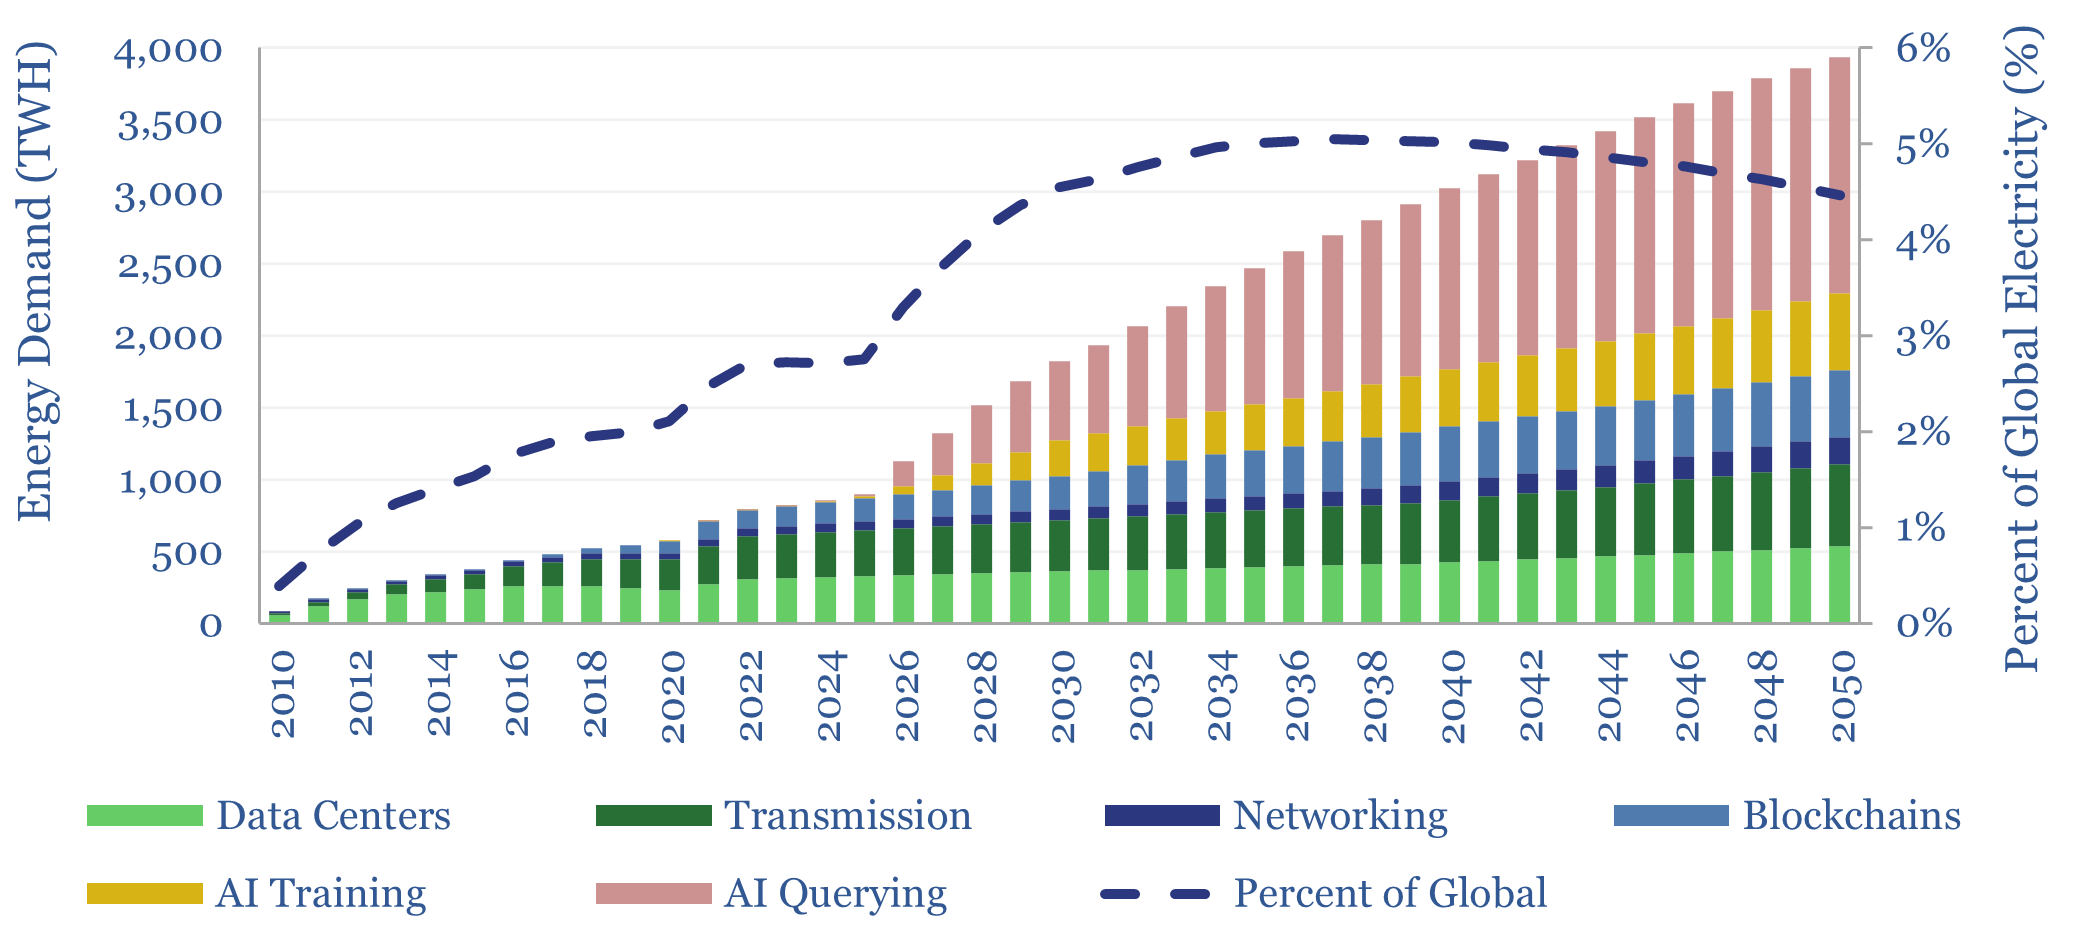
This data-file forecasts the energy consumption of the internet, rising from 800 TWH in 2022 to 2,000 TWH in 2030 and over 4,000 TWH by 2050. The main driver is the energy consumption of AI, plus blockchains, rising traffic, and offset by rising efficiency. Input assumptions to the model can be flexed. Underlying data are…
-
Robotics companies: construction, agriculture, forestry, logistics?
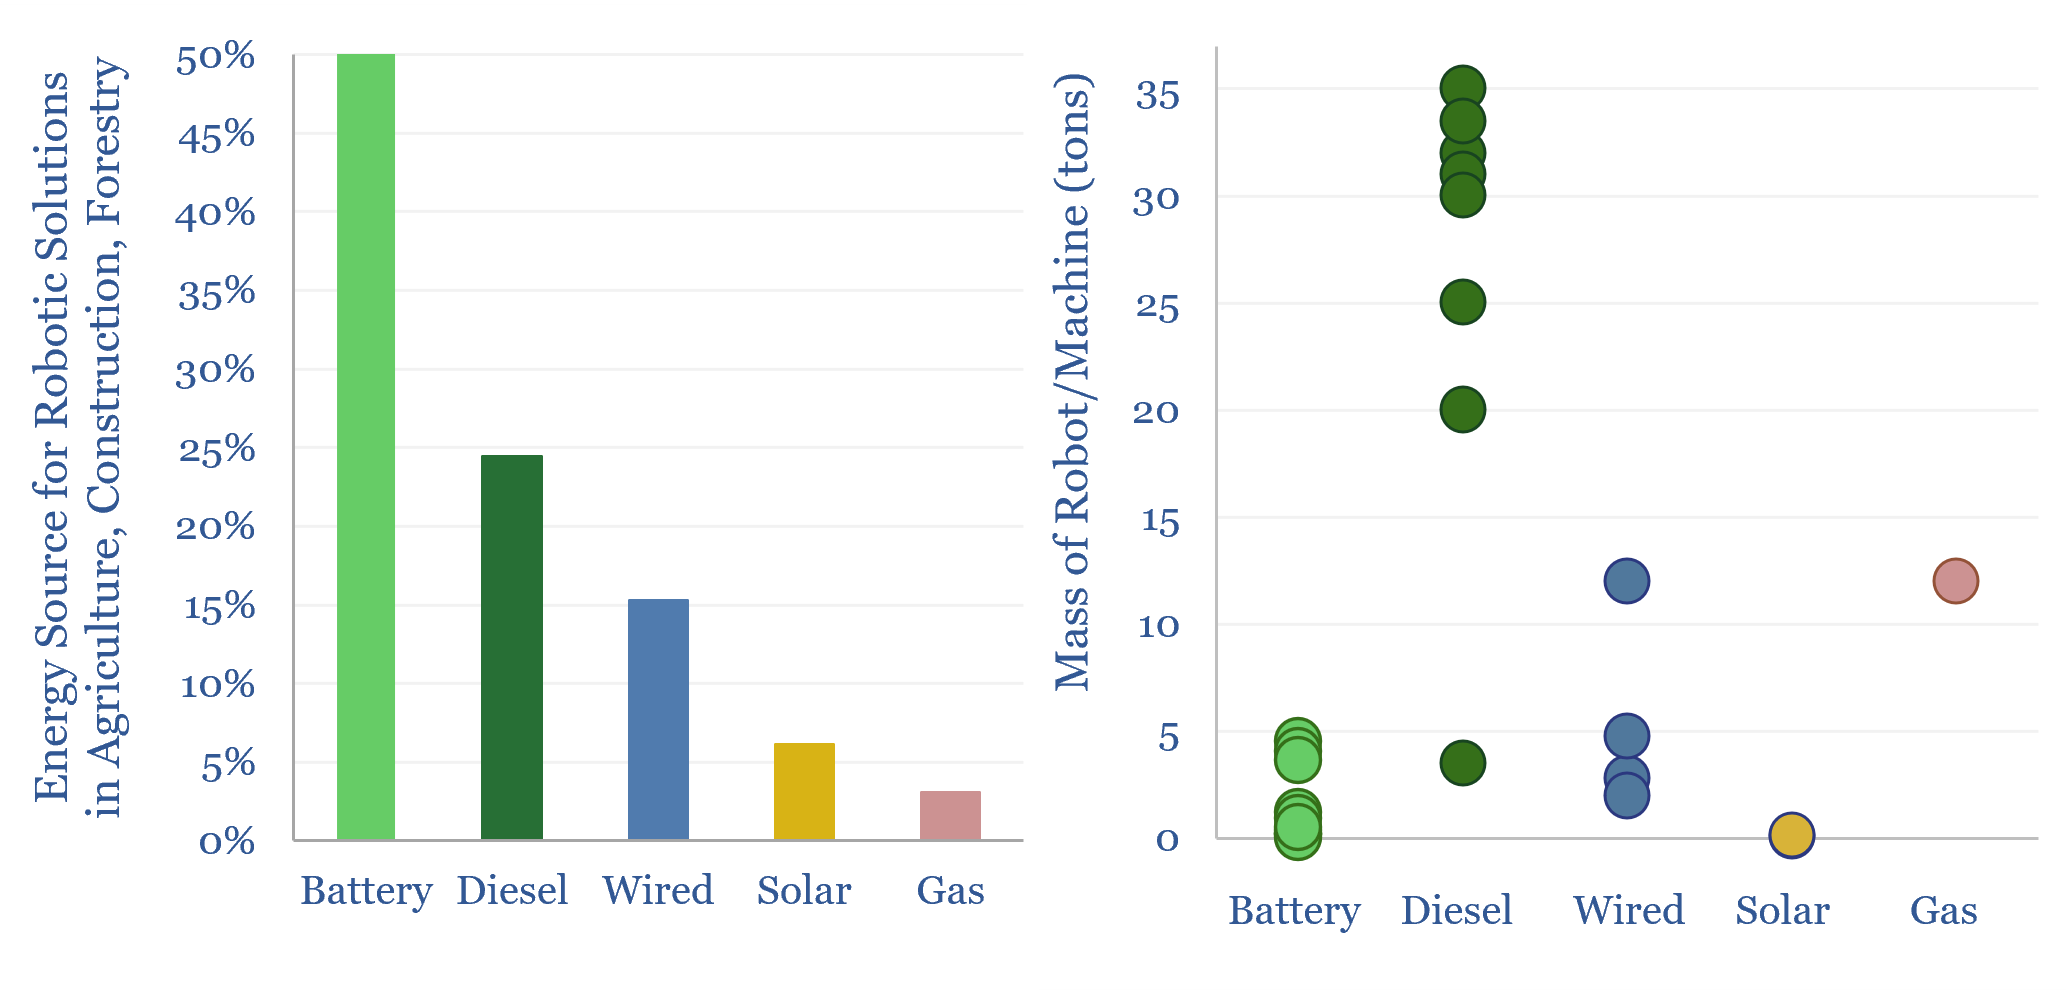
Mobile robotics companies are screened in this data-file, finding transformational impacts in construction, agriculture, forestry, and solar installation. The average robot operates 50% faster and at 50% lower cost than manual methods. 50% of the robots are battery powered, 25% are diesel and 15% are wired. Interesting companies are in the data-file.
-
Compressor costs: a simple overview?
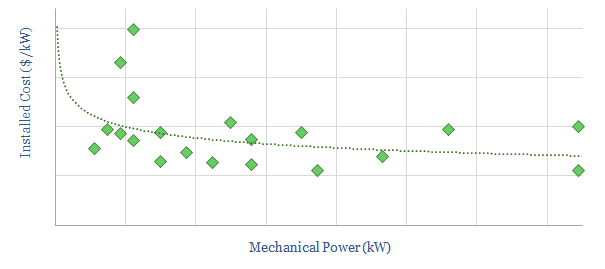
This data-file aims to give a helpful, basic overview of the $40bn pa compressor market, between centrifugal, reciprocating and screw compressors. A typical industrial unit is 50kW and costs $850/kW on an installed basis. Companies and efficiency calculations are also given.
Content by Category
- Batteries (96)
- Biofuels (44)
- Carbon Intensity (48)
- CCS (64)
- CO2 Removals (9)
- Coal (44)
- Commentary (65)
- Company Diligence (105)
- Data Models (930)
- Decarbonization (163)
- Demand (132)
- Digital (92)
- Downstream (47)
- Economic Model (223)
- Energy Efficiency (76)
- Hydrogen (63)
- Industry Data (311)
- LNG (56)
- Materials (86)
- Metals (90)
- Midstream (45)
- Natural Gas (163)
- Nature (76)
- Nuclear (28)
- Oil (179)
- Patents (39)
- Plastics (44)
- Power Grids (157)
- Renewables (153)
- Screen (139)
- Semiconductors (36)
- Shale (58)
- Solar (73)
- Supply-Demand (53)
- Vehicles (94)
- Video (24)
- Wind (46)
- Written Research (411)