Energy Efficiency
-
Costs of delivery drones: the energy economics?
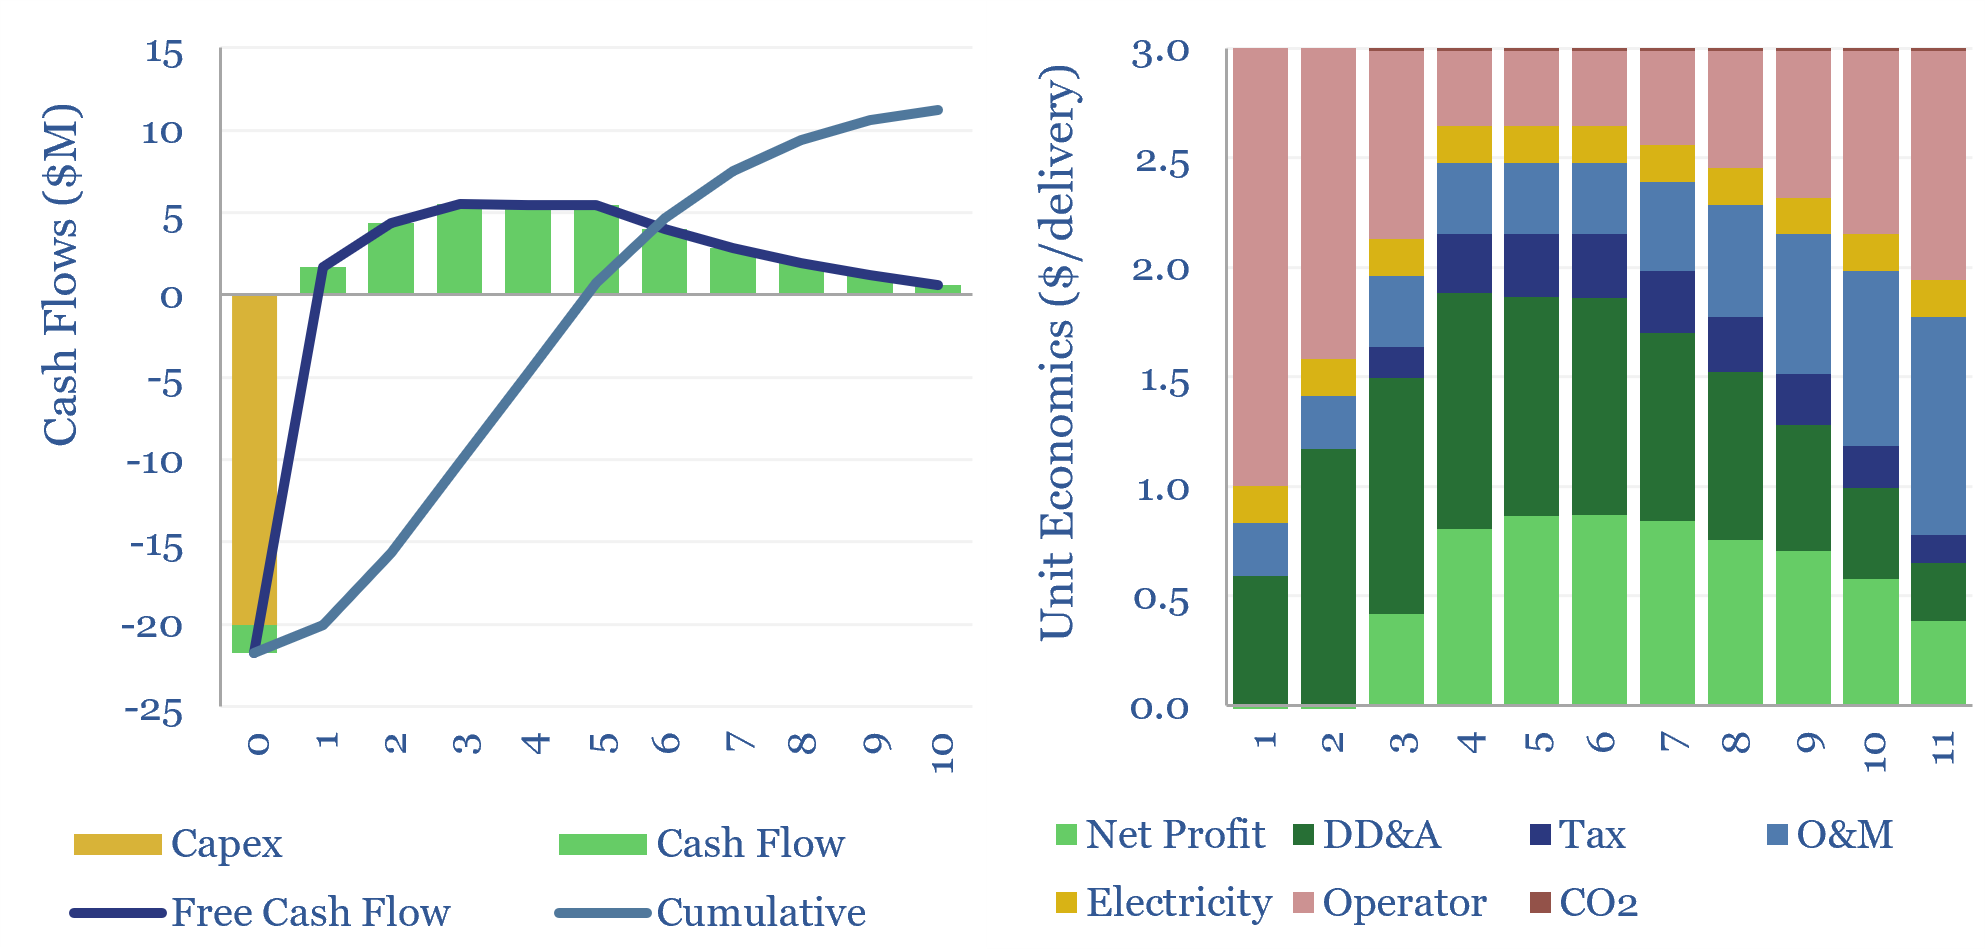
The energy economics of delivery drones, which can travel autonomously, over 30km at 100kmph, are captured in this data-file. In our base case, a delivery drone that costs $20k, and makes 8 deliveries per day, must charge a fee of $3/delivery to generate a 10% IRR. Costs, speeds and energy use can be 5-20x superior…
-
Residential heating costs: boilers, furnaces, electric and heat pumps?
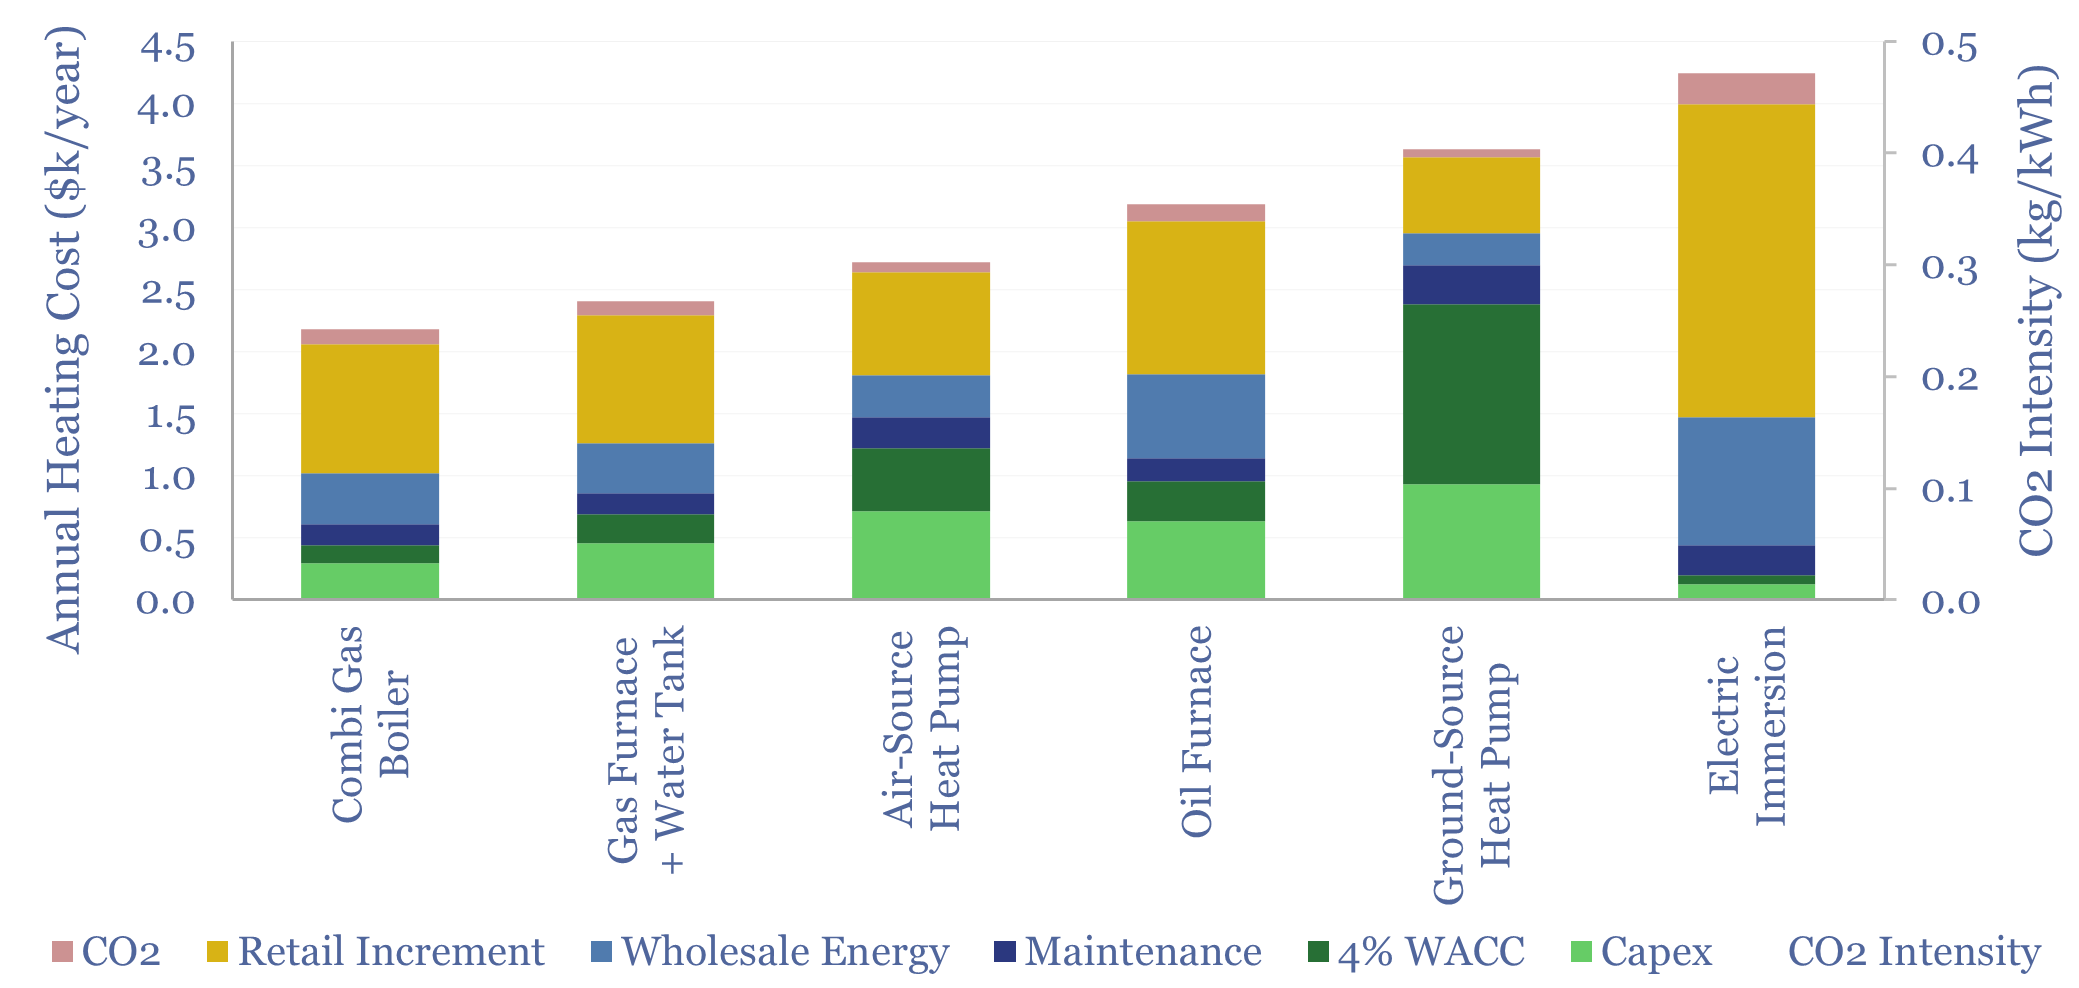
Residential heating costs are compared and contrasted in this data-file, for gas-fired combi boilers, gas furnaces and hot water tanks, oil furnaces and hot water tanks, purely electric heating systems including immersion heaters, air-source heat pumps and ground-source heat pumps. Capex, maintenance and input energy prices can be stress-tested.
-
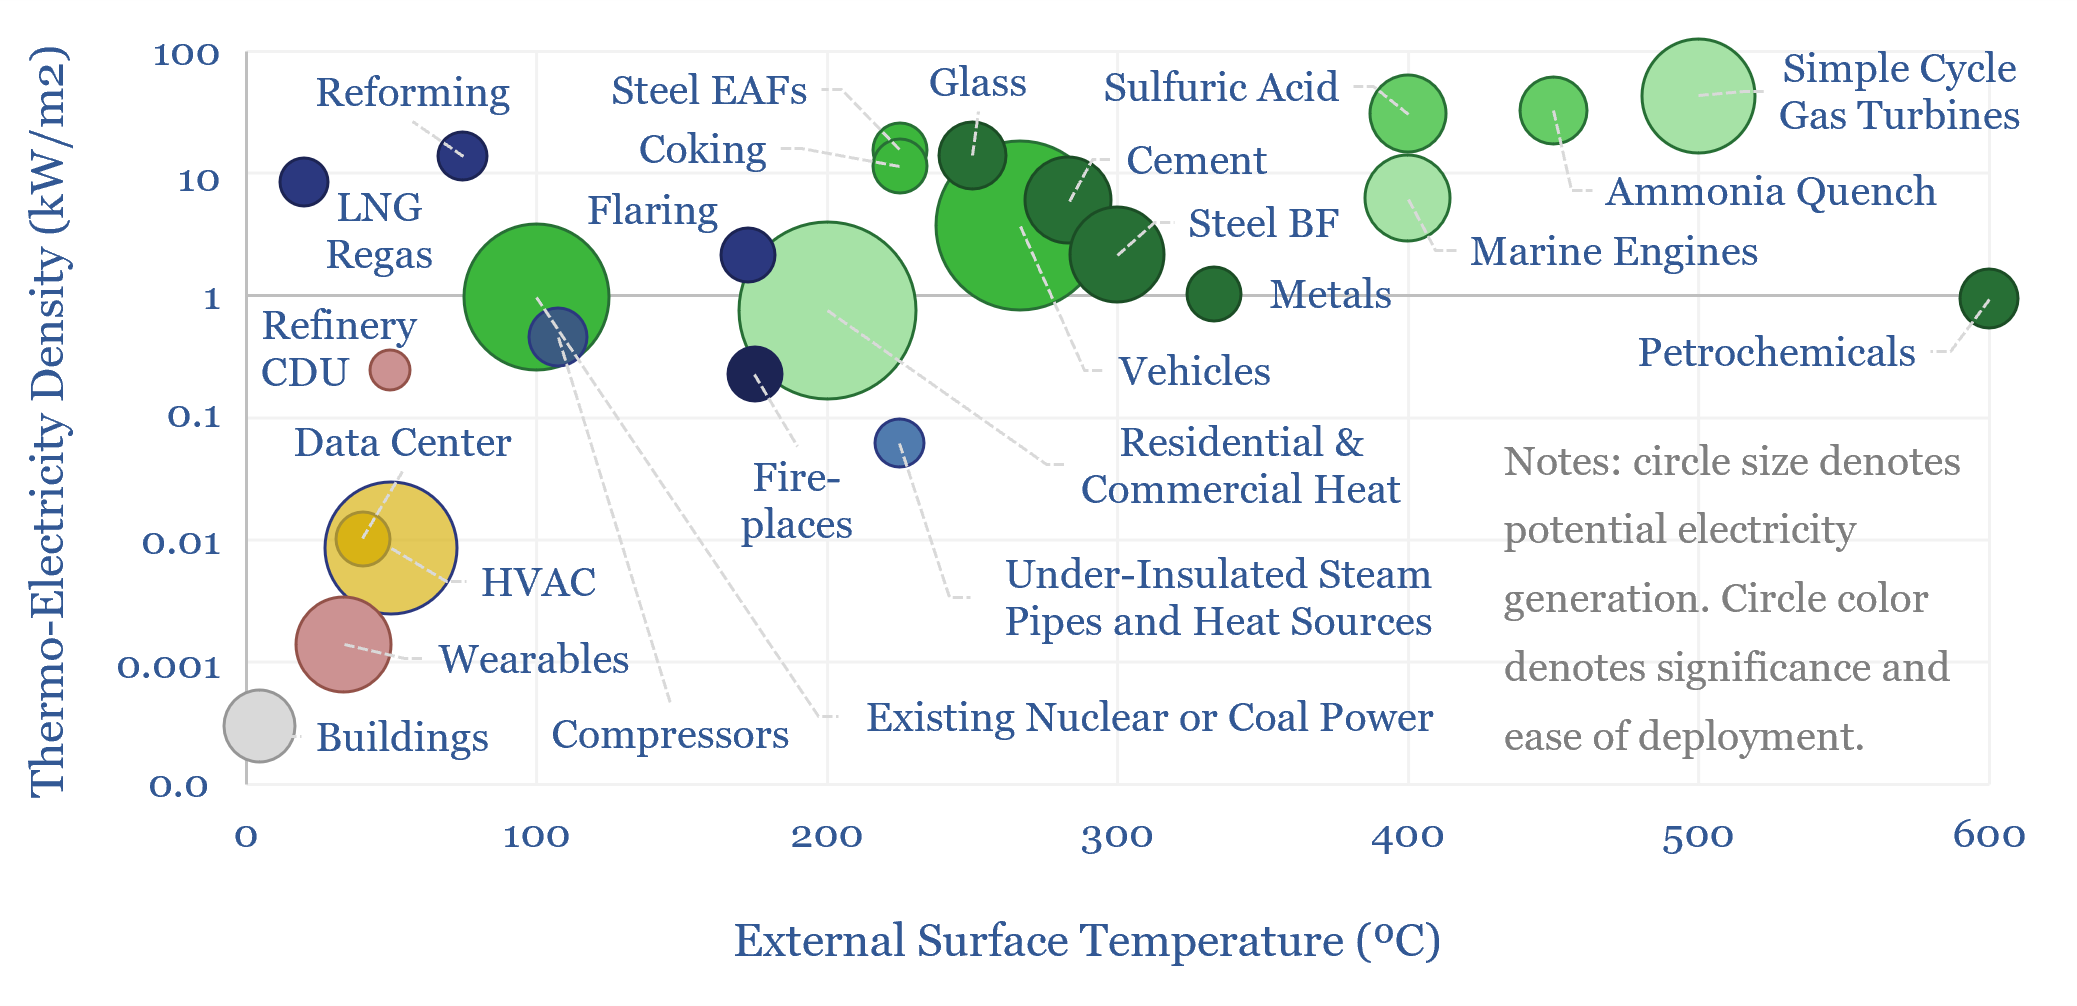
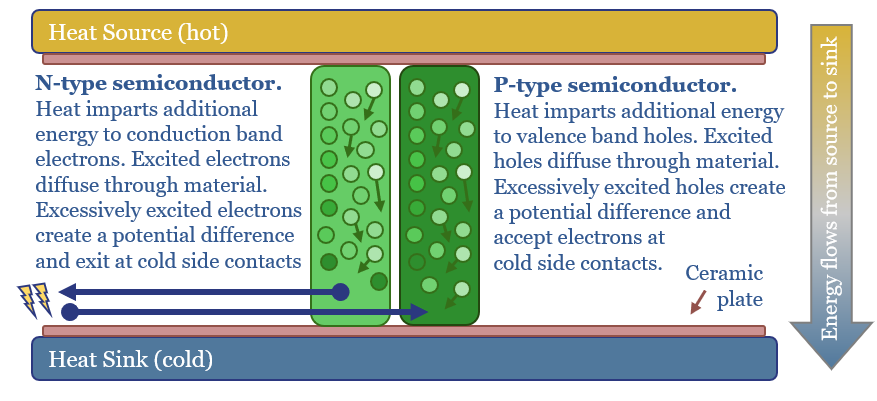
Could thermoelectric materials change the world?

Next-generation thermoelectrics, if discovered by AI, could be a world-changer, converting heat to electricity at 10-50% efficiency, costing $500/kWe. 10,000 TWH of incremental electricity could be generated, worth $500-1,000bn pa. This 17-page report outlines our ‘top ten’ use cases for thermoelectrics.
-
Industrial insulation: heat losses and temperatures?

This data-file is a calculator for steam pipe insulation, calculating heat losses and external temperatures of hot surfaces from first principles, as a function of the industrial insulation thickness. Higher energy prices incentivize additional insulation, although there can be diminishing returns.
-
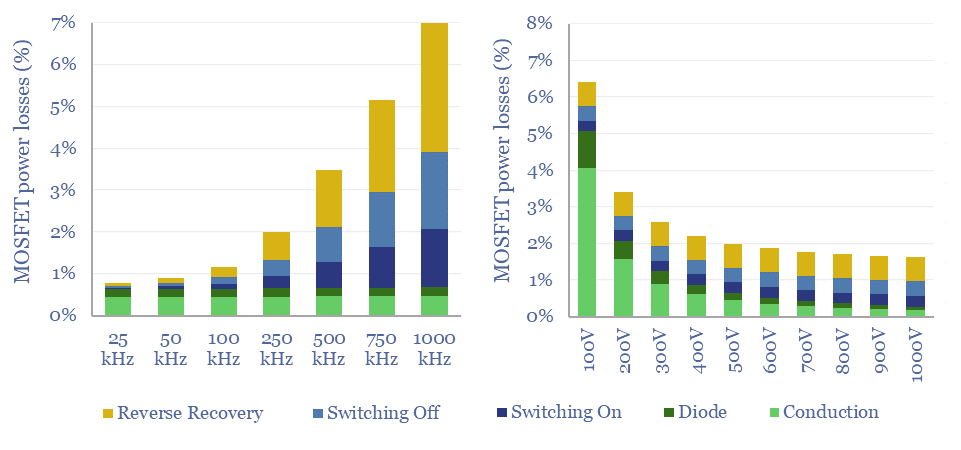
MOSFETs: energy use and power loss calculator?

MOSFETs are fast-acting digital switches, used to transform electricity, across new energies and digital devices. MOSFET power losses are built up from first principles in this data-file, averaging 2% per MOSFET, with a range of 1-10% depending on voltage, switching, on resistance, operating temperature and reverse recovery charge.
-
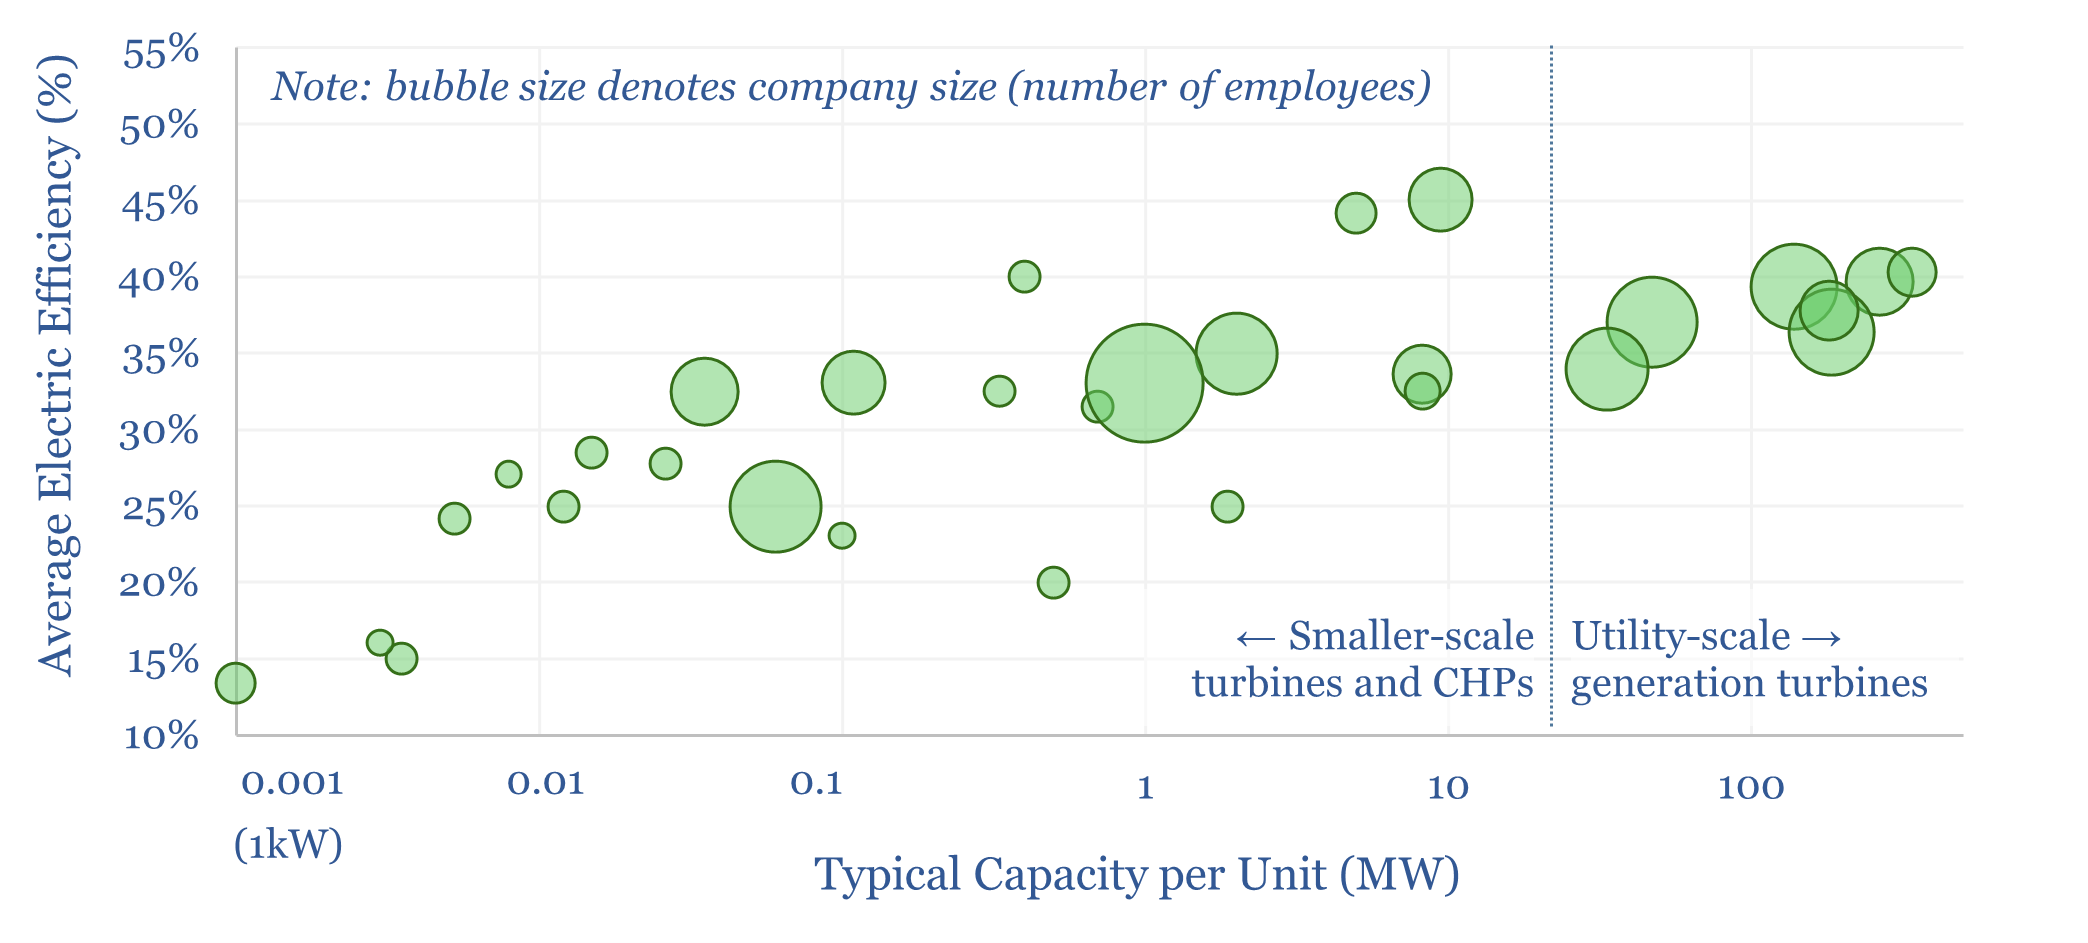
Gas turbine manufacturing by company by facility?

This data-file profiles gas turbines and gas turbine manufacturing capacity by company. 30 companies are profiled, including the ‘big three’ – GE Vernova, Siemens Energy and Mitsubishi Heavy. 100 gas turbines are profiles. And 25 gas turbine manufacturing facilities are also covered, in order to estimate gas turbine manufacturing capacity by region and by company.
-
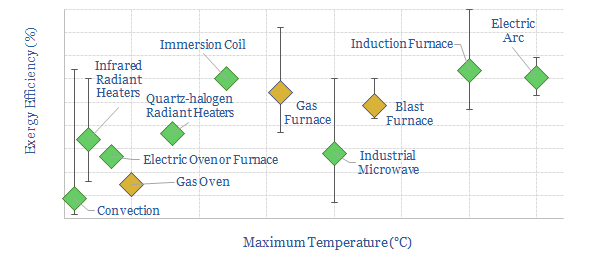
Industrial heat: an overview?

Industrial heat consumes over 10% of all global primary energy. This data-file is a summary of processes that use industrial heat, the specific heating technologies, temperatures, residence times, reactor designs, energy intensity (in kWh/ton) and efficiency, ranging across 20 process technologies and heating technology types.
-
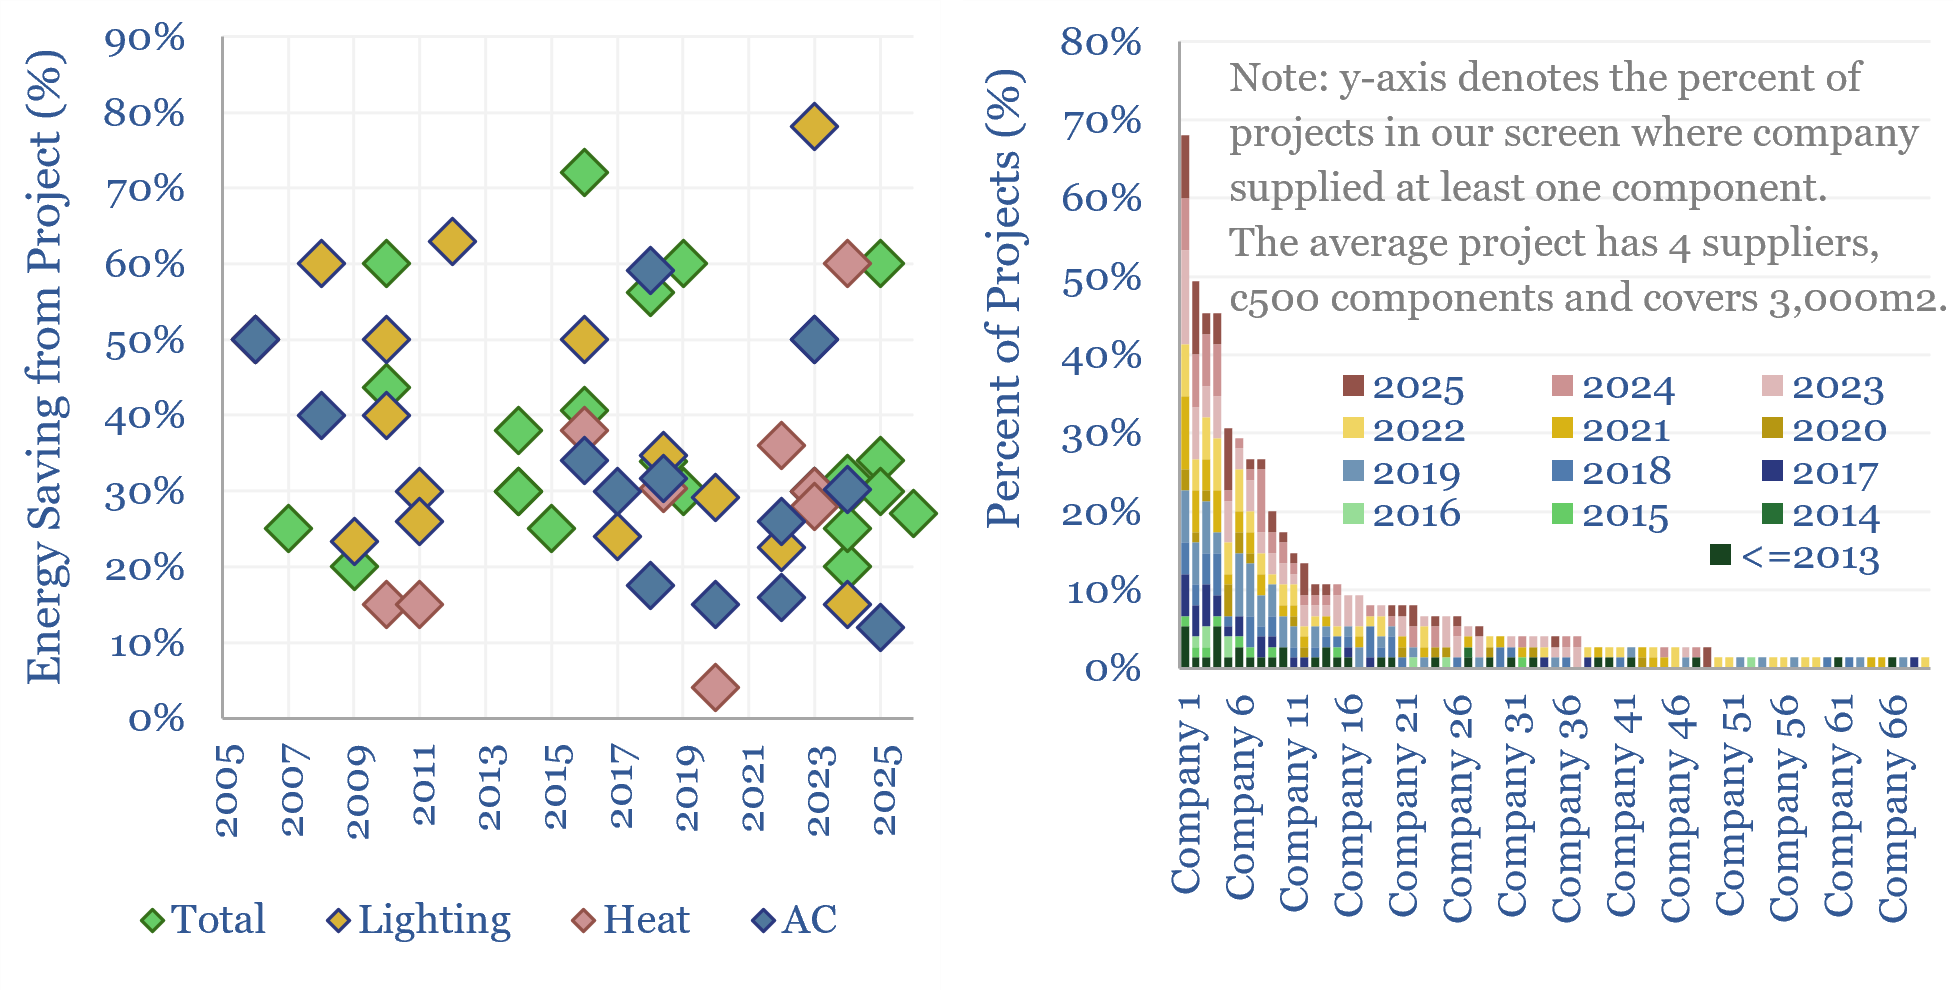
Building automation: AI, KNX and smart energy savings?

Building automation via smart energy projects are captured in this data-file, using sensors, KNX and/or AI. Optimizing lighting, heating, AC and overall energy use saves 35% energy on average. Leading suppliers of the underlying sensors and drivers are also tabulated across past projects.
-
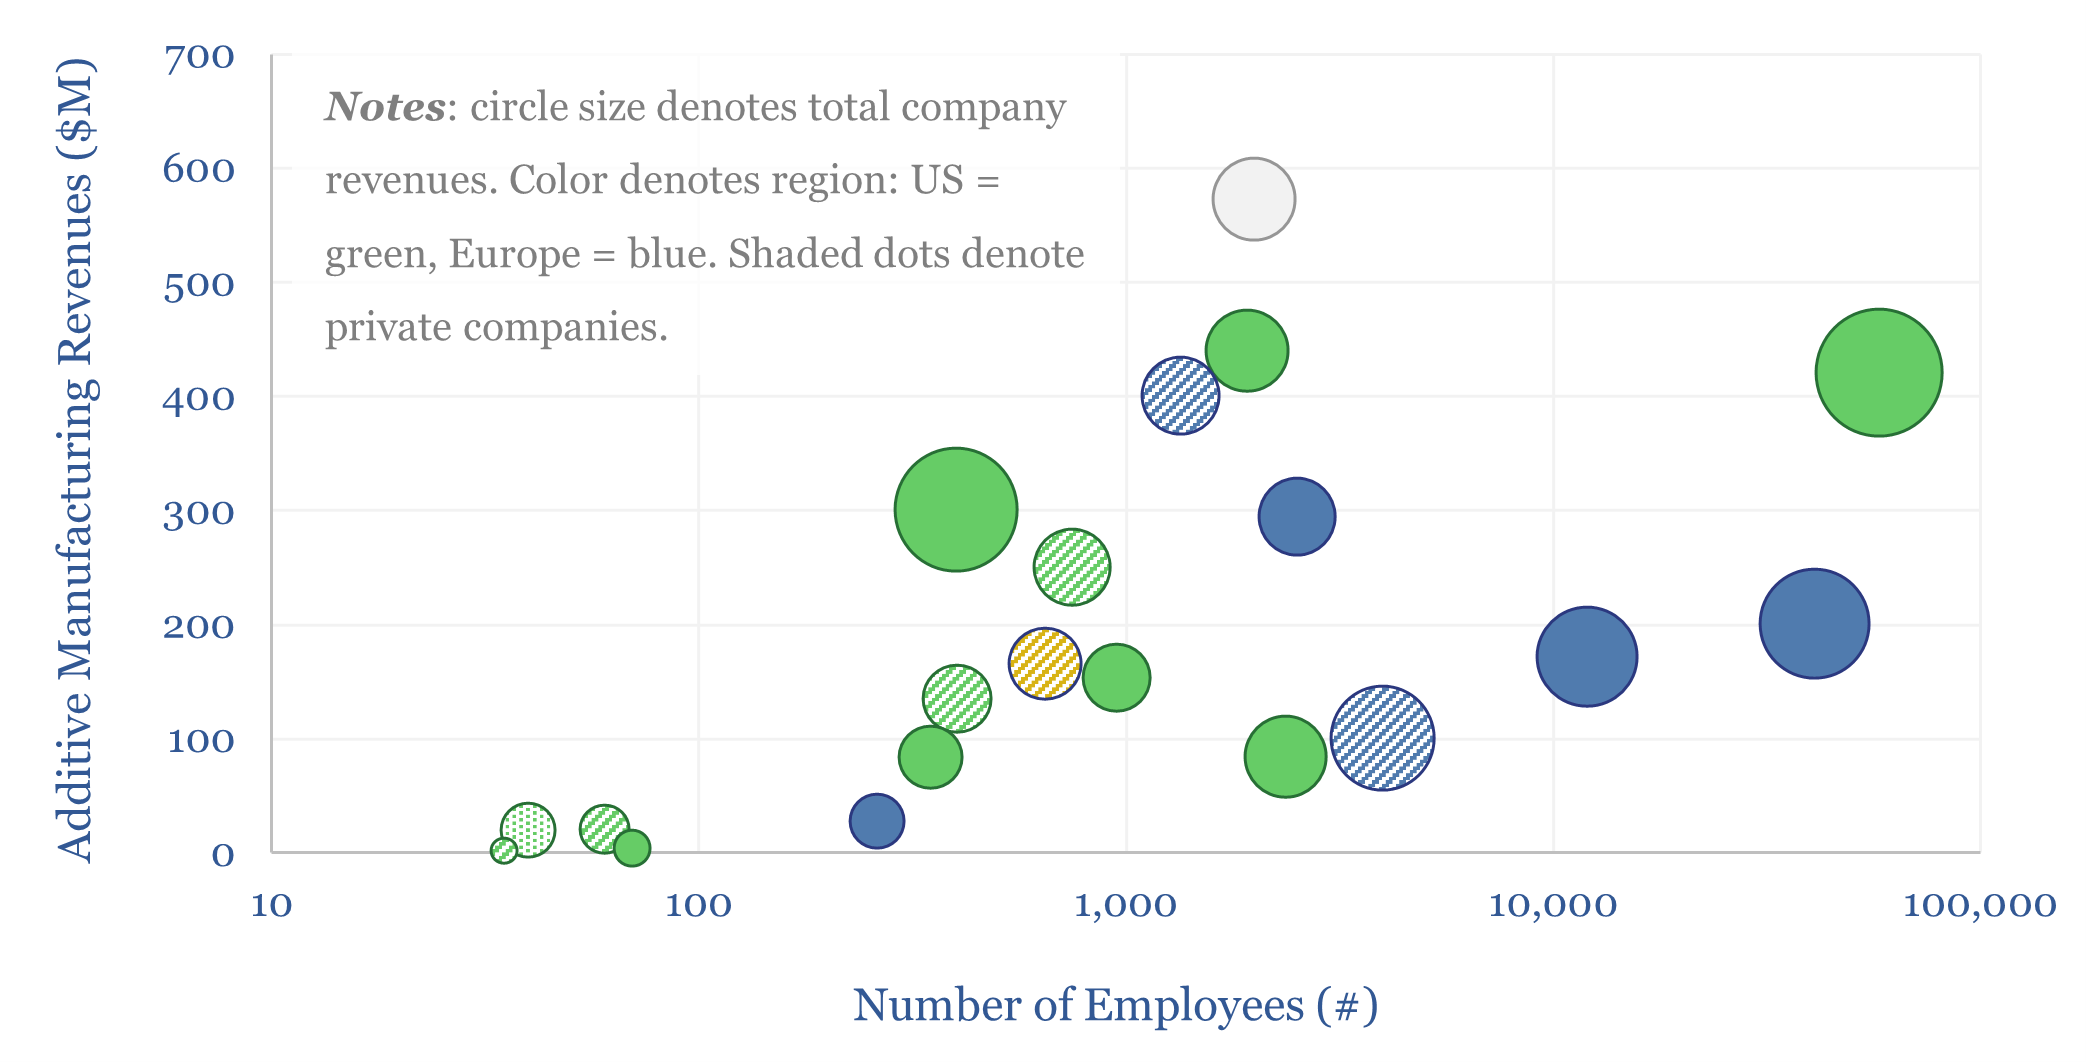
Additive manufacturing: technology leaders?

Additive manufacturing companies are screened in this data-file, across 20 technology leaders. We have also tabulated 25 case studies, where AM reduces weight by 40%, cost by 50%, and lead-time by 60%. The industry remains highly competitive. But could it be turning a corner? Especially for metal components in capital goods and aerospace?
-
Seebeck Effect: are thermoelectrics the next solar?

Solar semiconductors have changed the world, converting light into clean electricity. Hence can thermoelectric semiconductors follow the same path, converting heat into electricity with no moving parts? This 14-page report reviews the opportunity, challenges, efficiency, costs and companies.

Content by Category
- Batteries (96)
- Biofuels (44)
- Carbon Intensity (48)
- CCS (64)
- CO2 Removals (9)
- Coal (44)
- Commentary (65)
- Company Diligence (105)
- Data Models (928)
- Decarbonization (163)
- Demand (131)
- Digital (92)
- Downstream (47)
- Economic Model (222)
- Energy Efficiency (76)
- Hydrogen (63)
- Industry Data (311)
- LNG (56)
- Materials (86)
- Metals (89)
- Midstream (45)
- Natural Gas (163)
- Nature (76)
- Nuclear (28)
- Oil (178)
- Patents (39)
- Plastics (44)
- Power Grids (156)
- Renewables (153)
- Screen (139)
- Semiconductors (36)
- Shale (58)
- Solar (72)
- Supply-Demand (53)
- Vehicles (94)
- Video (24)
- Wind (46)
- Written Research (410)