Screen
-
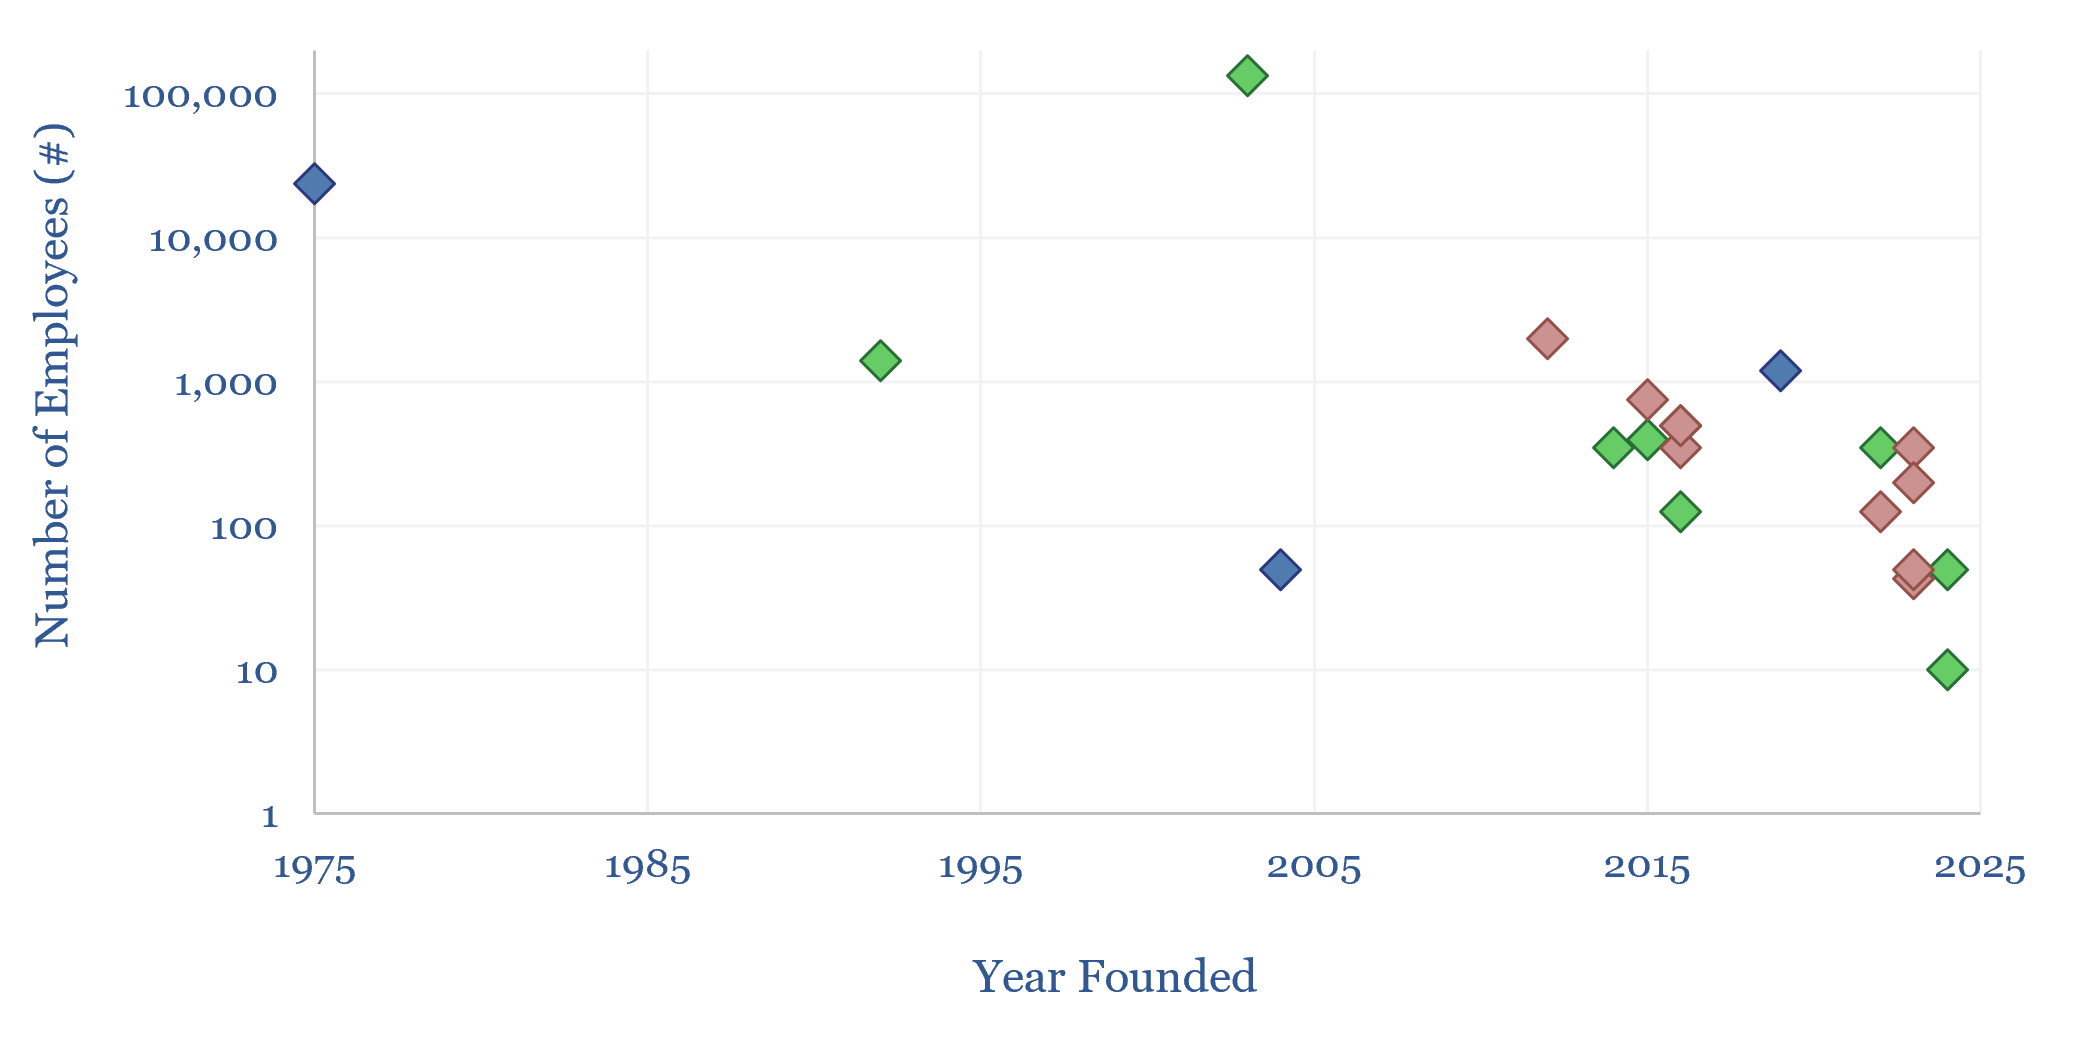
Energy technology and energy transition companies?
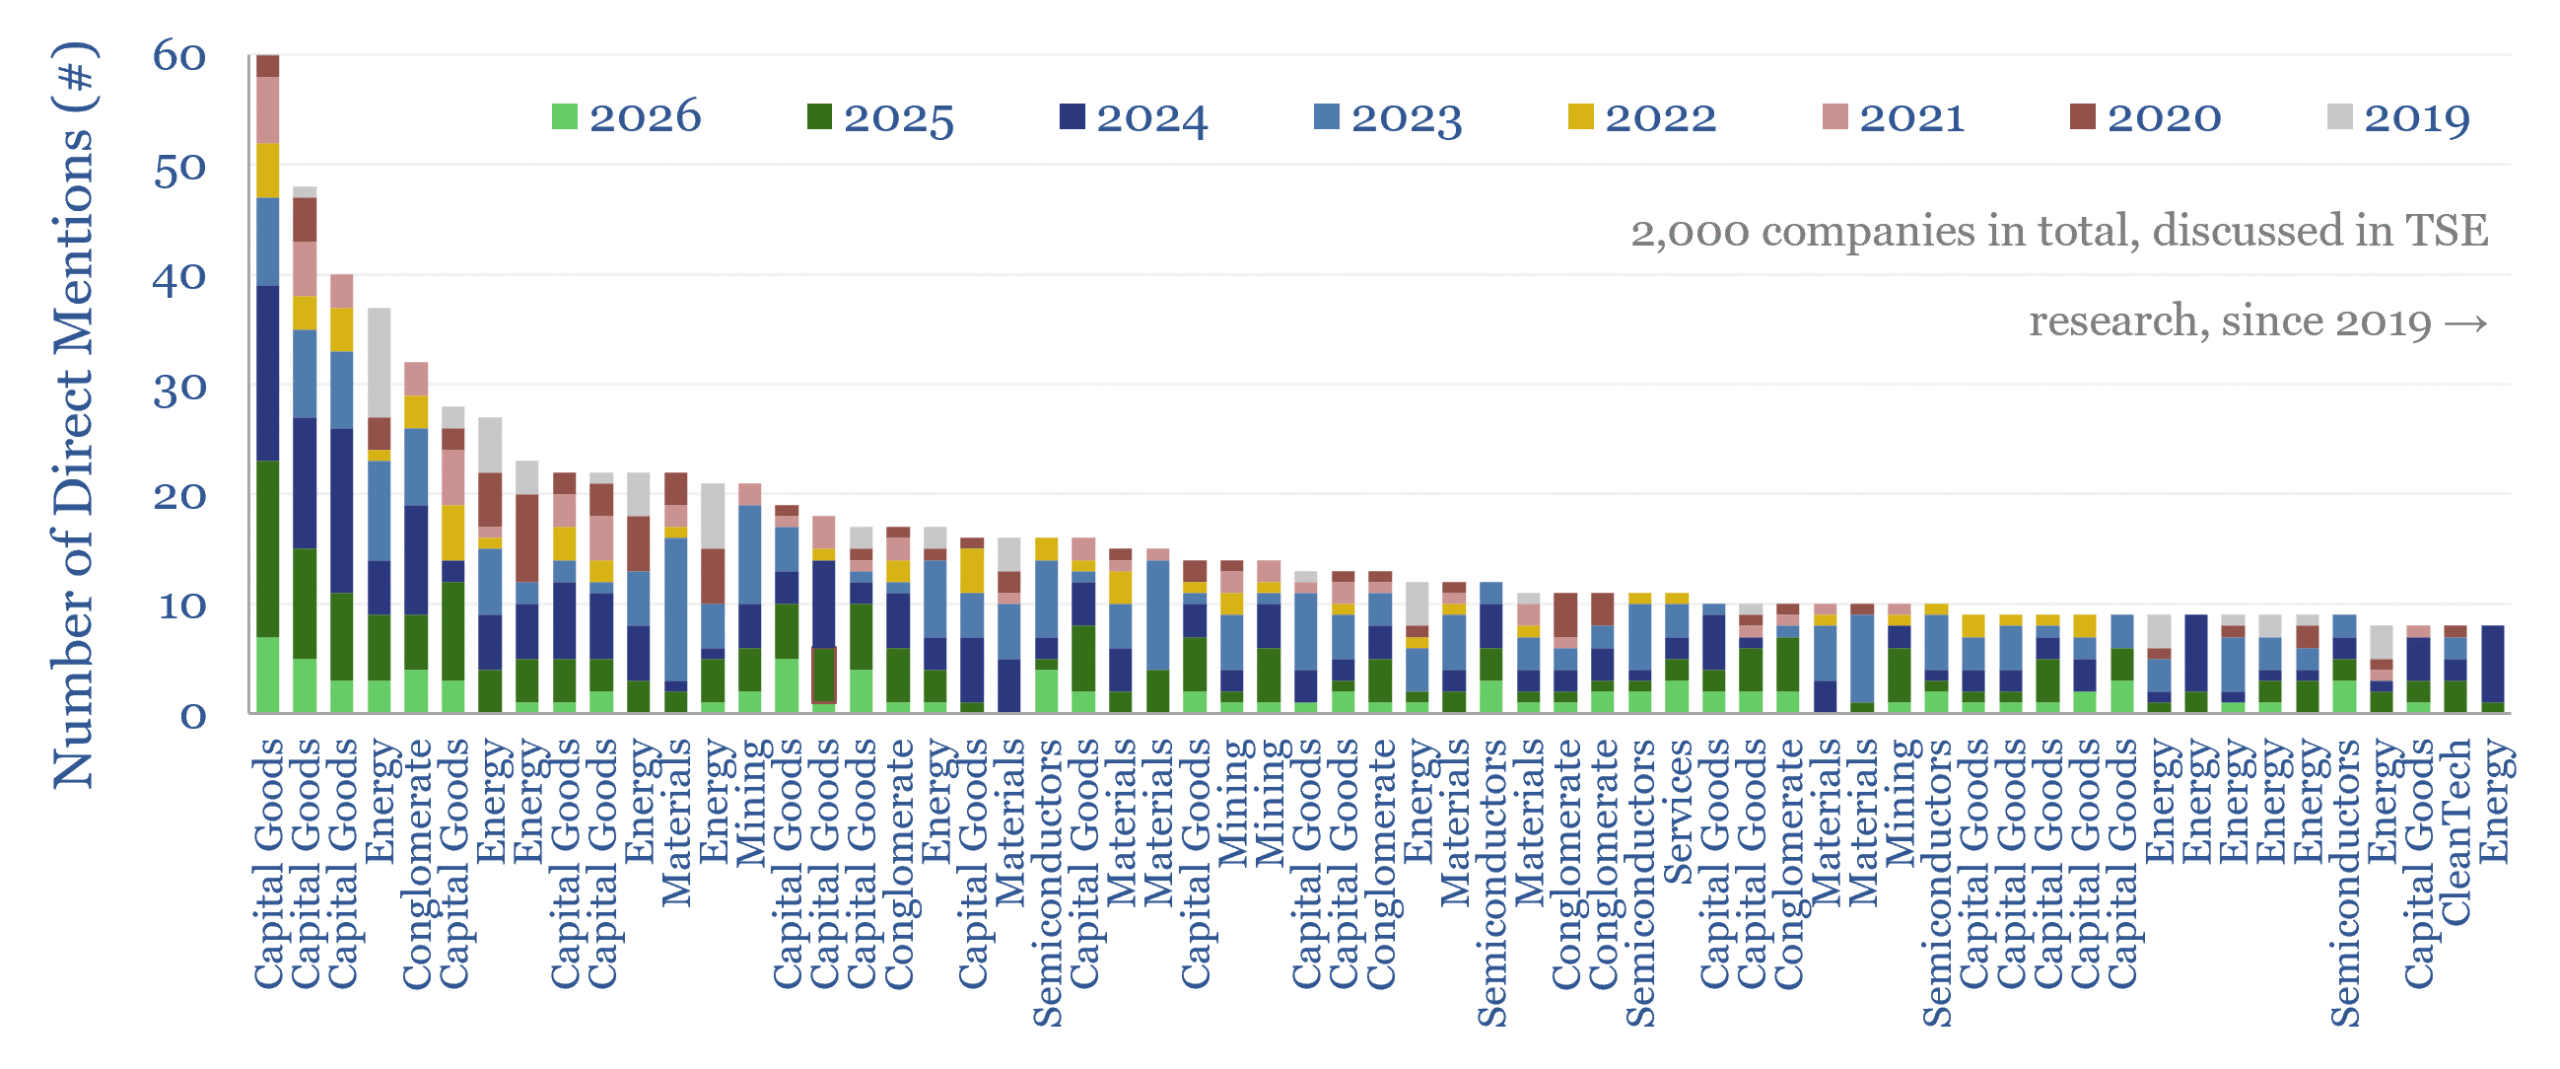
This database contains a record of every company that has ever been mentioned across Thunder Said Energy’s energy technology research, as a useful reference for TSE’s clients. As of July-2026, the database summarizes 4,000 mentions of 2,000 energy transition companies, broader energy producing and consuming companies; their size, focus and a summary of our key…
-
Market concentration by industry in the energy transition?
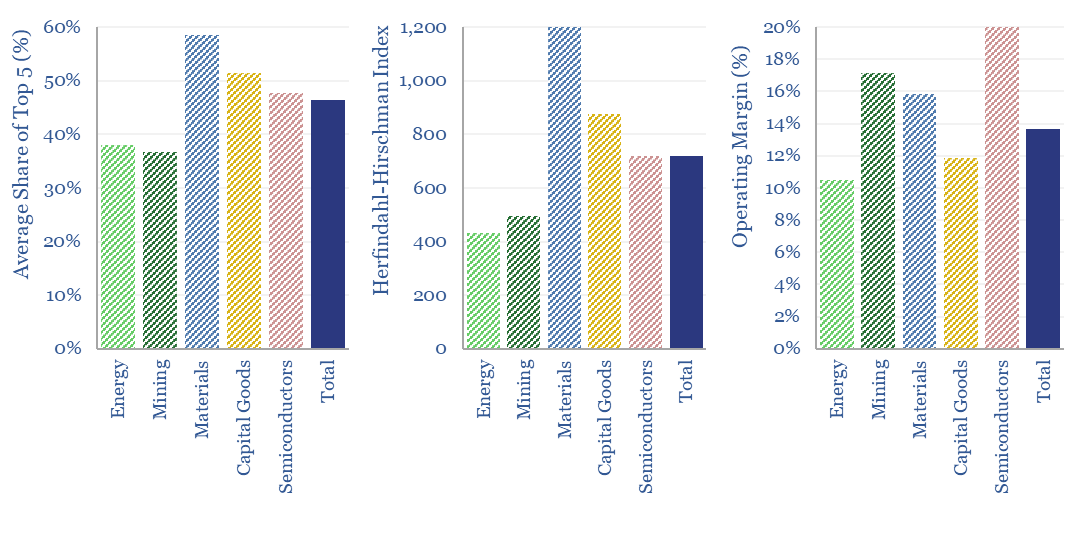
What is the market concentration by industry in energy, mining, materials, semiconductors, capital goods and other sectors that matter in the energy transition? The top five firms tend to control 45% of their respective markets, yielding a ‘Herfindahl Hirschman Index’ (HHI) of 700.
-
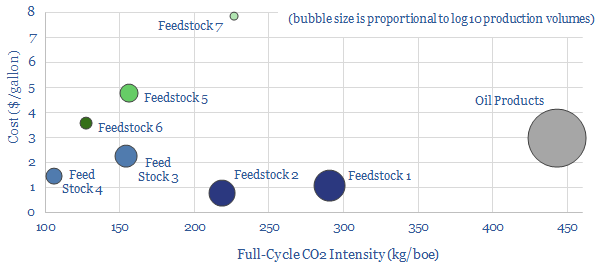
Biofuel technologies: an overview?

Biofuels are currently displacing 3.5Mboed of oil and gas. But they are not carbon-free, and their weighted average CO2 emissions are only c50% lower. This data-file breaks down the biofuels market across seven key feedstocks, to help identify which opportunities can scale for the lowest costs and CO2, versus others that require further technical progress.
-
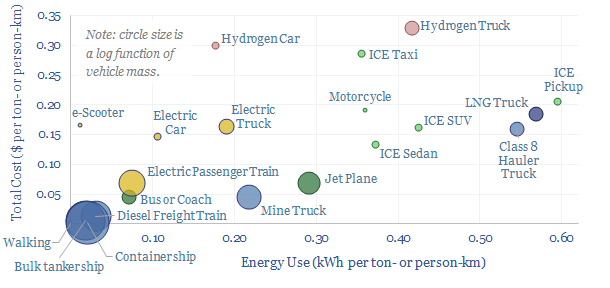
Vehicles: energy transition conclusions?

Vehicles transport people and freight around the world, explaining 70% of global oil demand, 30% of global energy use, 20% of global CO2e emissions. This overview summarizes all of our research into vehicles, and key conclusions for the energy transition.
-
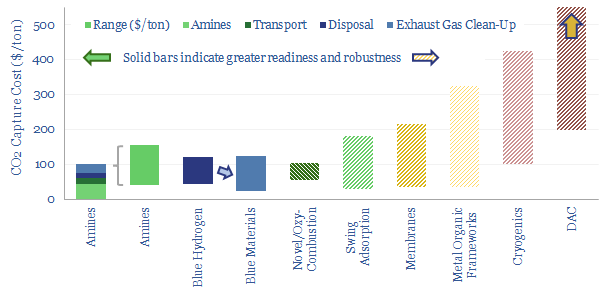
Carbon capture and storage: research conclusions?

Carbon capture and storage (CCS) prevents CO2 from entering the atmosphere. Options include the amine process, blue hydrogen, novel combustion technologies and cutting edge sorbents and membranes. Total CCS costs range from $80-130/ton. This article summarizes conclusions from our carbon capture and storage research.
-
Inertial sensors: leading companies?
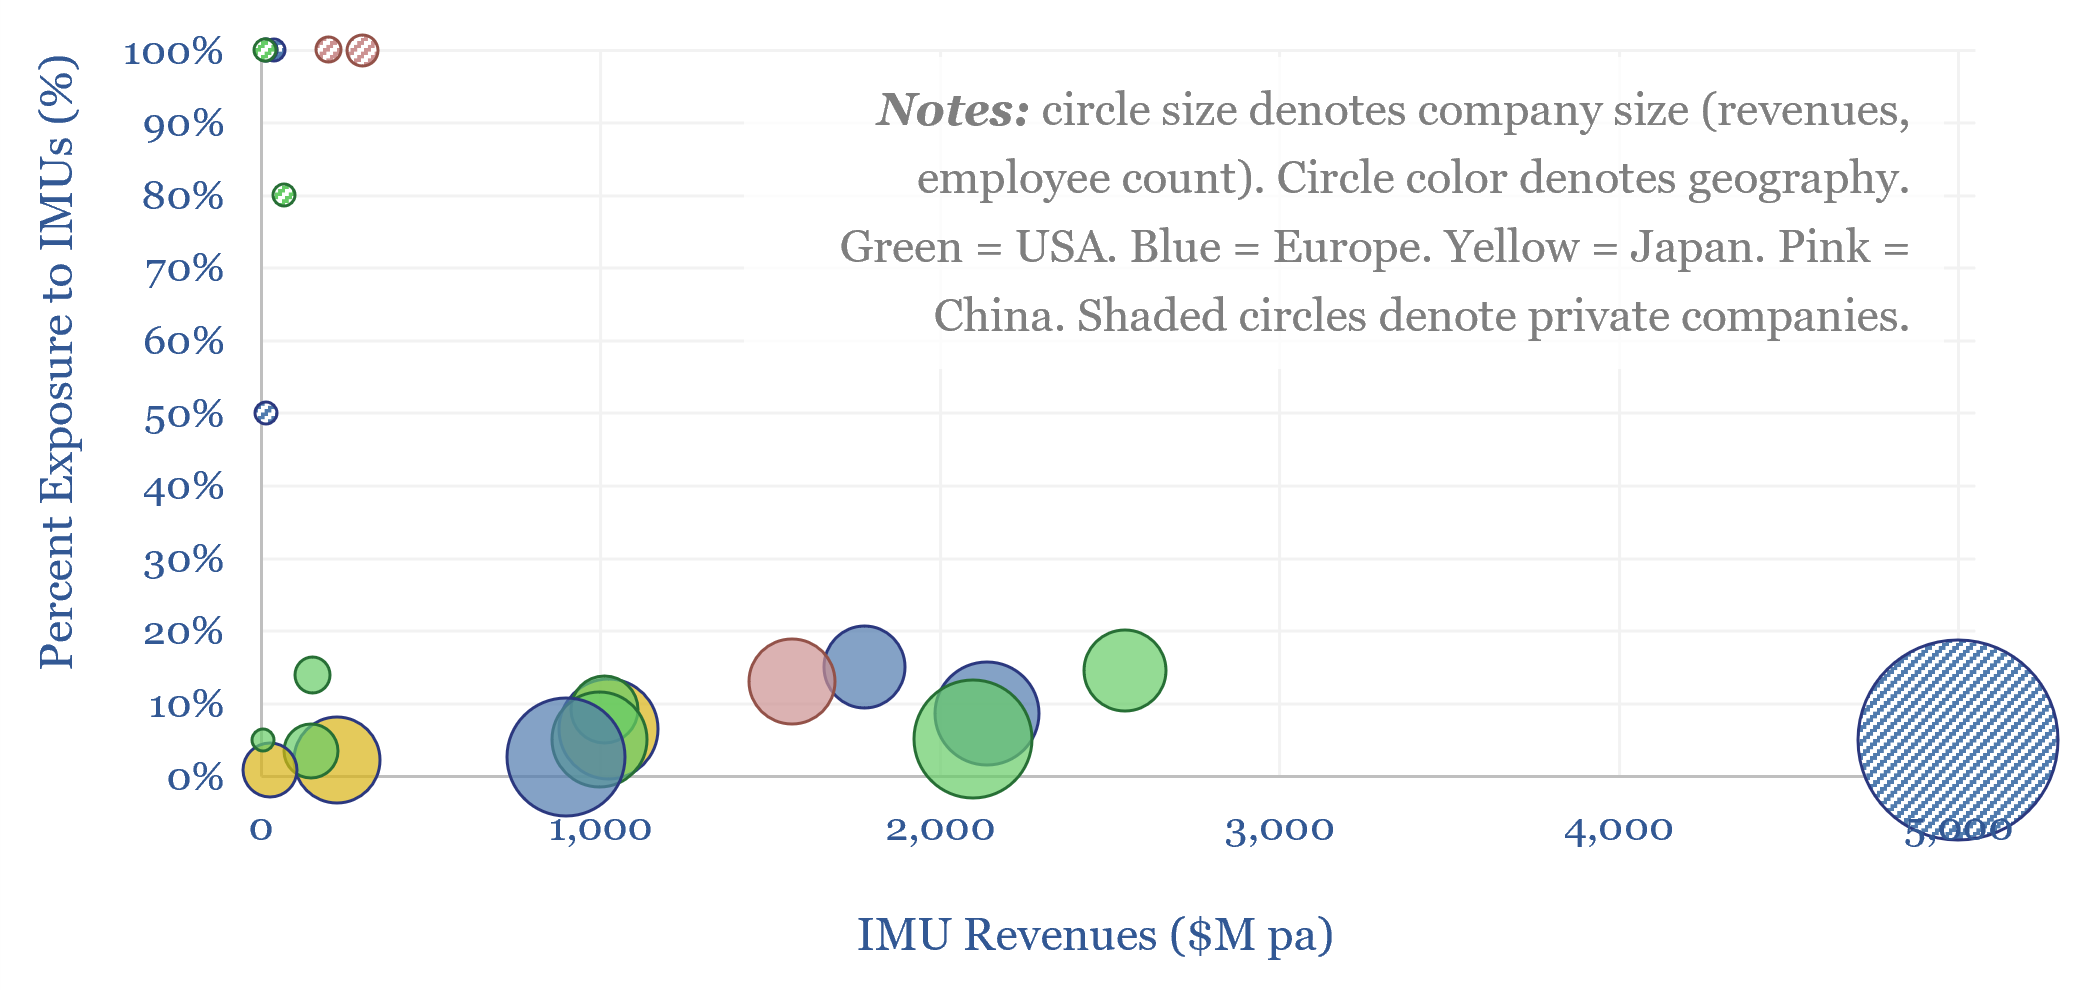
Learing inertial sensor companies are screened in this data-file, capturing 25 producers of inertial measurement units, accelerometers, gyroscopes and other MEMS sensors, as well as the price, performance and technical parameters of underlying IMU products.
-
Capital goods: book-to-bill ratio tracker?

How long will boom times last in capital goods categories, including for AI data center construction? To answer this question, we have started tracking book-to-bill ratios, across 40 capital goods categories, from companies quarterly results. Booms occur when book-to-bill exceeds 1.5x, and typically last 2-years.
-
Humanoid robots and robotics companies?

We have reviewed 20 humanoid robot concepts and robotics companies. The average example costs $80k, weighs 60kg, carries 17kg, with 40 degrees of freedom, moves at 6kmph, uses 500W of power, of which 10% is for 640 TOPs of onboard compute, while a 1.3kWh battery gives 3+ hours of endurance. Details for each humanoid robot…
-
Global iron ore production by company over time?
Iron ore is the sixth most produced commodity in the world, at 2.7GTpa. This data file breaks down global iron ore production by company over time. Since 2019, average realizations for the largest producers have risen at 1.6% pa, while costs have risen at 5% pa. What outlook from here?
-
Canadian shale producers and E&P costs?
This data-file is a screen of Canadian upstream companies and Canadian shale producers, especially focused on the fast-growing Montney-Duvernay shale plays. Key themes are rising shale oil and gas production, low-capex wells, high well-level IRRs, performance improvements and consolidation via M&A.


Content by Category
- Batteries (96)
- Biofuels (44)
- Carbon Intensity (48)
- CCS (64)
- CO2 Removals (9)
- Coal (44)
- Commentary (65)
- Company Diligence (105)
- Data Models (928)
- Decarbonization (163)
- Demand (131)
- Digital (92)
- Downstream (47)
- Economic Model (222)
- Energy Efficiency (76)
- Hydrogen (63)
- Industry Data (311)
- LNG (56)
- Materials (86)
- Metals (89)
- Midstream (45)
- Natural Gas (163)
- Nature (76)
- Nuclear (28)
- Oil (178)
- Patents (39)
- Plastics (44)
- Power Grids (156)
- Renewables (153)
- Screen (139)
- Semiconductors (36)
- Shale (58)
- Solar (72)
- Supply-Demand (53)
- Vehicles (94)
- Video (24)
- Wind (46)
- Written Research (410)