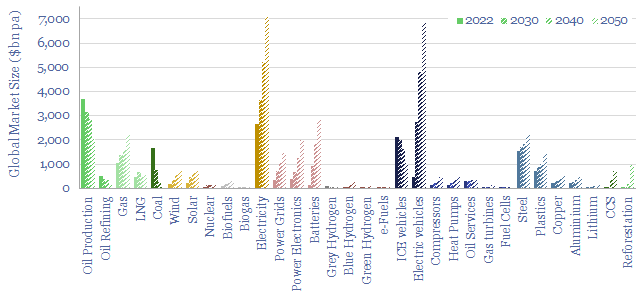
This data-file contains energy transition market sizing analysis, for hydrocarbons, new energies, capital goods and materials in $bn pa, integrating over 1,000 items of energy transition research and our latest roadmap to net zero. In aggregate, energy, materials and transition-related markets double from $25 trn pa to $50 trn pa. Conclusions below.
Energy transition market sizing. How big will the markets be for energy commodities, materials, manufactured products and clean technologies, as part of the energy transition?
Our energy transition research has been boiling the ocean, looking at individual markets, for the past five years. However, this data-file is intended as a useful reference file, to compare the volumes, prices and thus market sizes for different markets.
Is your energy transition market sizing realistic? Well-established capital goods sectors include oil services ($300bn pa), compressors ($140bn pa), switchgear ($110bn pa), industrial valves ($100bn pa), gas turbines ($30bn pa) and power semiconductors ($30bn pa). We think this data-file is worth considering, to ensure forecasts for the ultimate market sizing are realistic, especially for some highly-hyped and early stage technologies.
Electricity will become the biggest energy commodity by market value, in absolute terms, by 2050, surpassing $7 trn per year, which is 2x higher than the total market value of oil, the leader in 2022. More granular details are available in our power grid research.
Electric vehicles become the second largest market in the data-file, also reaching close to $7 trn per year, if EV sales ramp up to around 200M vehicles per year at an average price around $35k per vehicle. These are huge numbers, with embedded risks, and also pull on commodities such as batteries ($3trn pa, some also used ex-EVs) and battery materials such as lithium ($150bn pa).
Wind and solar enjoy vast ramp-ups too, and the ultimate capex spent on both are likely to surpass $700bn pa. For perspective, note that the entire oil service market today is around $300bn pa. The outlook for wind and solar differs however. We see much greater volume growth for solar (in GW pa), combined with much faster future cost deflation (in $/kW), and these two trends balance out to yield a similar market size (in $bn pa).
Hydrocarbons retain enduring value, declining from a total market value of $7 trn per year in 2022 to $5 trn per year in 2050. But the biggest reason for the decline is that 2022 was a year of energy shortages, with abnormally high energy prices. Within the mix, we also see a major shift from coal to gas, if the world is serious about decarbonization.
Global materials markets at least double, due to rising volumes and CO2 abatement costs. The largest materials markets in the world today include steel ($1.5 trn pa), plastics ($750bn pa) and copper ($250bn pa). We actually have a more detailed data-file, looking into more underlying materials, and our thesis on each one, linked here.
The biggest gains in market size are seen for reforestation (reaching $1trn pa in value by 2050), CCS value chains ($700bn pa by 2050) and blue hydrogen ($250bn pa by 2050), if the world is actually serious about decarbonization.
Why are your numbers so low for XYZ? Our models prefer low cost decarbonization options over high cost decarbonization options. For example, in hydrogen value chains, we estimate that ultimately the produced volumes of blue hydrogen ($1/kg) will be 10x higher than green hydrogen ($8/kg) specifically because blue hydrogen is less expensive. Market size = volume x price. Hence if the volumes were the same, then green hydrogen markets would be 8x larger than blue hydrogen markets simply because green hydrogen is more expensive. But energy is unlikely to become a Giffen good !!
Please download the data-file to flex the underlying assumptions for market volumes, unit prices and future market sizes of different energy transition verticals. We would note that this data-file also contains links to a lot of our other data-files and therefore may be more useful for TSE subscription clients than as a one-off download.

