This 16-page report breaks down global CO2 emissions, across six causal factors, and 28 countries/regions. Global emissions rose at +0.7% per annum (pa) from 2017-2022, of which +1.0% pa is population growth, +1.4% pa rising incomes, -1.4% pa efficiency gains, -0.5% renewables, 0% nuclear, +0.2% ramping back coal due to underinvestment in gas. Depressingly, progress towards net zero slowed in the past five years. Reaching net zero requires an ‘all of the above’ approach, accelerating renewables, clean infrastructure, efficiency, nuclear, gas, CCS and nature.
Global CO2 emissions exceeded 50GTpa in 2022, having doubled over the past half century, and still rising at +0.7% per year in the past five years from 2017 to 2022. These numbers are broken down by region on page 2.
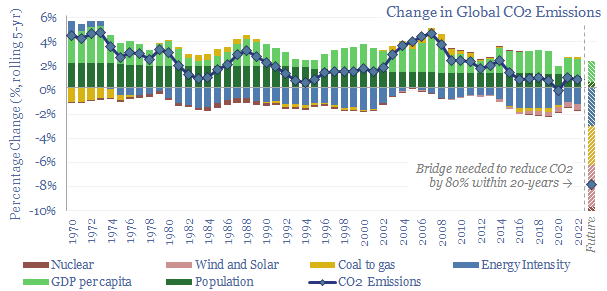
Global CO2 emissions (in GTpa) can also be explained via a factor attribution: multiplying population (M people) x GDP per capita (in $k per person) x energy intensity of GDP (in MWH per $k) x share of energy from combustion sources (rather than renewables) (in %) x CO2 intensity per unit of combustion energy (in kg/kWh). The same maths works on the deltas. And region by region. Our methodology is explained on pages 3-4.
Over the past five years, global CO2 emissions have risen at a +0.7% CAGR, which attributed to +1.0% pa population growth, +1.4% pa GDP per capita, -1.4% pa efficiency gains, -0.5% pa due to the ramp up of wind and solar, but +0.2% pa due to the switching back from lower-carbon to higher-carbon hydrocarbons. We highlight some key conclusions and forecasts on each of these attribution categories on pages 5-7.
Chart after chart in the remainder of the report shows that where countries under-invested in gas and had to pivot back to coal, then CO2 emissions have risen; where nuclear plants have been shut down, then CO2 emissions have risen; where renewables investments and efficiency investments have slowed down, then CO2 emissions have fallen more slowly. This is just maths and history. Irrefutable maths and history.
The single most important point in the note is that an ‘all of the above’ approach is needed to have any mathematical hope of reaching net zero by 2050. It would be so strange and unnecessary to put all of our decarbonization eggs into a single basket.
Another historical observation is that switching coal to gas has been one of the most powerful decarbonization tools available. US CO2 emissions peaked in 2005 and have since fallen by c20%, of which 70% was switching coal to shale gas, saving over 750MTpa of CO2. UK CO2 emissions peaked in 1965 and have more than halved, of which 60% has been switching coal to gas, saving 300MTpa of emissions.
The report also focuses in upon: US decarbonization, which now leads the pack (page 7); UK decarbonization, which is the most depressing slowdown of any country in our sample (page 8); and Europe and Japan, a tale of two nuclear policies (page 9).
In the emerging world, which is the source of 70% of the world’s CO2 emissions, CO2 emissions rose at a +1.35% CAGR in the past five years from 2017-22. This is faster than the +1.29% CAGR from 2012-17. The biggest reason for the step up is that coal-to-gas switching was providing -0.2% pa of decarbonization in 2012-17, while underinvestment in gas caused a switch back to coal in 2017-22 (from 6.4GTpa to 6.9GTpa of coal use) and in turn this increased emissions by +0.4% pa. This was offset by a slower pace of income growth (from +2.7% pa in 2012-17 to +2.1% pa in 2017-22). It is hard not to be depressed when looking at these numbers (pages 10-11).
We also zoom in upon CO2 emissions trends, and their factor attributions in China, India, Brazil and Africa (pages 12-13).
Reforest and reinvest looks like a promising economic development model, which could uplift the GDP of 47 emerging world countries by 6-60% while creating a 7.5GTpa CO2 removals sink (note here).
In conclusion, it is mathematically quite challenging to bridge to net zero without an ‘all of the above approach’, which accelerates as many options as possible, including wind, solar, electrification, efficiency gains, gas, LNG, CCS, nuclear and nature-based solutions.