Biofuels
-
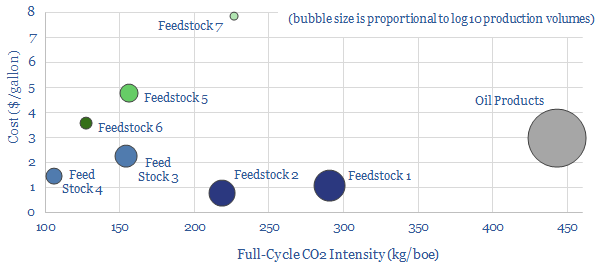
Biofuel technologies: an overview?

Biofuels are currently displacing 3.5Mboed of oil and gas. But they are not carbon-free, and their weighted average CO2 emissions are only c50% lower. This data-file breaks down the biofuels market across seven key feedstocks, to help identify which opportunities can scale for the lowest costs and CO2, versus others that require further technical progress.
-
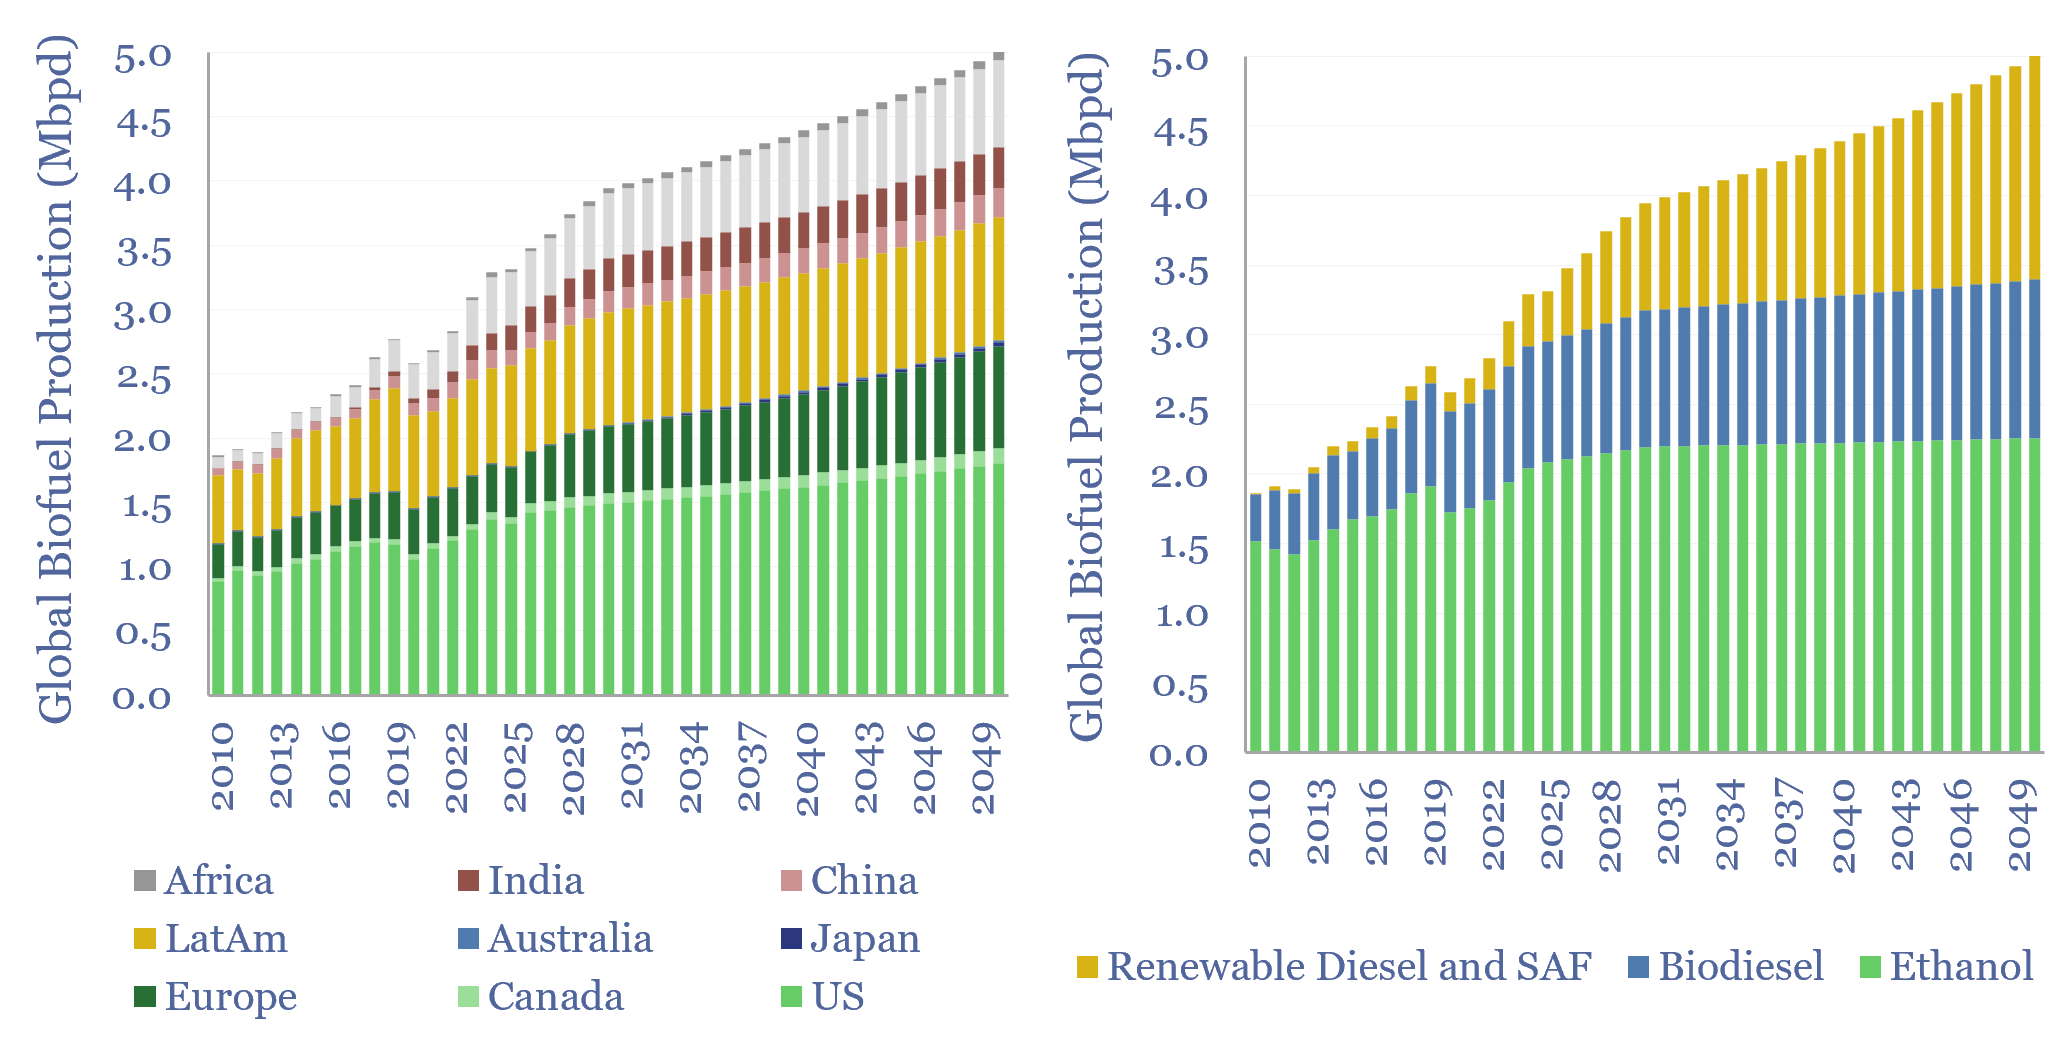
Global biofuel production: by region, by liquid fuel?

Global liquid biofuel production ran at 3.3Mbpd in 2025, of which c60% is ethanol, c30% is biodiesel and c10% is renewable diesel. 65% of global production is from the US and Brazil. Our forecasts for global liquid biofuel production reach 3.8Mbpd by 2030 and 5Mbpd by 2050, with 75% of the growth in renewable diesel.
-
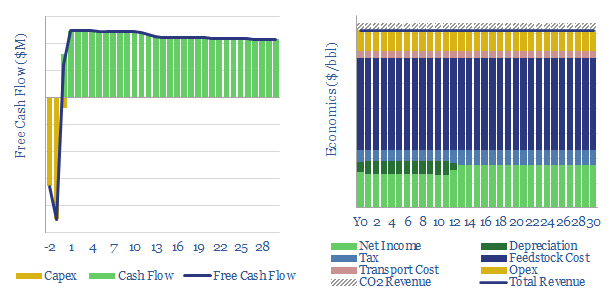
Renewable diesel: the economics?

Renewable diesel economics are captured in this data-file, requiring a price of $4.5-5/gallon (about $200/bbl), for a green diesel plant costing $35M/kbpd to generate a 10% IRR while hydroprocessing $1,000/ton feedstocks. Please download the data-file to stress-test renewable diesel economics, biodiesel economics and input costs.
-
Sustainable aviation fuel: flight path?

As things stand, we argue Europe will be forced to scale back its SAF targets, due to Sustainable Aviation Fuel costs and land constraints. However, our 17-page report asks what could improve the outlook. Specifically, what yields, costs and other properties would we need to see from an oil crop to get excited about unlocking…
-
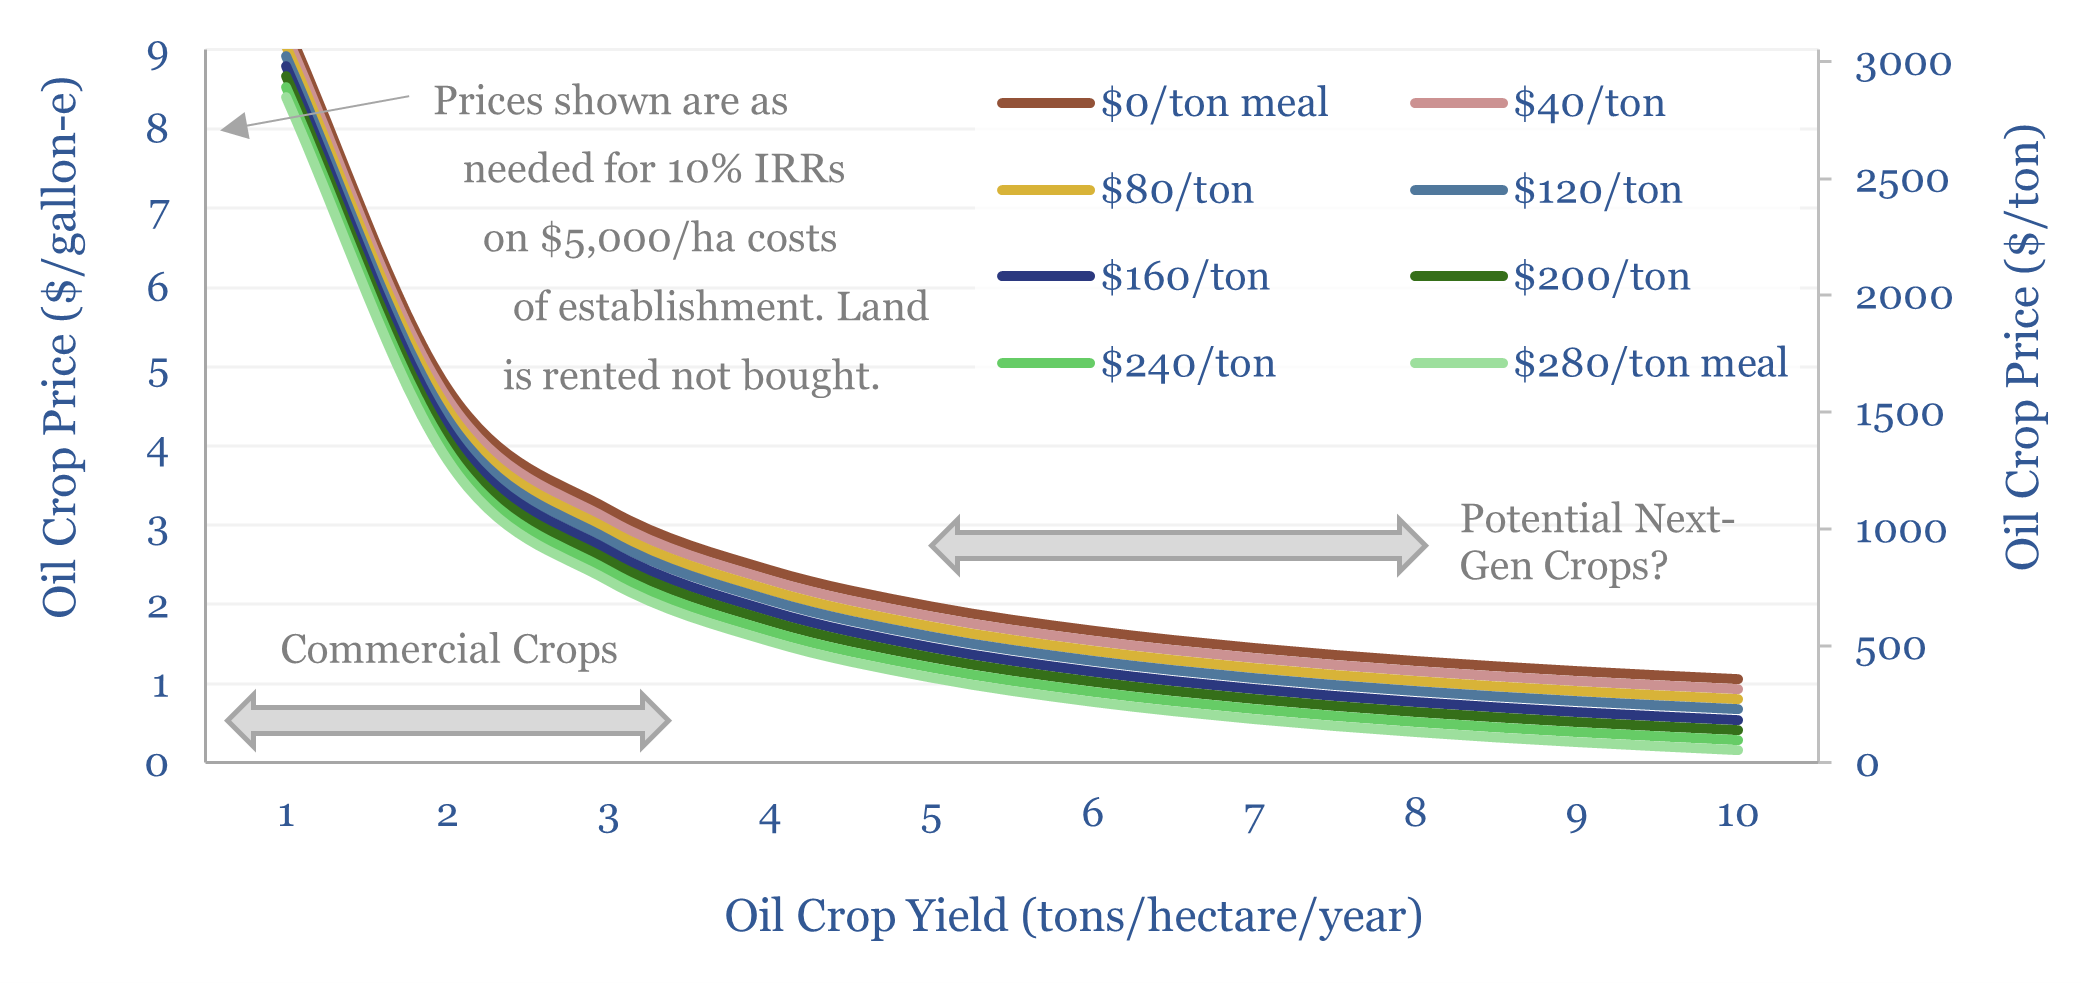
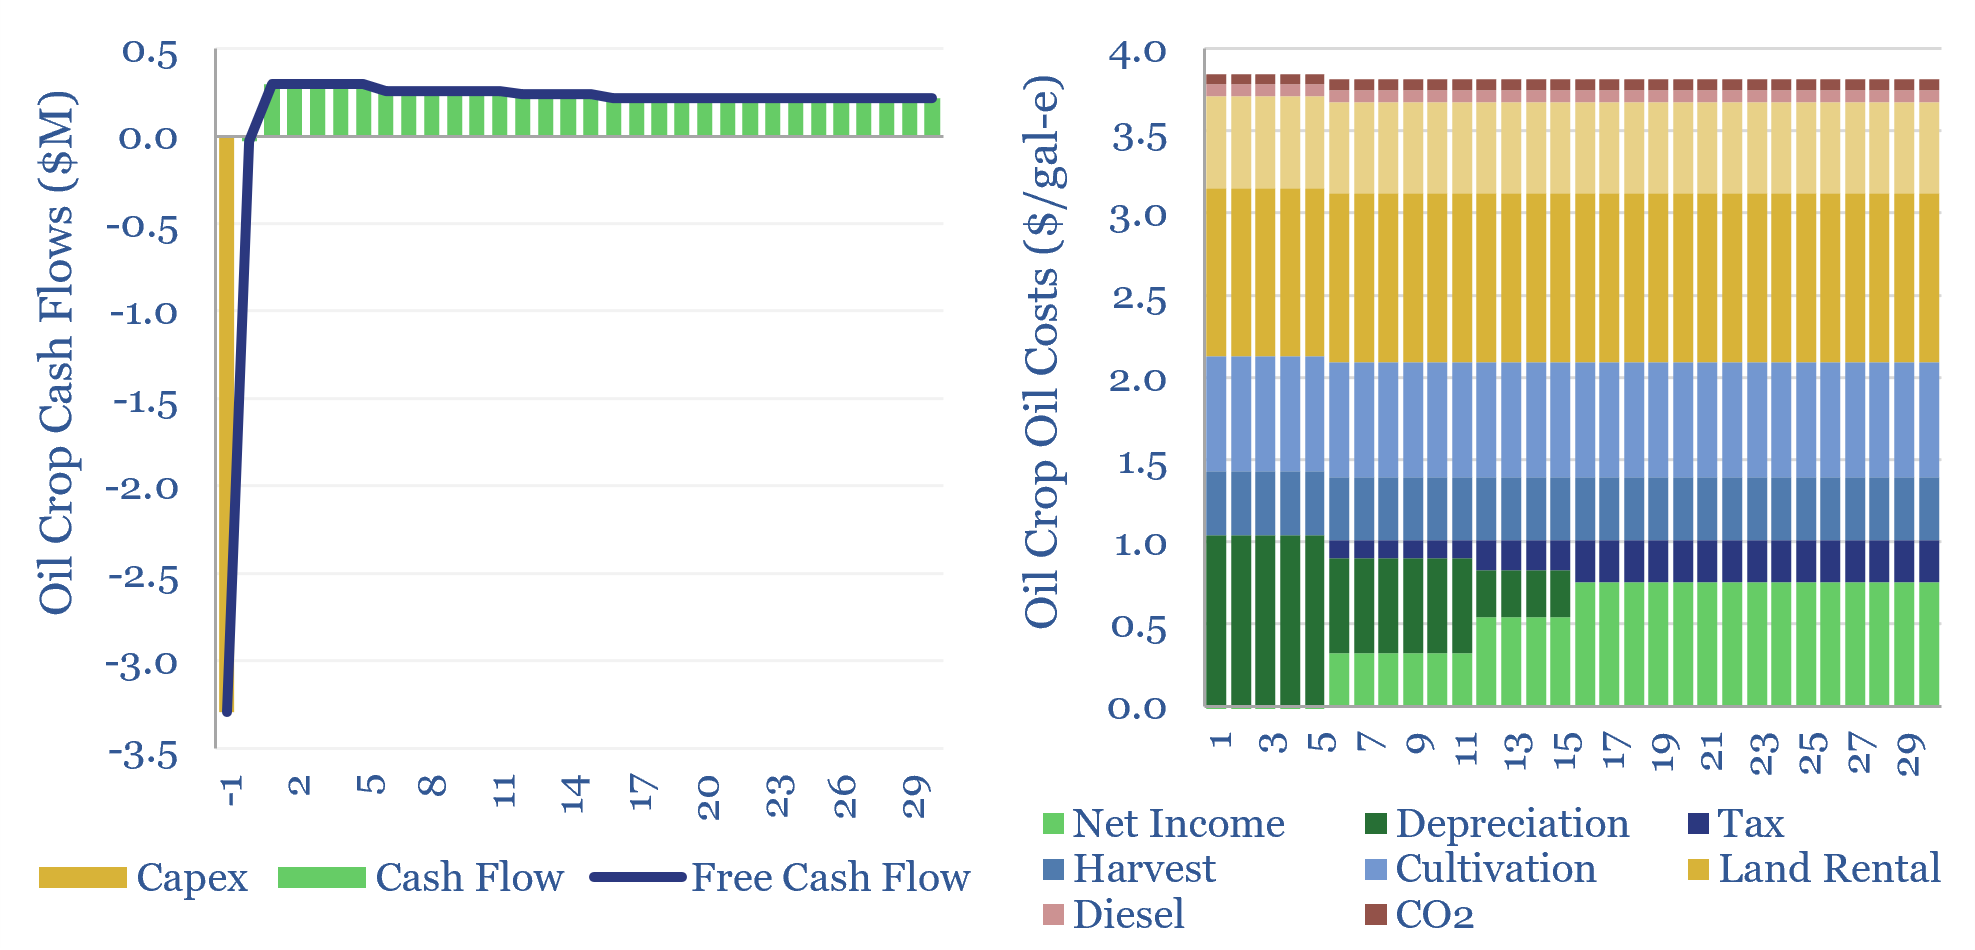
Oil crops: the economics?

The costs of oil crops, a crucial input for bio-diesel and SAF, will usually range from $900-1,200/ton, in order to generate acceptable 6-15% IRRs for producers. This translates into $3-4/gallon in feedstock costs. These oil crops also likely embed over 2 kg/gallon of CO2 intensity. The economics of oil crops can be stress-tested in this…
-
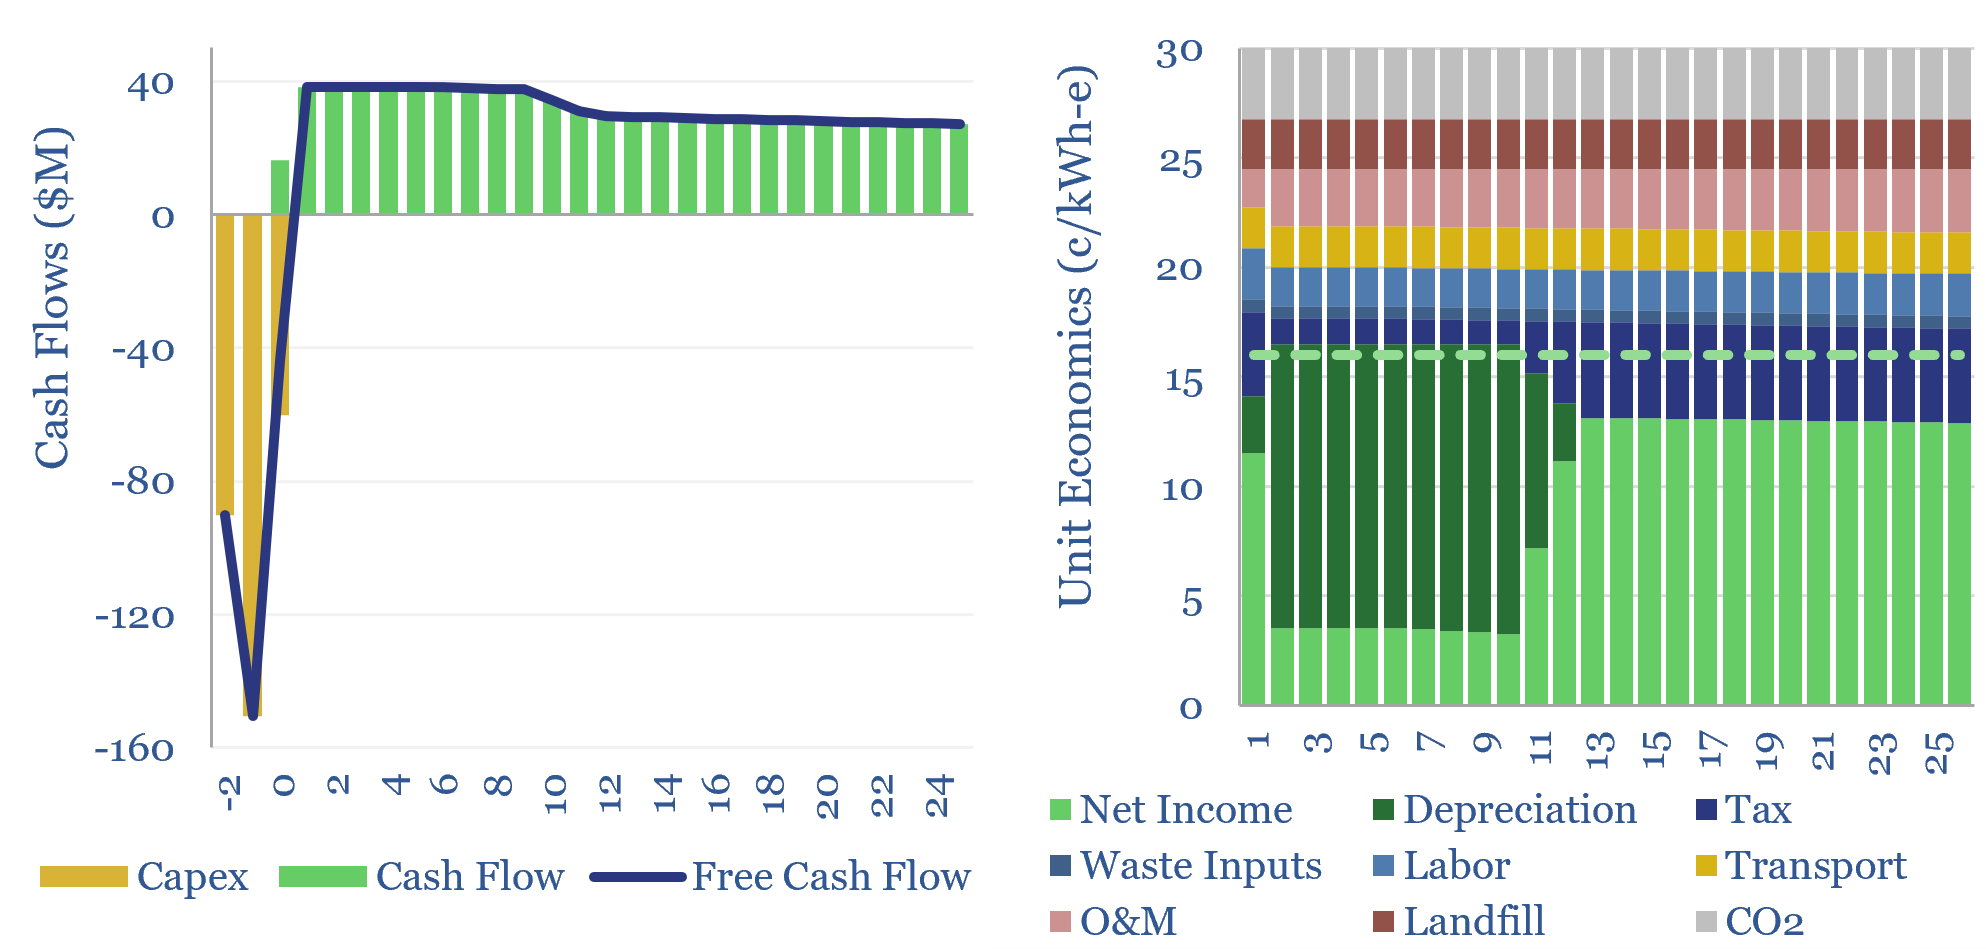
Waste-to-energy: levelized costs of electricity?

A typical waste-to-energy plant, without subsidies, must charge 16c/kWh to generate a 10% IRR off of c$7,000/kW in capex costs, plus another 14c/kwh-equivalent of revenues from avoided landfilling and metals recovery. This economic model covers waste-to-energy levelized costs of electricity.
-
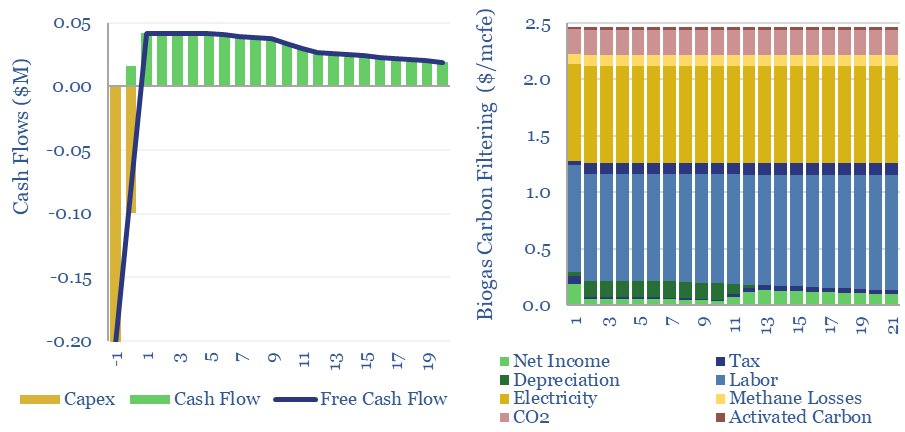
Costs of biogas upgrading to biomethane?

Costs of biogas upgrading into biomethane are estimated at $7/mcf off of capex cost of $400/ton, in this data-file. The largest contributor to total costs is carbon filtering, to remove siloxanes, VOCs and H2S, which we have modelled from first principles, at $2/mcfe. Underlying data into biogas compositions and impurities are also tabulated for reference.
-
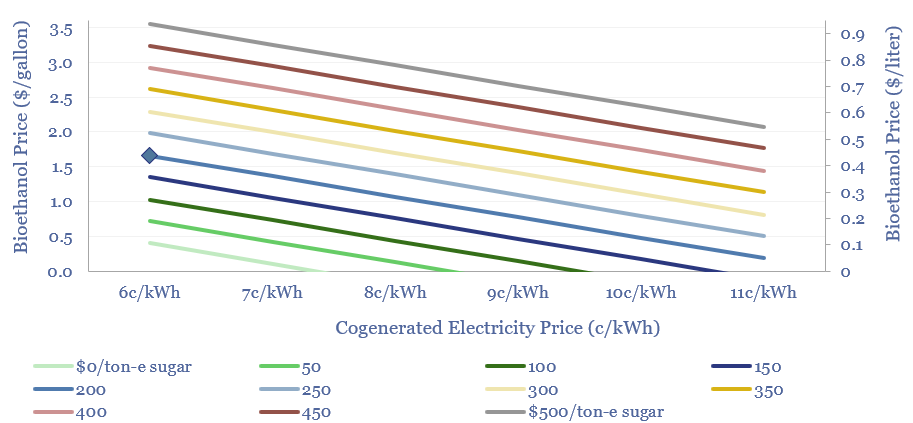
Sugar to ethanol: value in volatility?

Sugar cane is an amazing energy crop, yielding 70 tons per hectare per year, of which 10-15% is sugar and 20-25% is bagasse. Crushing facilities create value from sugar, sugar-to-ethanol and cogenerated power. This 11-page note argues that more volatile electricity prices could halve ethanol costs or raise cash margins by 2-4x.
-
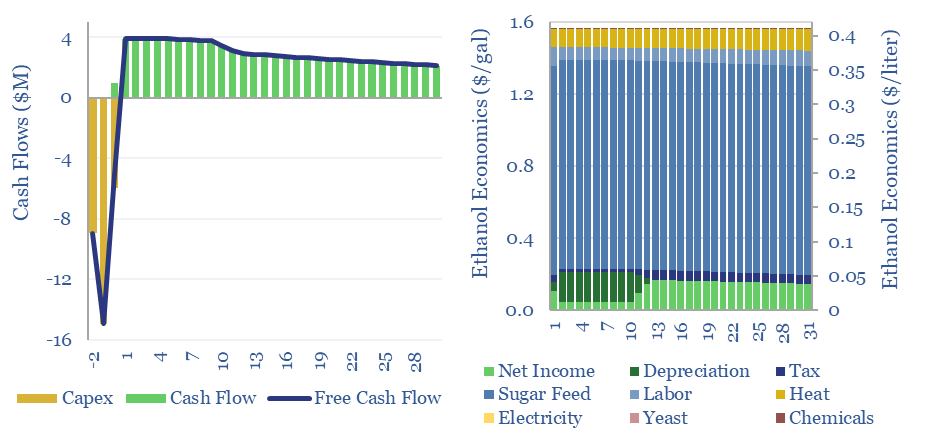
Sugar to ethanol: the economics?

This data-file captures the economics of ethanol production, as a biofuel derived from sugar. A 10% IRR requires $1-4/gallon ethanol, equivalent to $0.25-1/liter, or $60-250/boe. Economics are most sensitive to input sugar prices. Net CO2 intensity is at least 50% lower than hydrocarbons.
-
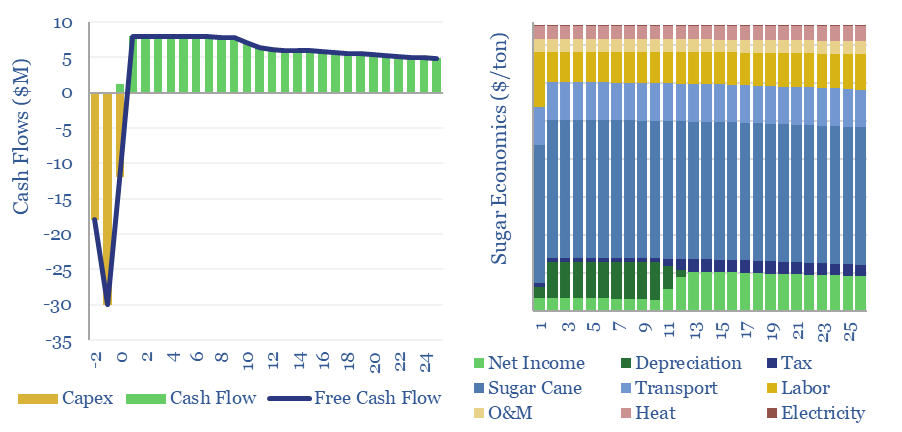
Sugar production: the economics?

The costs of sugar production are estimated at $260/ton for a 10% IRR at a world-scale sugar refinery, in a major sugar-producing region. Higher returns are achievable at recent world sugar prices, and by valorizing waste streams such as molasses for ethanol and bagasse for cogenerated electricity.
Content by Category
- Batteries (96)
- Biofuels (44)
- Carbon Intensity (48)
- CCS (64)
- CO2 Removals (9)
- Coal (44)
- Commentary (65)
- Company Diligence (105)
- Data Models (928)
- Decarbonization (163)
- Demand (131)
- Digital (91)
- Downstream (47)
- Economic Model (222)
- Energy Efficiency (76)
- Hydrogen (63)
- Industry Data (311)
- LNG (56)
- Materials (86)
- Metals (89)
- Midstream (45)
- Natural Gas (163)
- Nature (76)
- Nuclear (28)
- Oil (178)
- Patents (39)
- Plastics (44)
- Power Grids (156)
- Renewables (153)
- Screen (139)
- Semiconductors (35)
- Shale (58)
- Solar (72)
- Supply-Demand (53)
- Vehicles (94)
- Video (24)
- Wind (46)
- Written Research (409)