This-data file is a breakdown of world food energy production, by crop, and by major country-region. The source is the excellent and open-source data from the Food and Agriculture Organization. But more importantly, from our perspective as energy analysts, we have converted the numbers from tons to kilocalories (kcal) and TWH of primary energy equivalents.
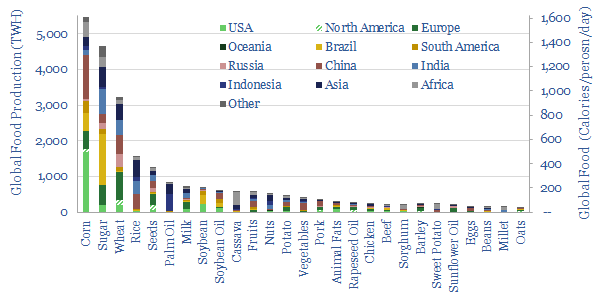
World food output is 10bn tons per year, in tonnage terms, of which around 1GTpa comprises corn, vegetables, sugar products, milk, wheat, fruits and rice; while smaller categories include 360MTpa of potatoes, 360MTpa of meats, 350MTpa of soybeans and 250MTpa of vegetable oils (which are also broken down by component and region in the data-file).
Energy density varies sharply, however. 1 kg of vegetable oil might contain 10kWh/kg of energy, while this declines to 5kWh/kg for sugars, 3-4kWh/kg for cereal crops, 2kWh/kg for meats and 0.5kWh/kg for fruits and vegetables.
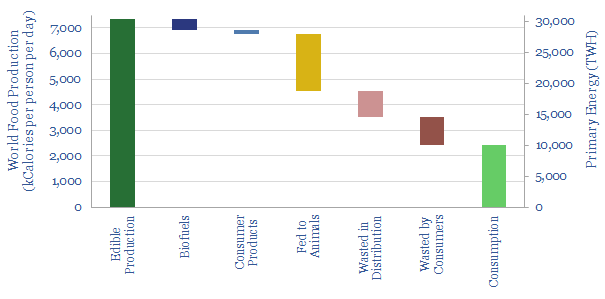
Food energy production, therefore, stands at 20 trn calories per day, equivalent to 25,000 TWH per year of primary energy. For perspective, the primary energy in total global gas production is around 40,000 TWH, in total global coal it is 40,000 TWH and in total global oil production it is 50,000 TWH. Food from the world’s 4bn acres of cropland is no less an energy source than conventional energy.
Global food consumption (by humans) only runs at 30% of total food production, or 2,500 kcal per person per day, according to our bridging overleaf. c30% of total food production is wasted. Another c30% is fed to animals, which must consume an average of 8 calories to produce 1 calorie of meat. Another c5% is converted into energy as a biofuel. And another c2% is used in consumer products.
Food shortages are an increasing fear for 2022-25. The data also show a wide spread by country-region. Brazil produces 4x its own calorific needs. The US produces 3x. Europe produces 1.1x. But emerging Asia is only 0.7x. Africa is only 0.5x. Alleviating food shortages may result in changing biofuels strategies from the developed world (note here) and changing consumption habits (note here).
The data-file contains all of the numbers behind the ideas above, plus a ‘cleaned’ and useful reference, as a breakdown of world food energy production by crop by country and region. For running mass balances, energy balances or biofuels considerations around the world food system.
To read more about world food energy production, please see our article here.