Downstream
-
Refining self-sufficiency by country?
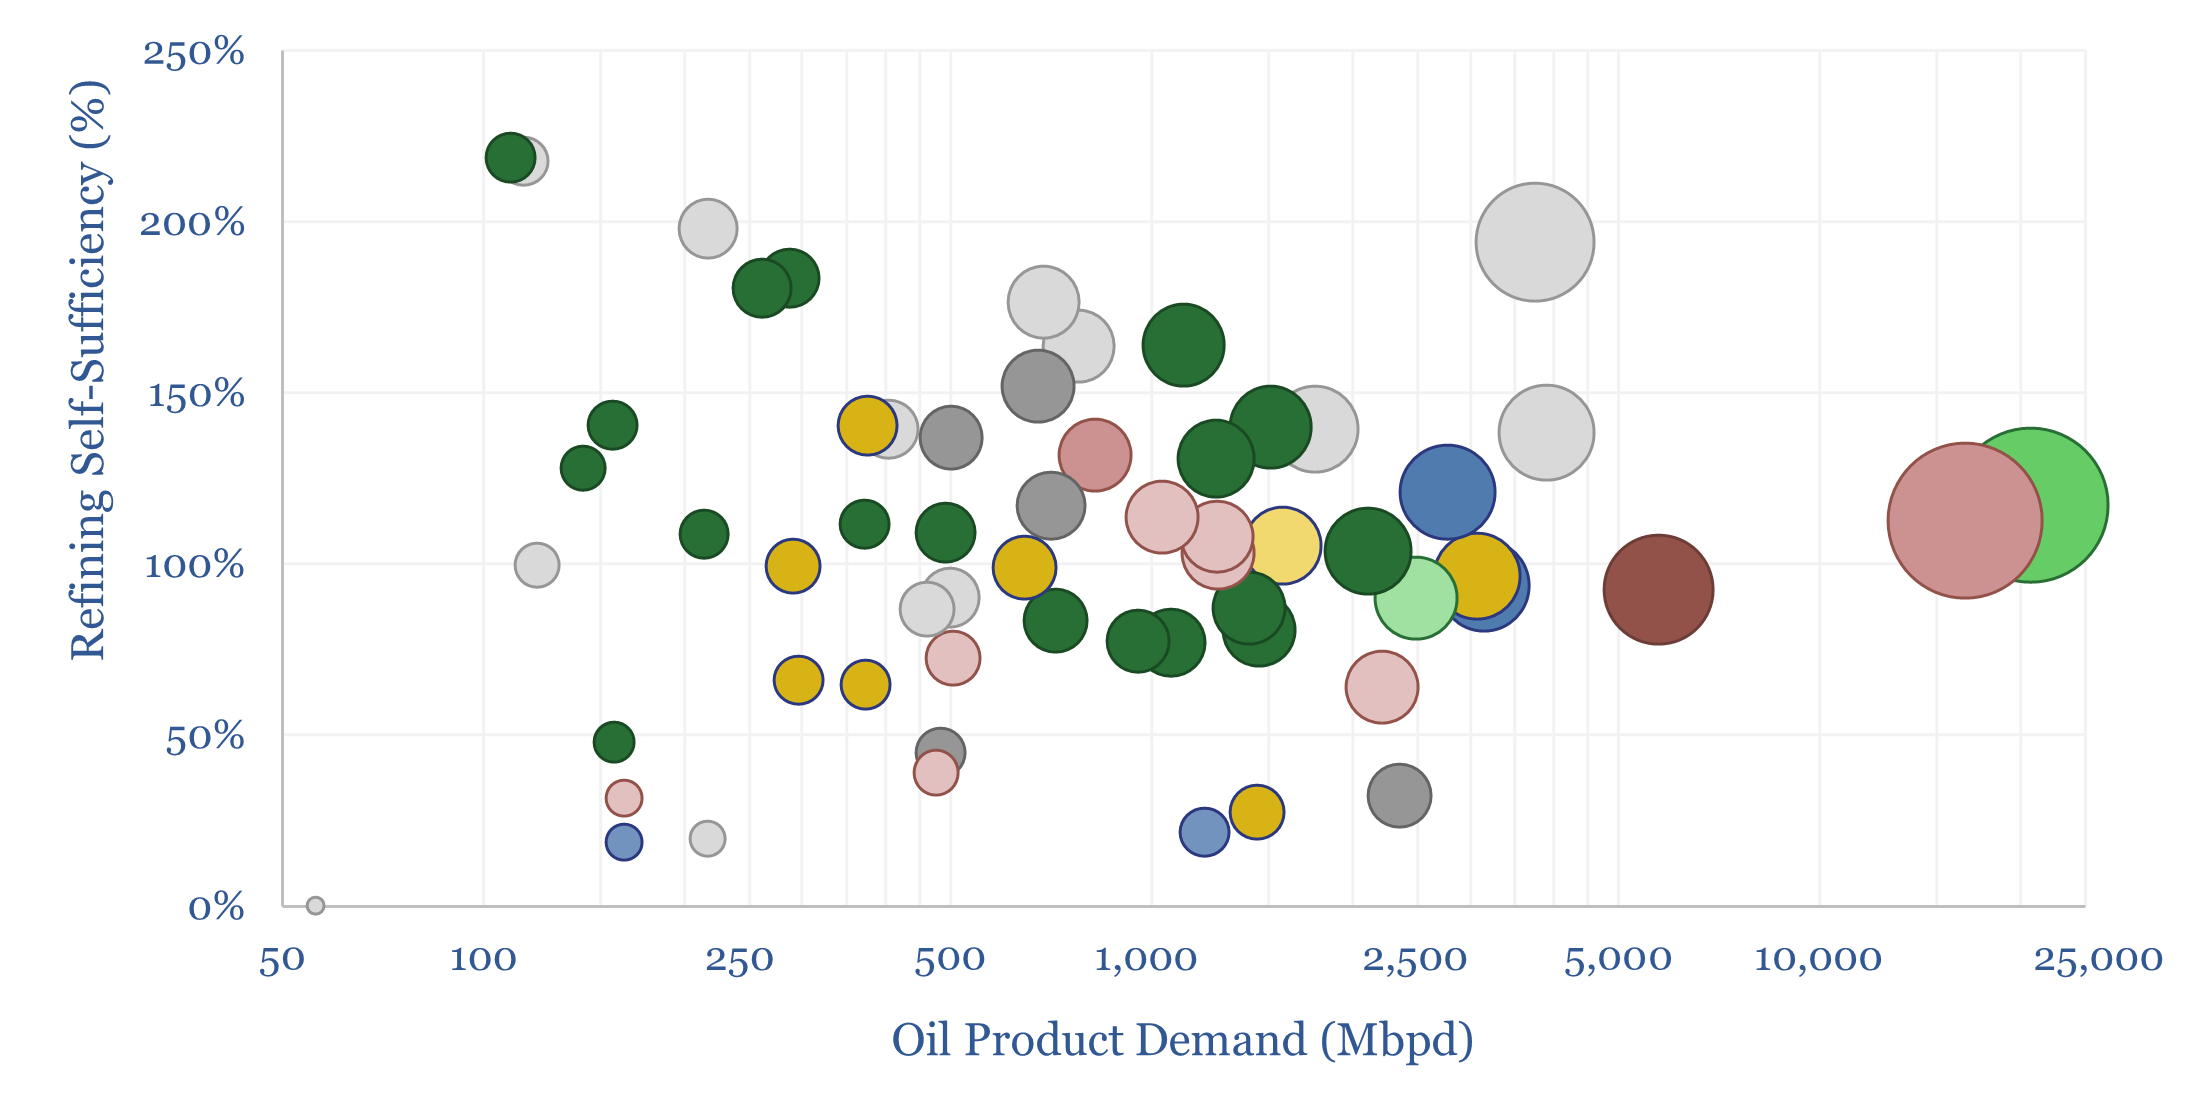
Which countries are self-sufficient in refining capacity? Which countries export oil products? And which are least self-reliant, thus needing to import oil products, and potentially facing shortfalls in disrupted markets? This data-file estimates global oil refining self-sufficiency by country.
-
Renewable diesel: the economics?
Renewable diesel economics are captured in this data-file, requiring a price of $4.5-5/gallon (about $200/bbl), for a green diesel plant costing $35M/kbpd to generate a 10% IRR while hydroprocessing $1,000/ton feedstocks. Please download the data-file to stress-test renewable diesel economics, biodiesel economics and input costs.
-
Downstream oil companies: screen of refiners?
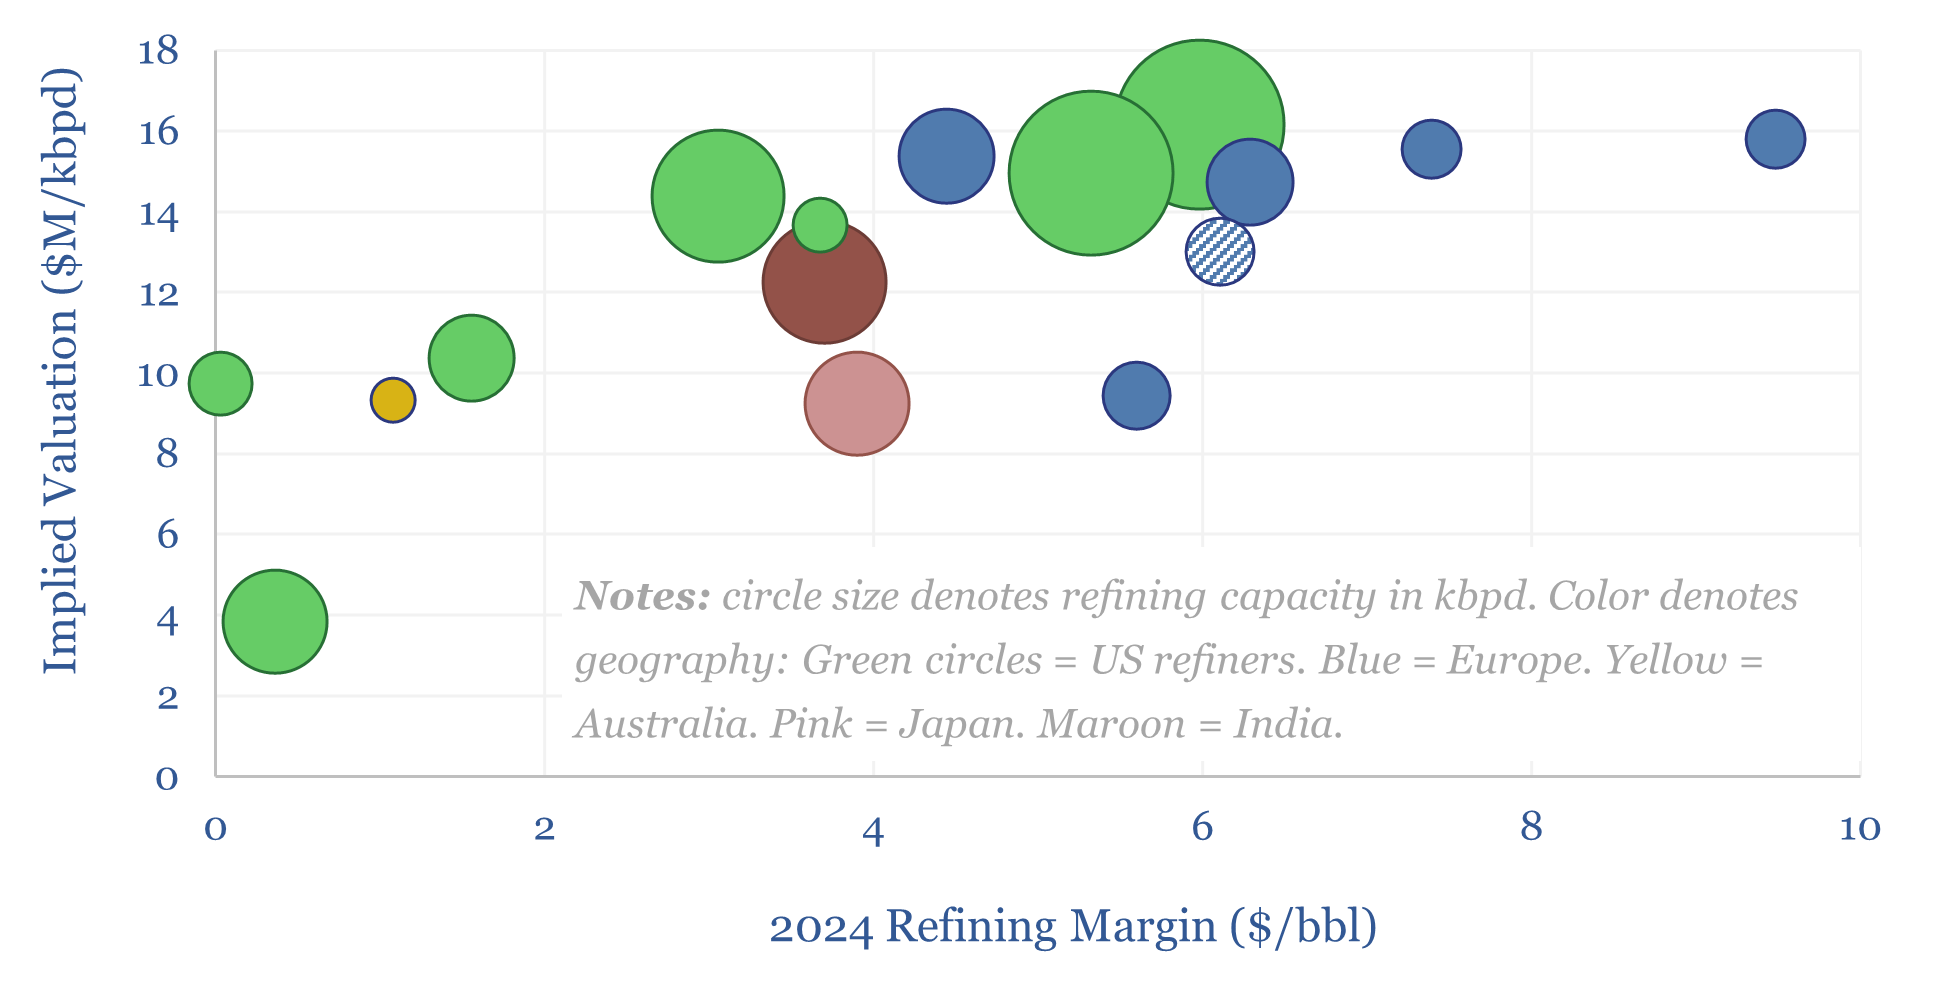
This data-file is a screen of 16 leading listed downstream companies, with 16Mbpd of refining capacity, currently valued at $200bn on an EV basis. Refining margins, costs, complexity, utilization and split between other business activities are summarized in the data-file.
-
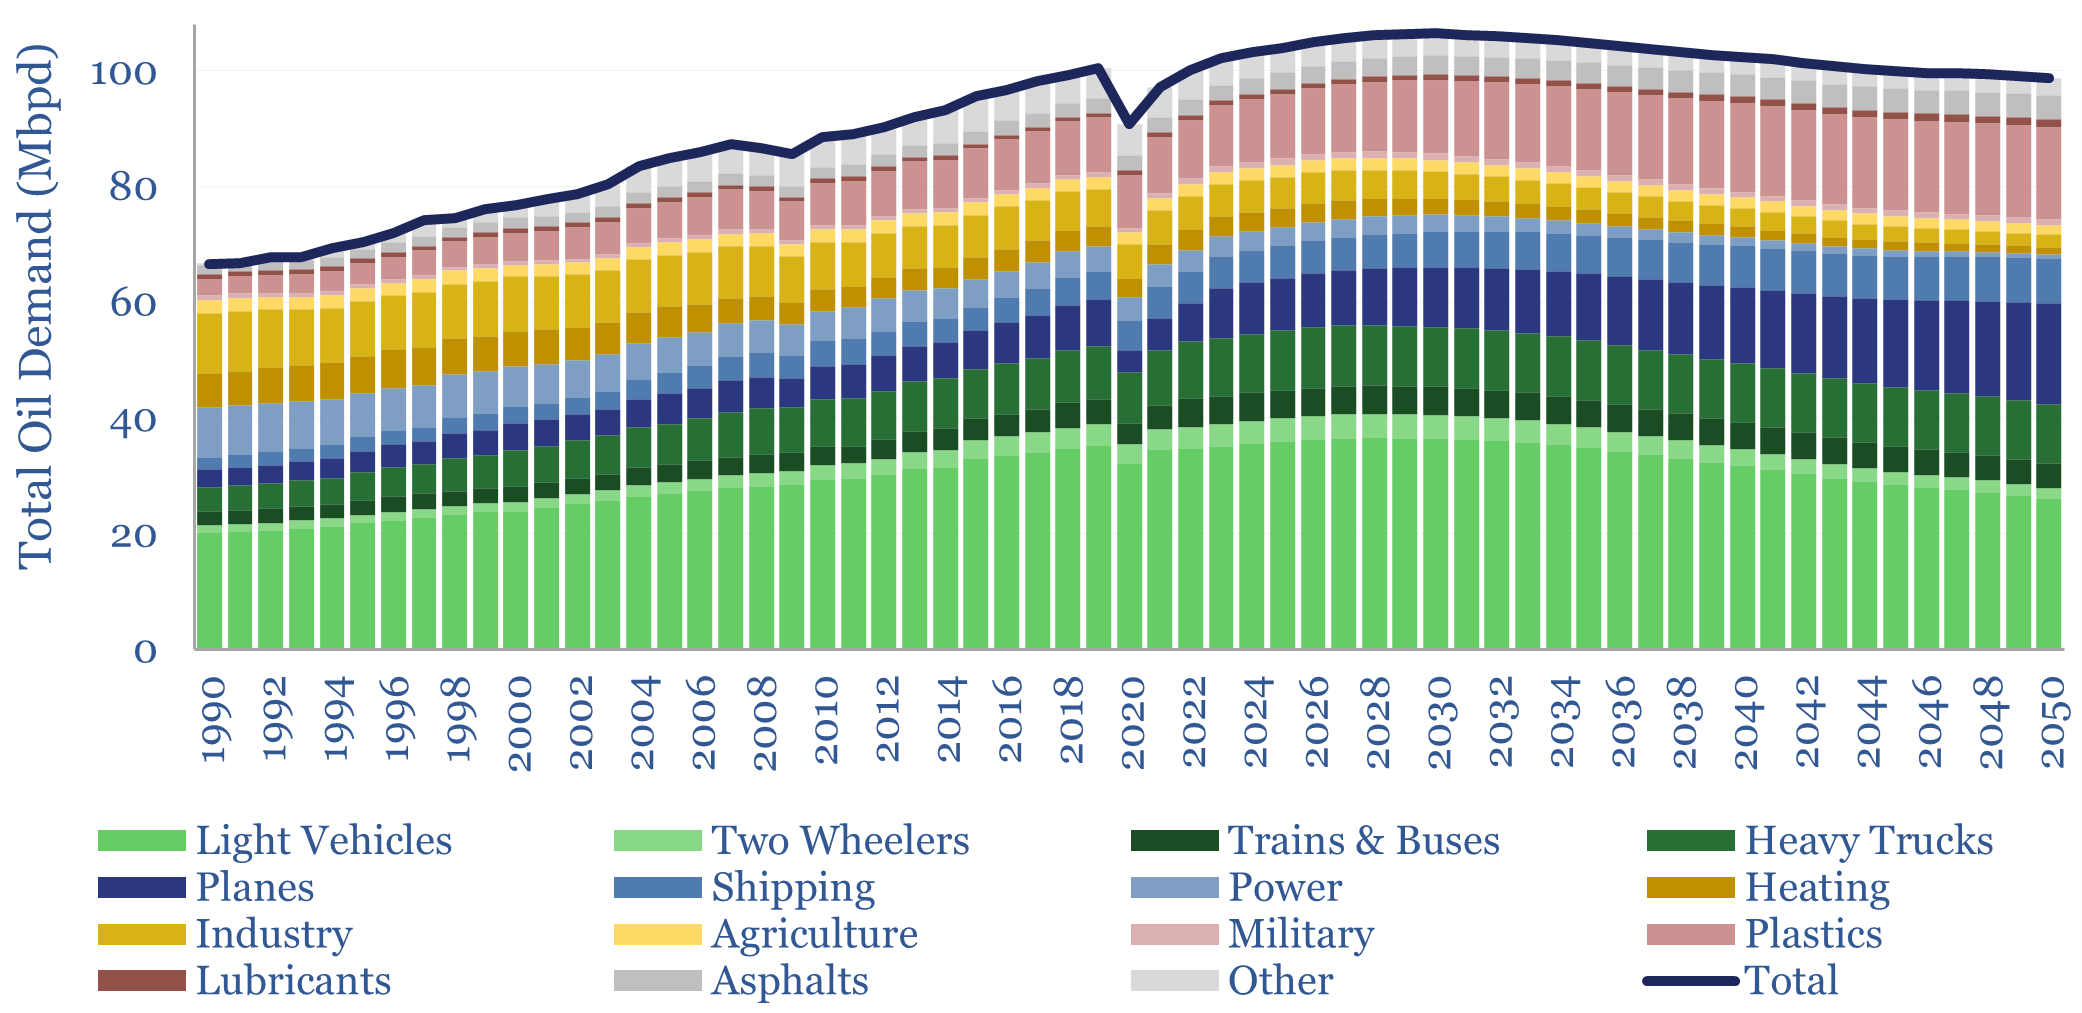
Global oil demand forecasts: by end use, by product, by region?

This model forecasts long-run global oil demand to 2050, by end use, by year, and by region; across the US, the OECD and the non-OECD. We see demand rising from 104Mbpd in 2024 to a plateau of 107Mbpd in 2030, then easing back to 100Mbpd by 2050.
-
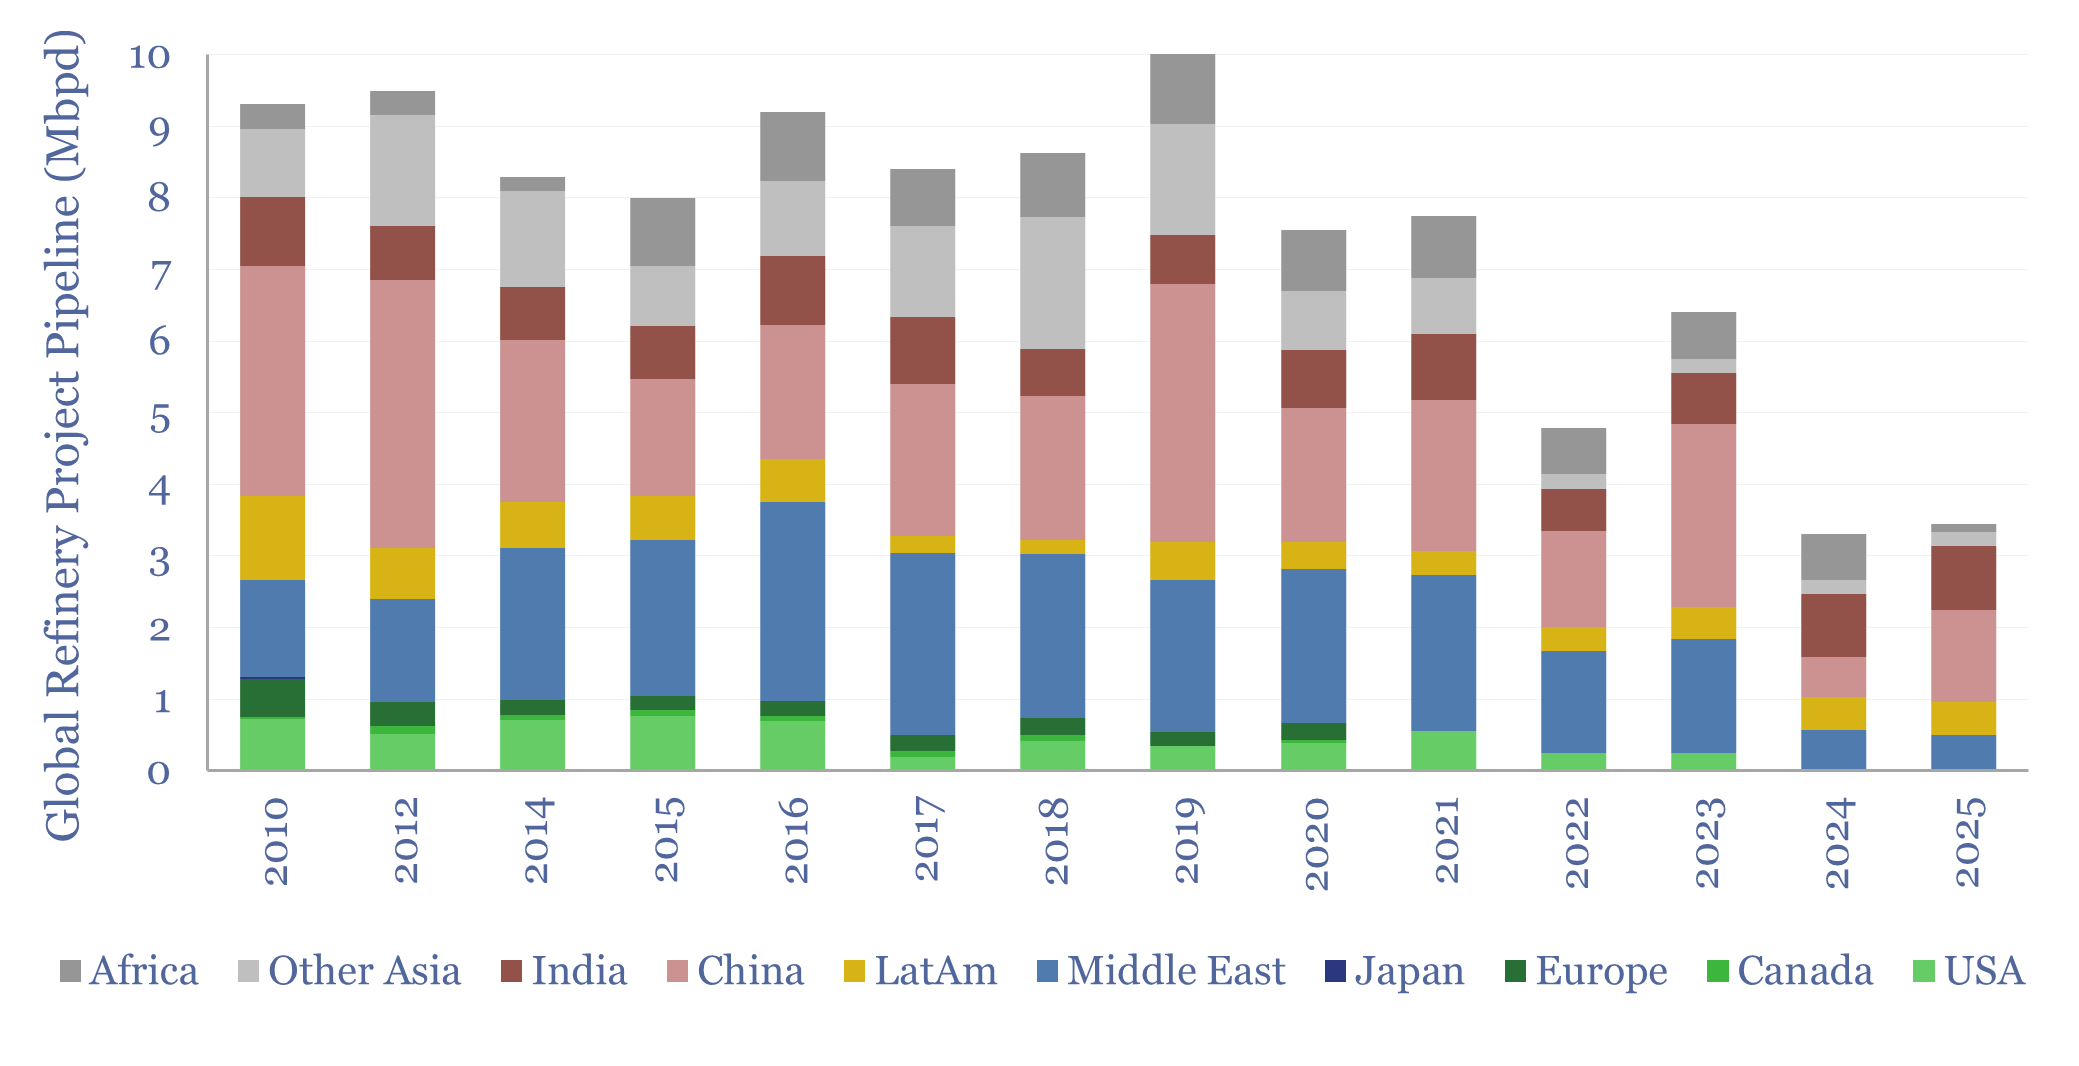
Global refinery project pipeline over time?

This data-file captures the pipeline of global refining projects in progress, by region, over time. The pipeline has thinned from 9Mbpd in 2010-19 to 3Mbpd today. At the same time 600kbpd/year of refineries have closed down. Could this portend higher refining margins?
-
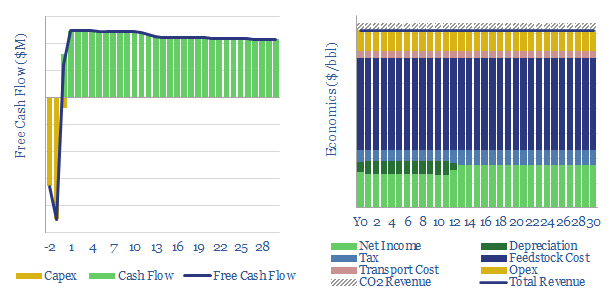
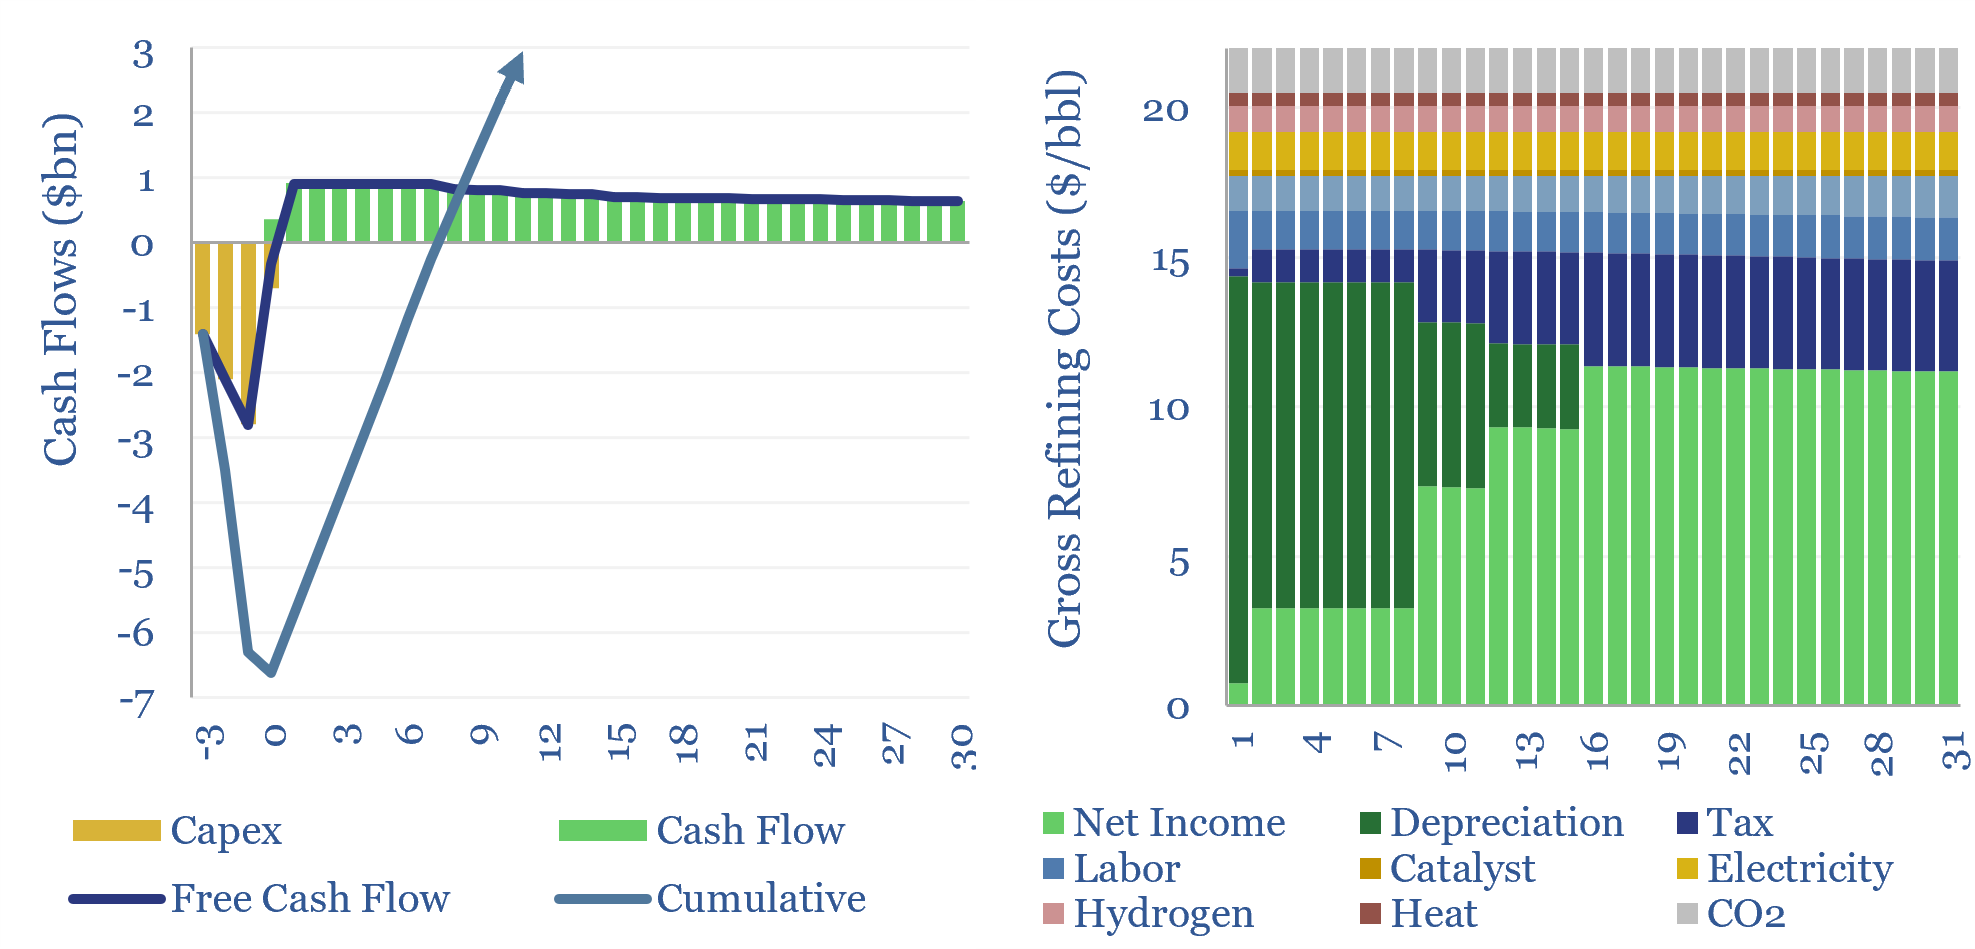
Oil refining: the economics?

The economics of oil refining are captured in this data-file, requiring a crack spread above $20/bbl to generate a 10% IRR on a new, greenfield oil refinery in the developed world, with $35M/kbpd in capex costs. Crack spreads have run at $11/bbl in the past decade, hence capacity utilization is tightening.
-
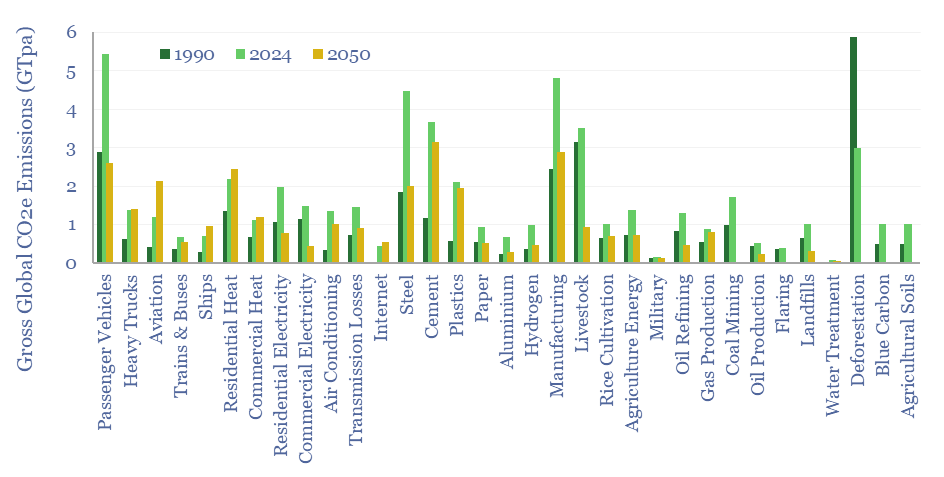
Global CO2 emissions breakdown?

Global CO2 emissions rose from 32GTpa of CO2-equivalents in 1990 to 54GTpa in 2024, and are seen optimistically declining to 30GTpa by 2050, on a gross basis. This global CO2 emisisons breakdown covers 33 sources that each explain over 0.5% of global CO2e emissions, as a way of tracking emissions by source, by year, and…
-
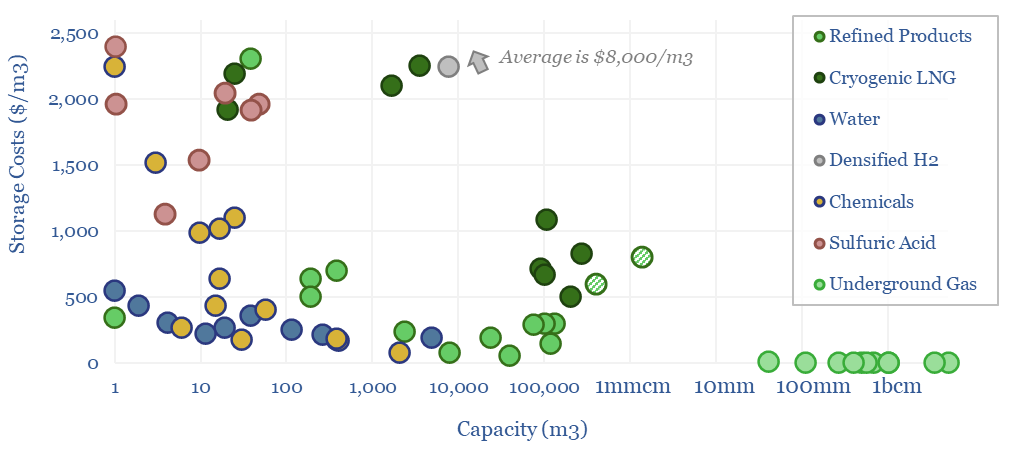
Storage tank costs: storing oil, energy, water and chemicals?

Storage tank costs are tabulated in this data-file, averaging $100-300/m3 for storage systems of 10-10,000 m3 capacity. Costs are 2-10x higher for corrosive chemicals, cryogenic storage, or very large/small storage facilities. Some rules of thumb are outlined below with underlying data available in the Excel.
-
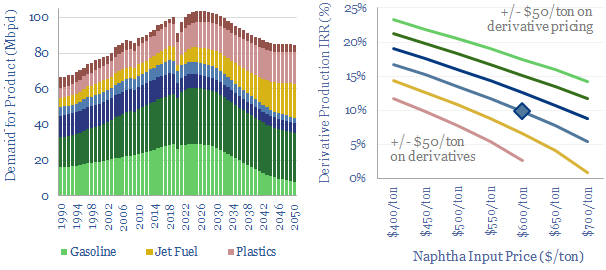
Crude to chemicals: there will be naphtha?

Oil markets are transitioning, with electric vehicles displacing 20Mbpd of gasoline by 2050, while petrochemical demand rises by almost 10Mbpd. So it is often said oil refiners should ‘become chemicals companies’. It depends. This 18-page report charts petrochemical pathways and sees greater opportunity in chemicals that can absorb surplus BTX.
-
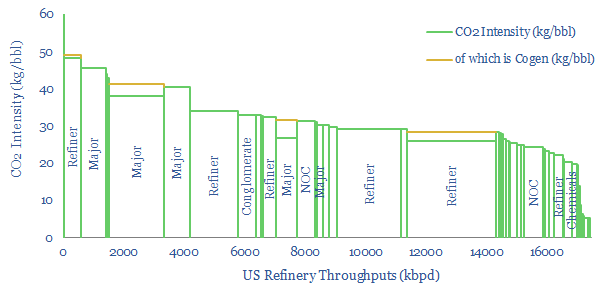
US Refinery Database: CO2 intensity by facility?

This US refinery database covers 125 US refining facilities, with an average capacity of 150kbpd, and an average CO2 intensity of 33 kg/bbl. Upper quartile performers emitted less than 20 kg/bbl, while lower quartile performers emitted over 40 kg/bbl. The goal of this refinery database is to disaggregate US refining CO2 intensity by company and…
Content by Category
- Batteries (96)
- Biofuels (44)
- Carbon Intensity (48)
- CCS (64)
- CO2 Removals (9)
- Coal (44)
- Commentary (65)
- Company Diligence (105)
- Data Models (928)
- Decarbonization (163)
- Demand (131)
- Digital (92)
- Downstream (47)
- Economic Model (222)
- Energy Efficiency (76)
- Hydrogen (63)
- Industry Data (311)
- LNG (56)
- Materials (86)
- Metals (89)
- Midstream (45)
- Natural Gas (163)
- Nature (76)
- Nuclear (28)
- Oil (178)
- Patents (39)
- Plastics (44)
- Power Grids (156)
- Renewables (153)
- Screen (139)
- Semiconductors (36)
- Shale (58)
- Solar (72)
- Supply-Demand (53)
- Vehicles (94)
- Video (24)
- Wind (46)
- Written Research (410)