Hydrocarbons denote commodities that are extracted from the Earth, composed of carbon and hydrogen, refined, and then combusted for energy or converted into useful materials. Hydrocarbons currently supply over 80% of the world’s useful energy, evenly split across natural gas (methane), oil products and coal. A crucial objective in the energy transition is to maintain hydrocarbon supplies, economically, in order to prevent debilitating energy shortages, and to fuel the transition itself. Other crucial objectives are to reduce hydrocarbons’ CO2 intensity (Scope 1&2), shift to lower-carbon hydrocarbons (e.g., coal to gas switching), improve efficiency factors; and then abate all of the remaining CO2, including via pre-combustion CCS, post-combustion CCS and nature-based solutions. Opportunities in our recent hydrocarbon research are explored below.
Oil Research
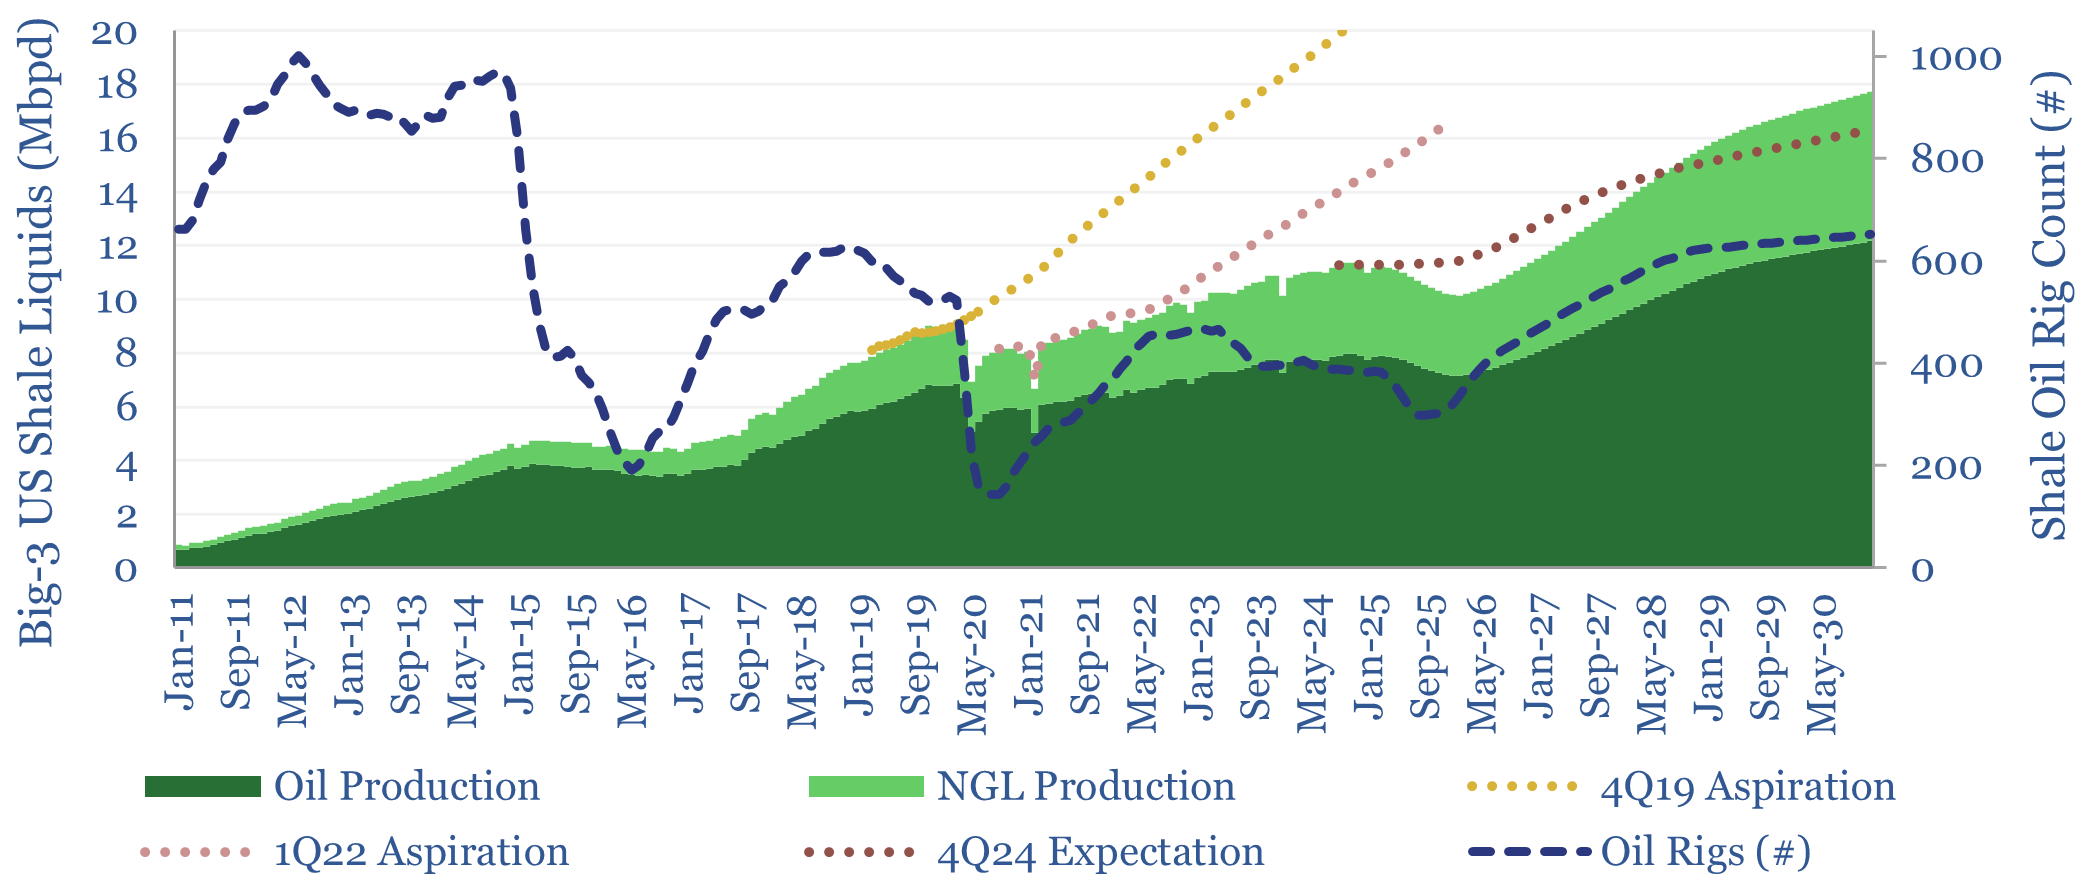
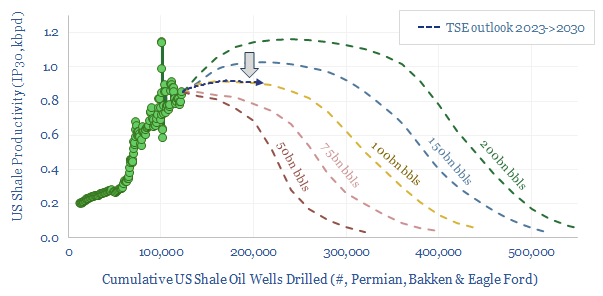
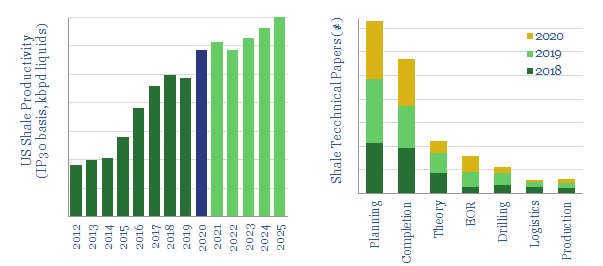
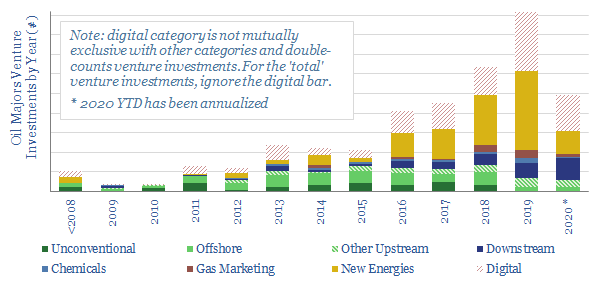
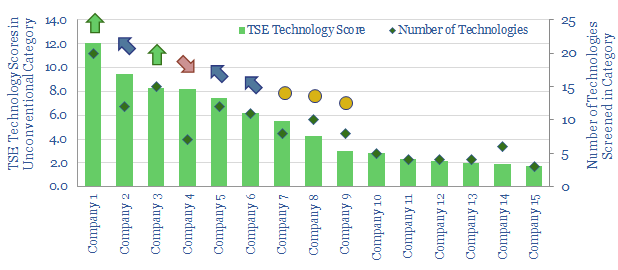
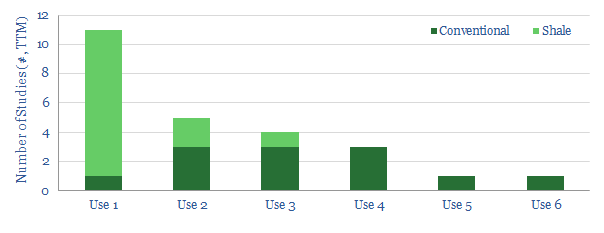
US shale: outlook and forecasts?
Download
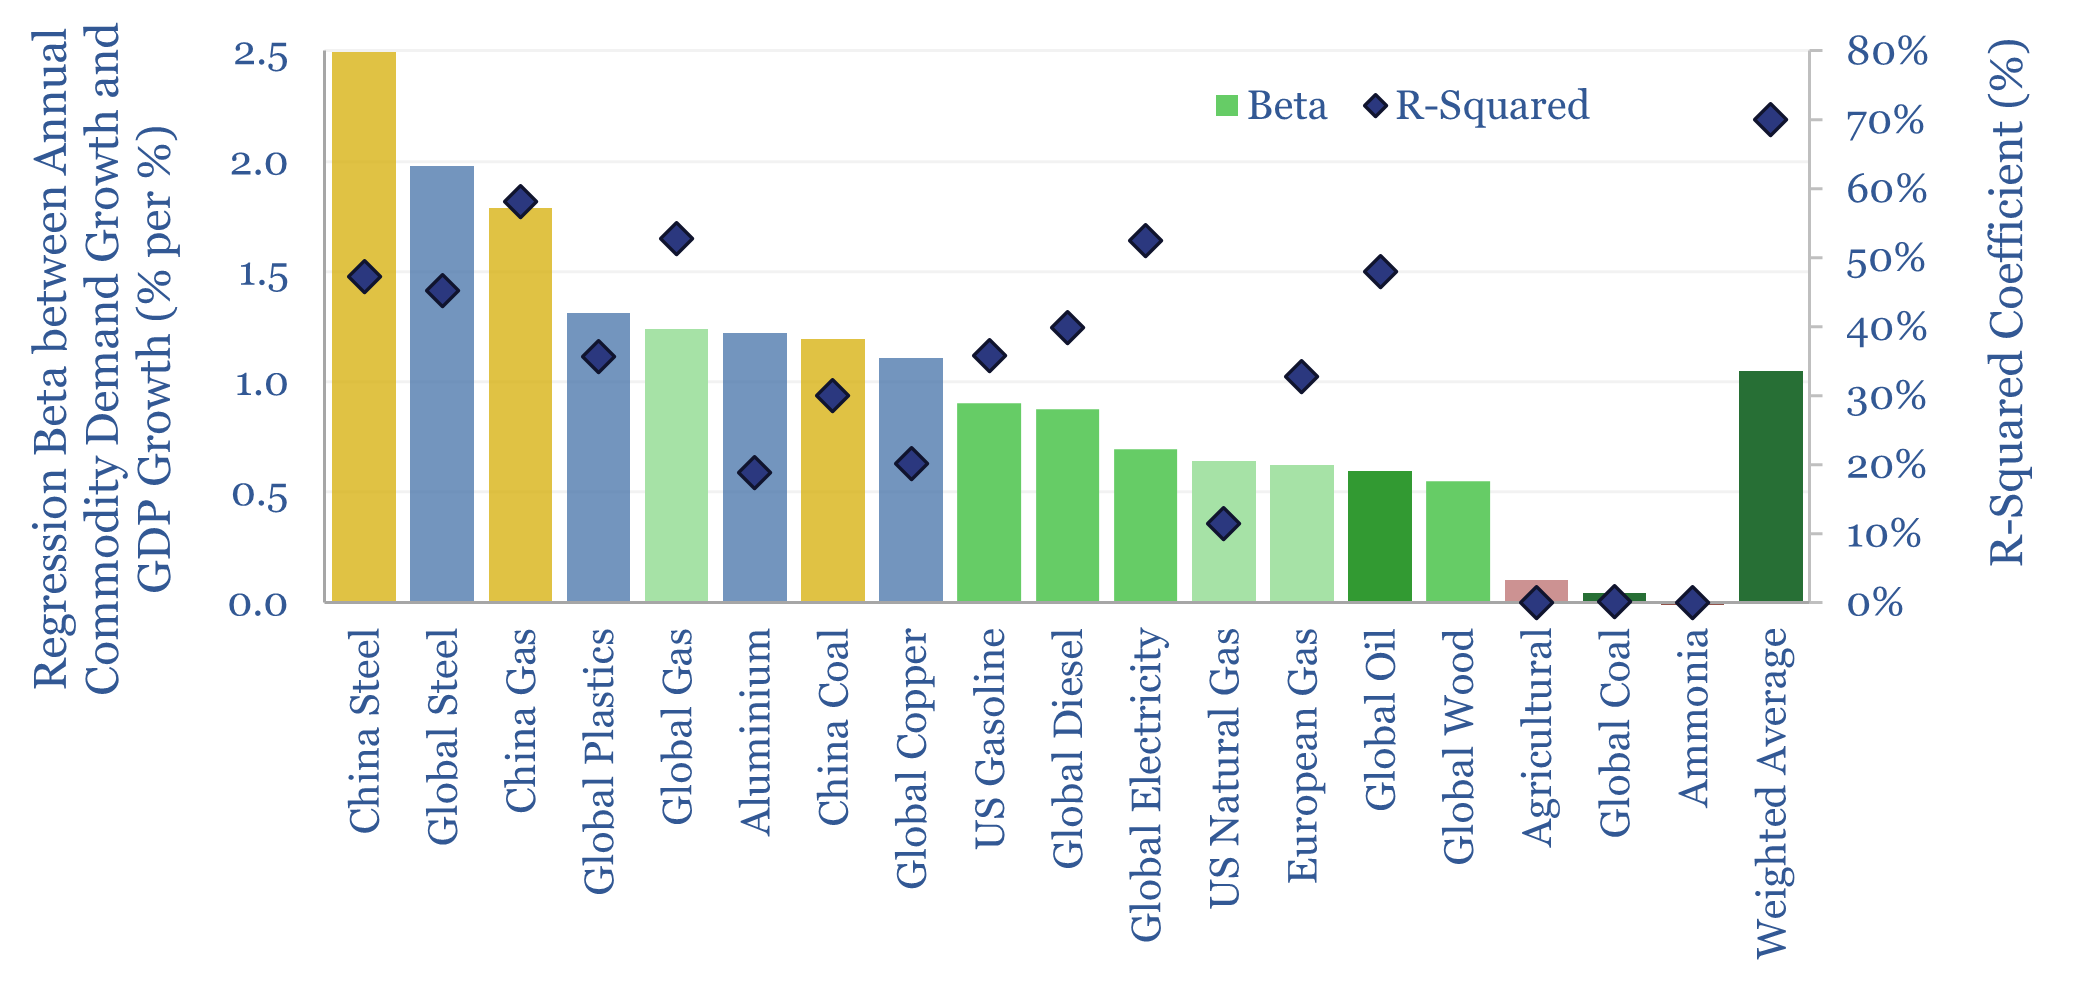
Commodity demand: how sensitive to GDP growth?
Download
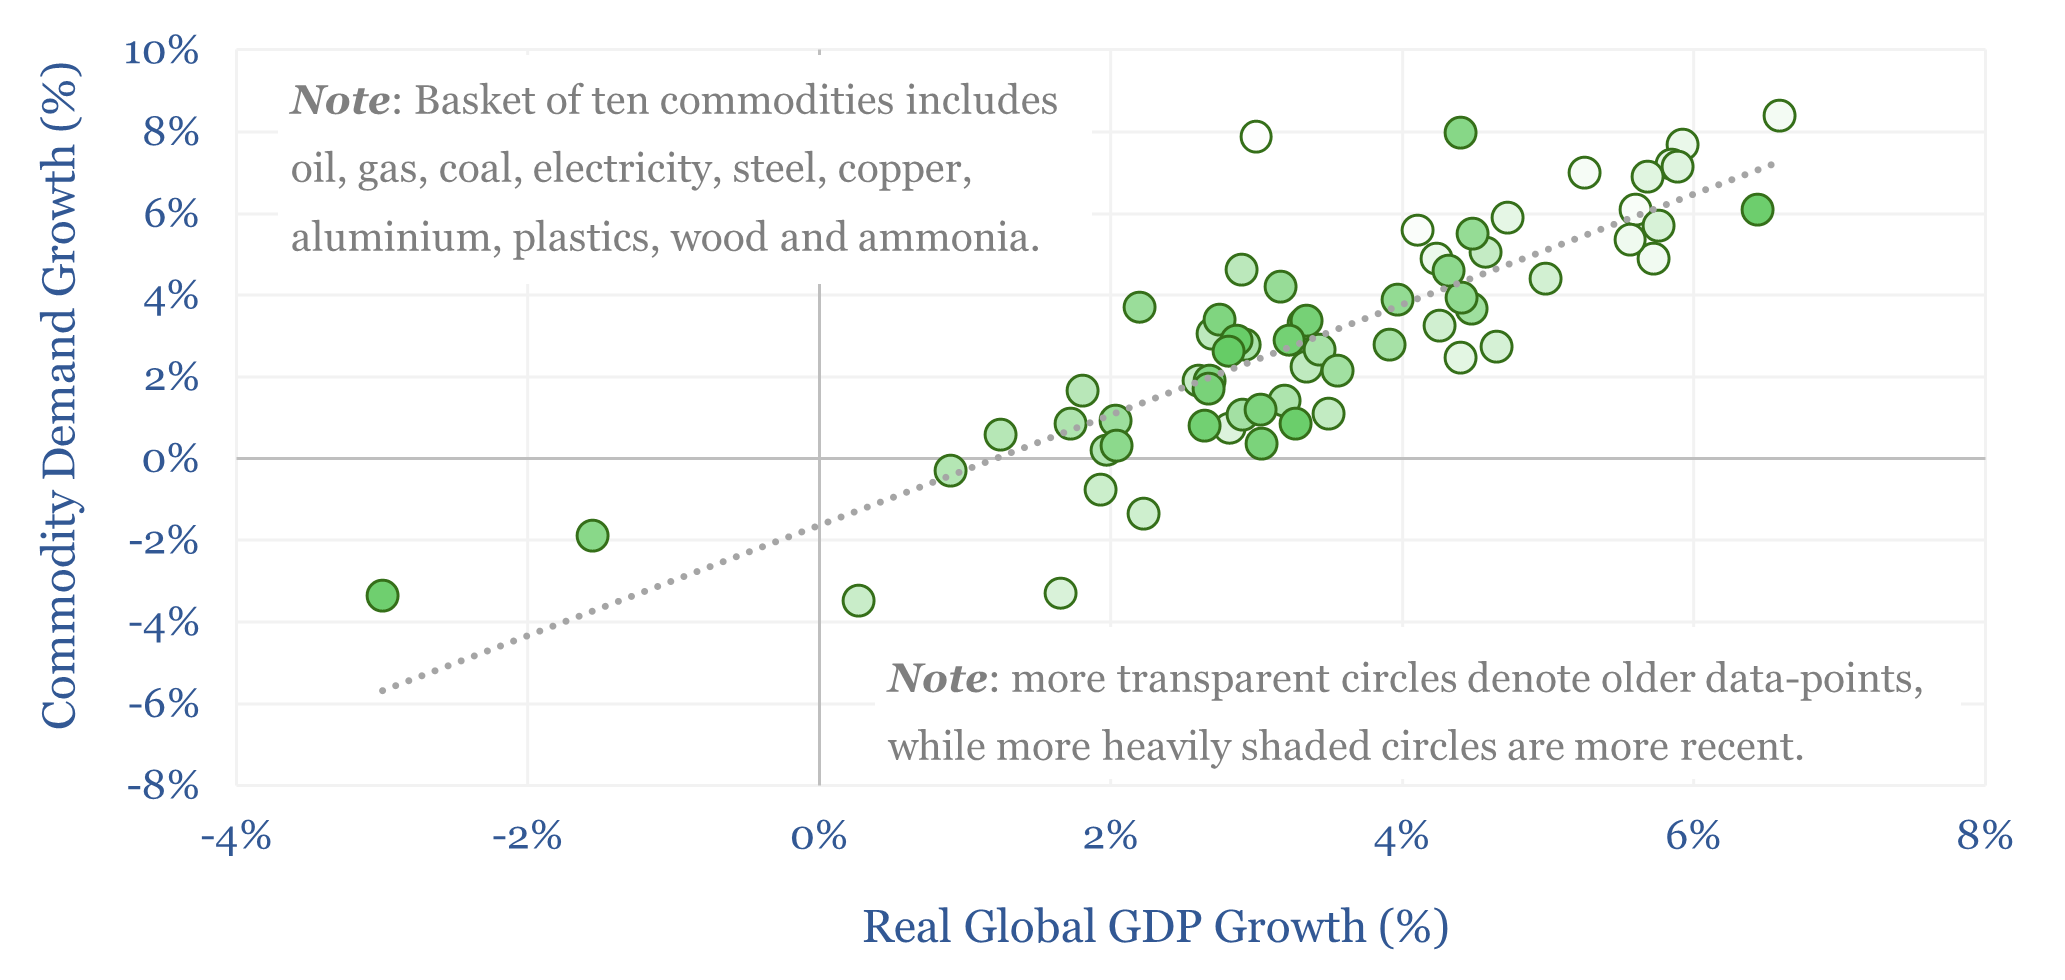
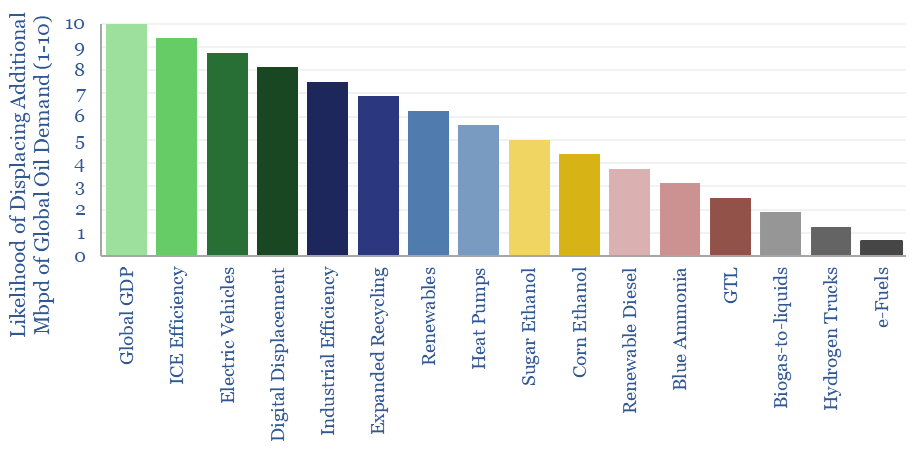
Global commodity demand: sensitivity to GDP?
Download
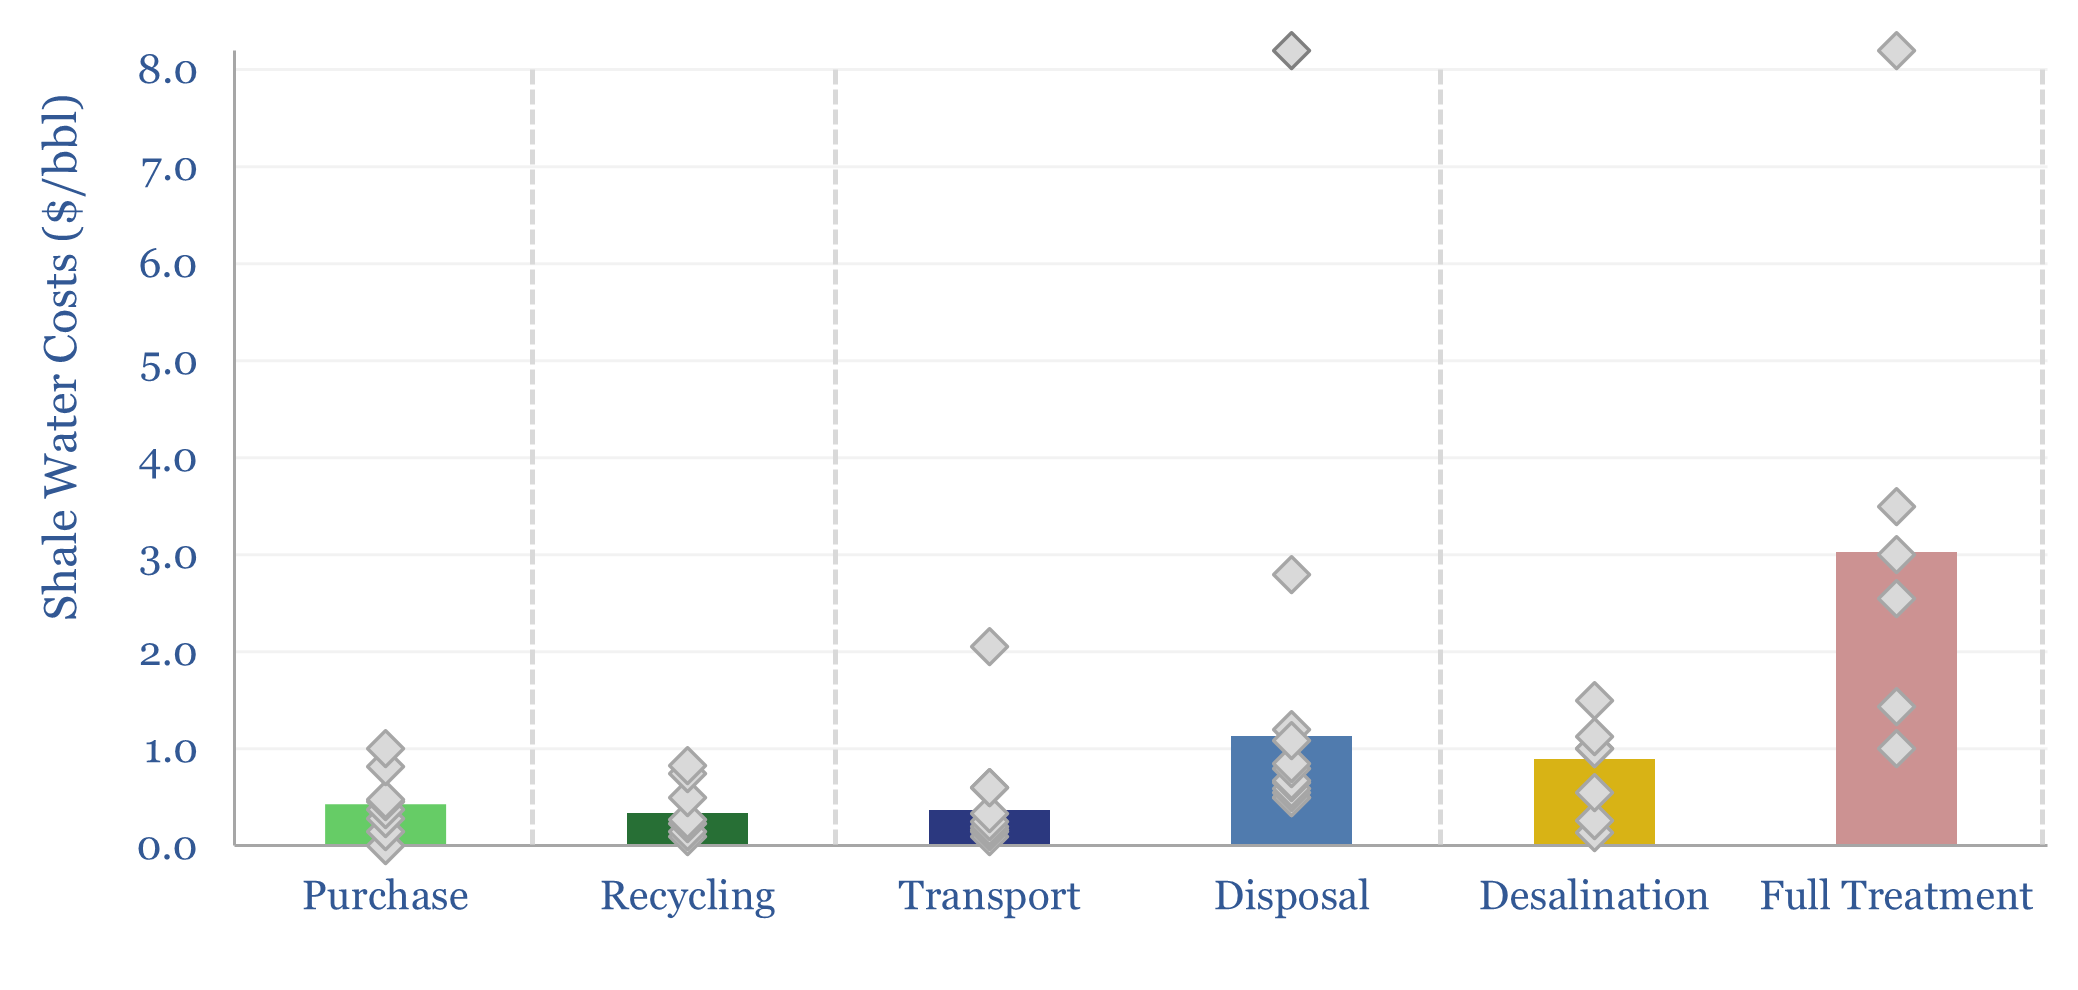
Shale water costs: transport, treatment and disposal?
Download
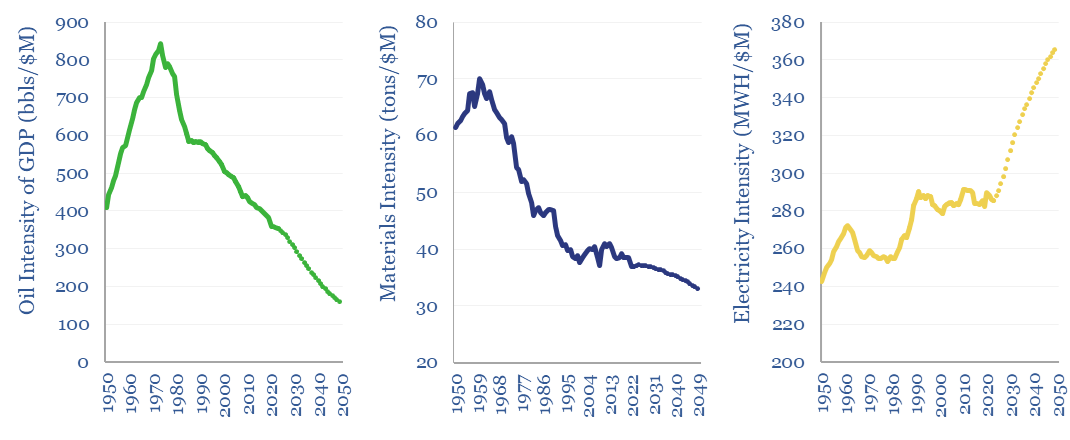
Commodity intensity of global GDP in 30 key charts?
Download
Oil demand: making millions?
Download
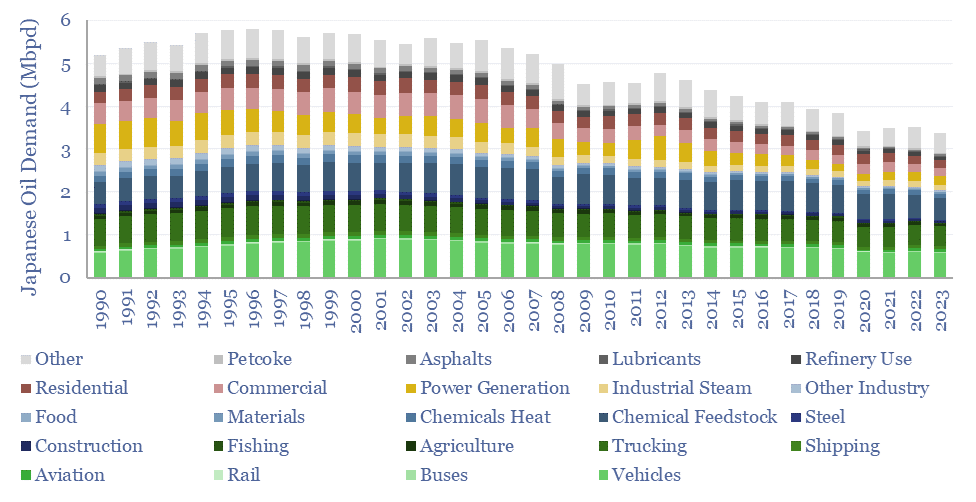
Japan oil demand: breakdown over time?
Download
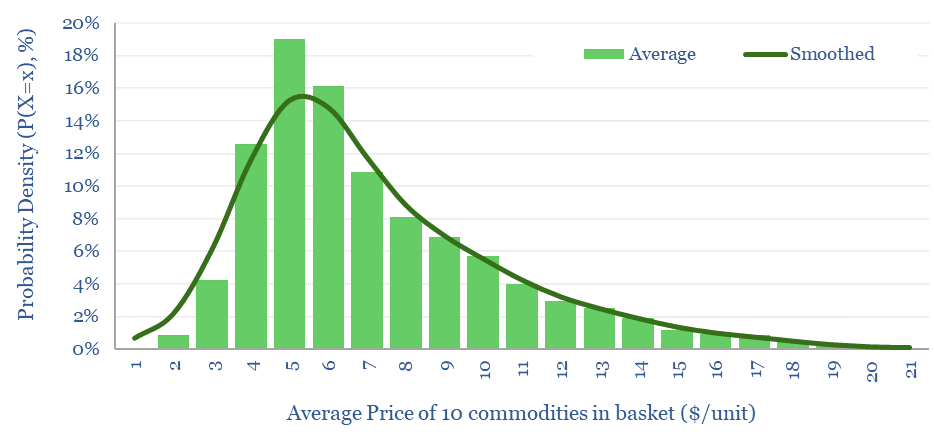
Commodity price volatility: energy, metals and ags?
Download
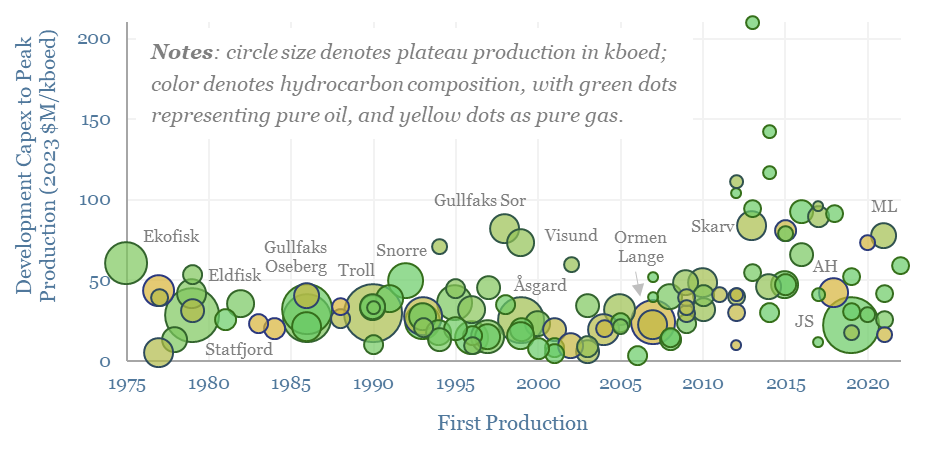
Offshore oilfields: development capex over time in Norway?
Download
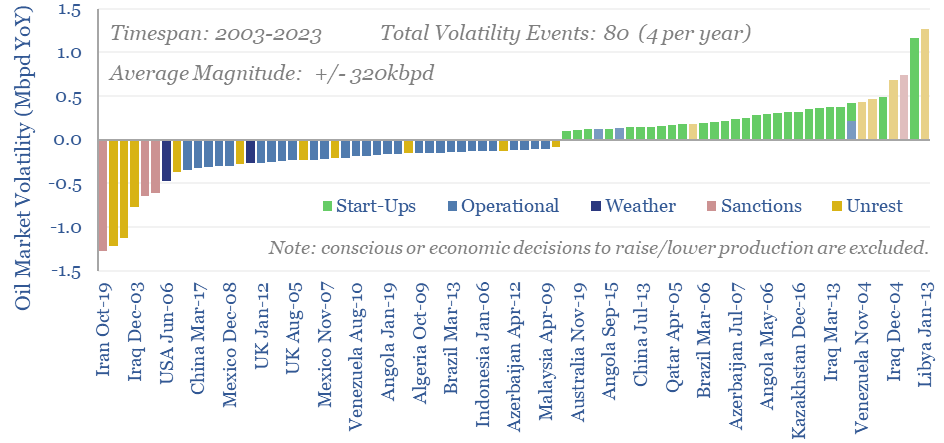
Oil markets: rising volatility?
Download
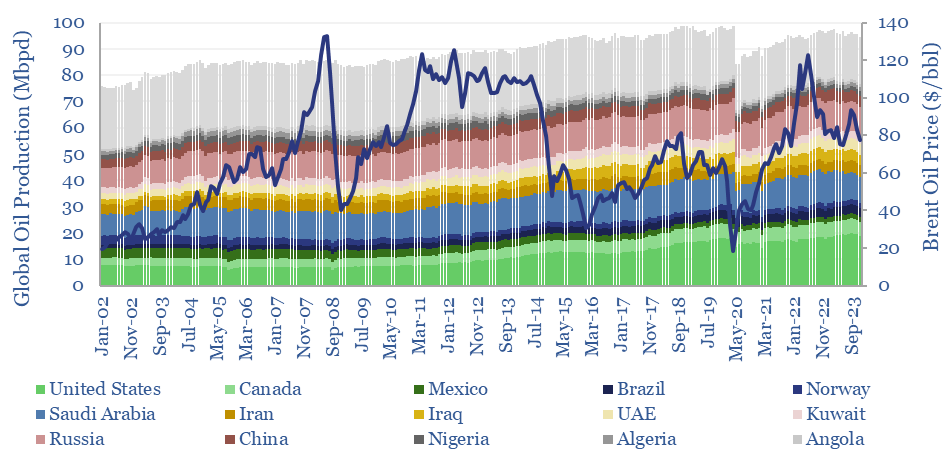
Global oil production by country?
Download
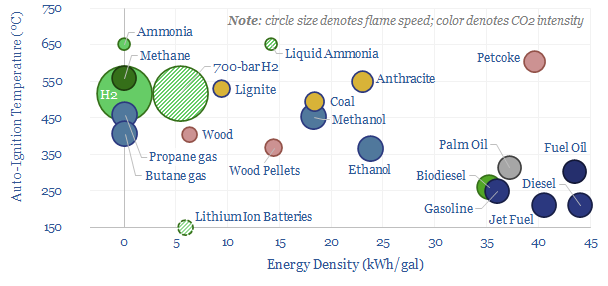
Combustion fuels: density, ignition temperature and flame speed?
Download
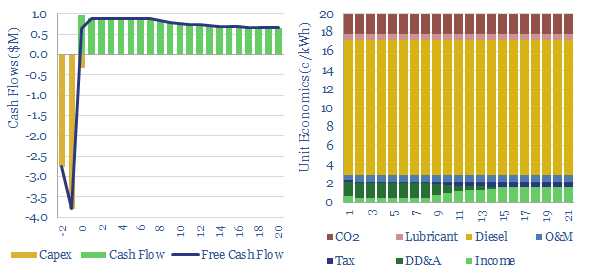
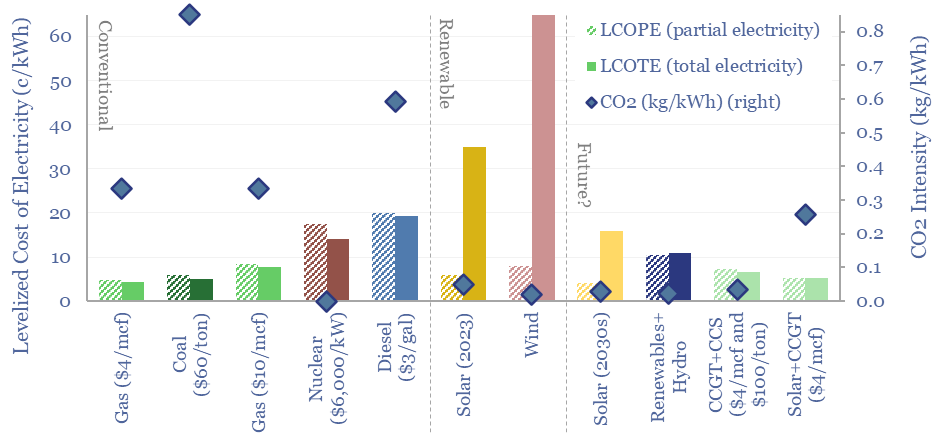
Diesel power generation: levelized costs?
Download
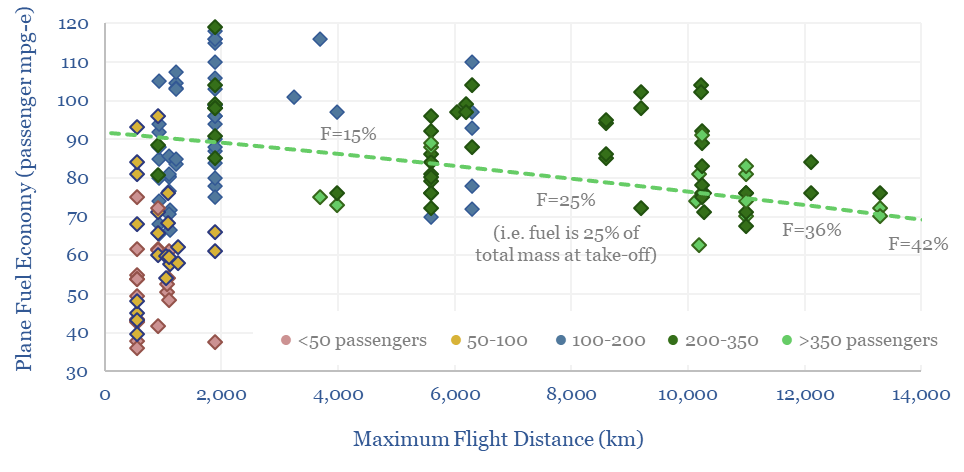
Commercial aviation: fuel economy of planes?
Download
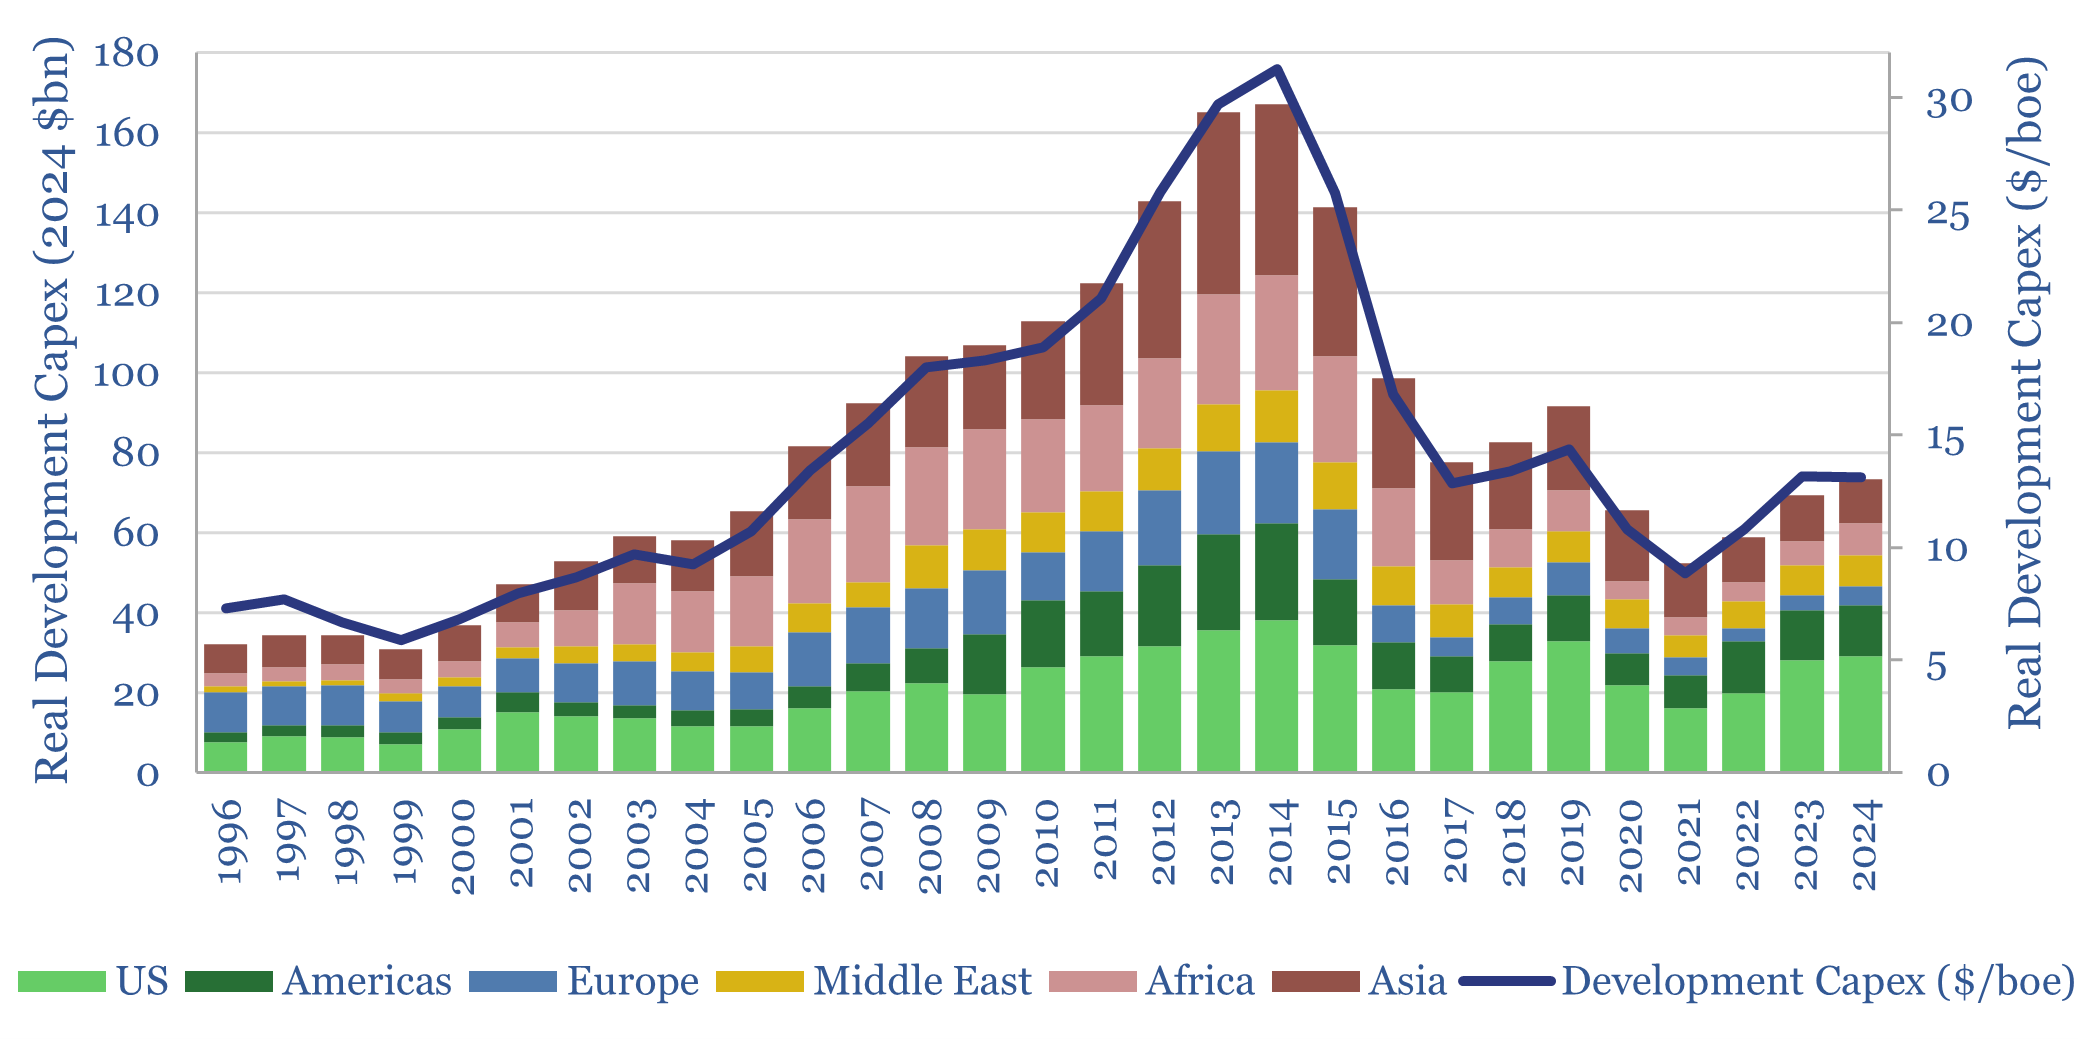
Development capex: long-term spending from Oil Majors?
Download
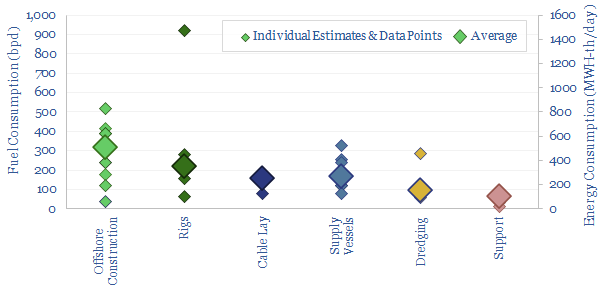
Offshore vessels: fuel consumption?
Download
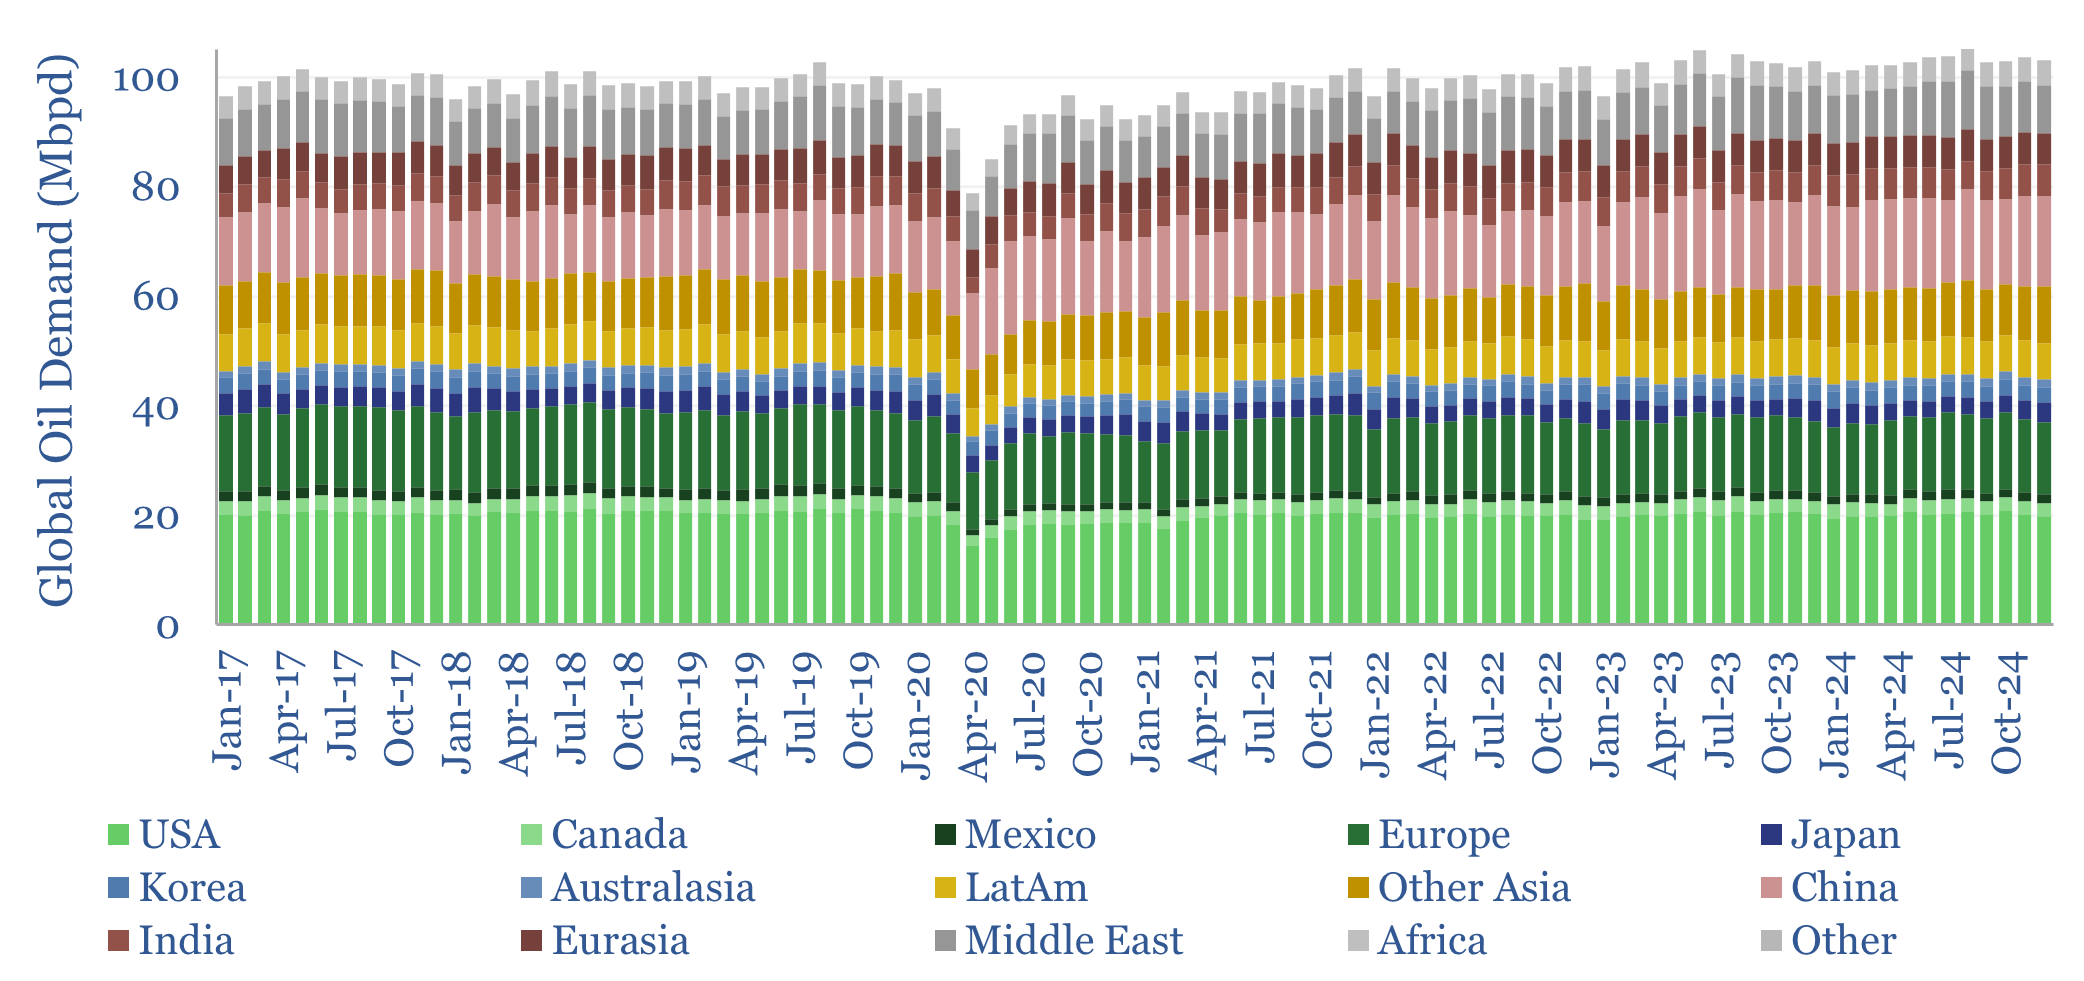
Global oil demand: breakdown by product by country?
Download
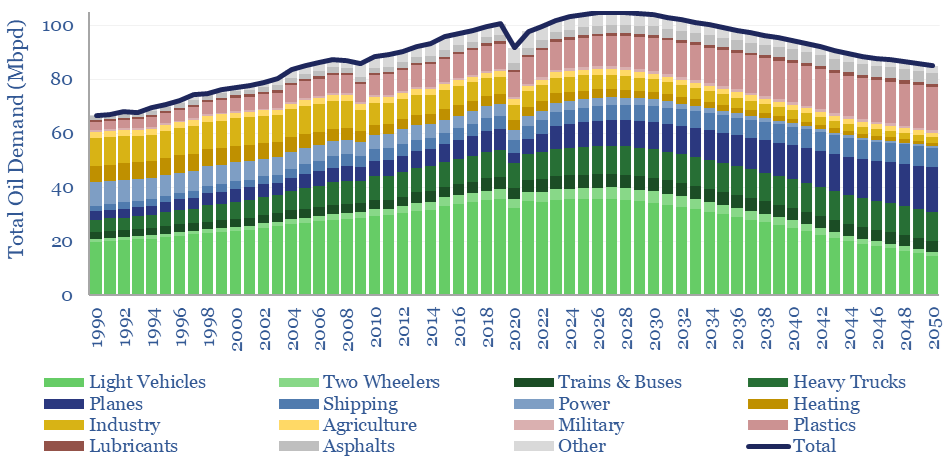
Global oil demand forecasts: by end use, by product, by region?
Download
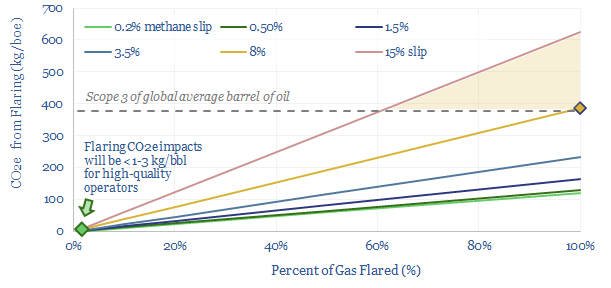
Flaring reduction: fire extinguishers?
Download
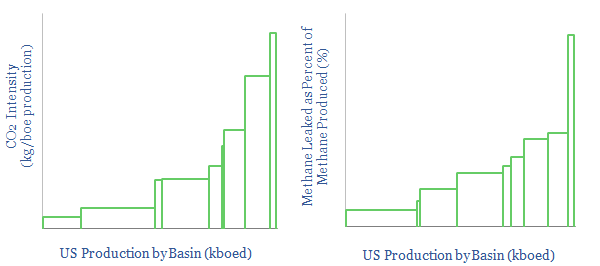
US CO2 and Methane Intensity by Basin
Download
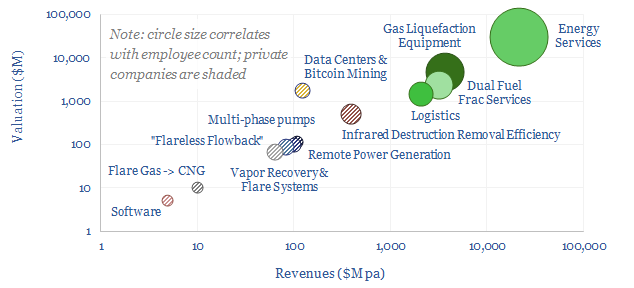
Flaring reduction: screen of service and equipment companies?
Download
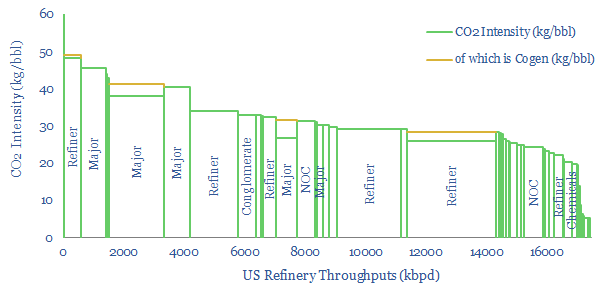
US Refinery Database: CO2 intensity by facility?
Download
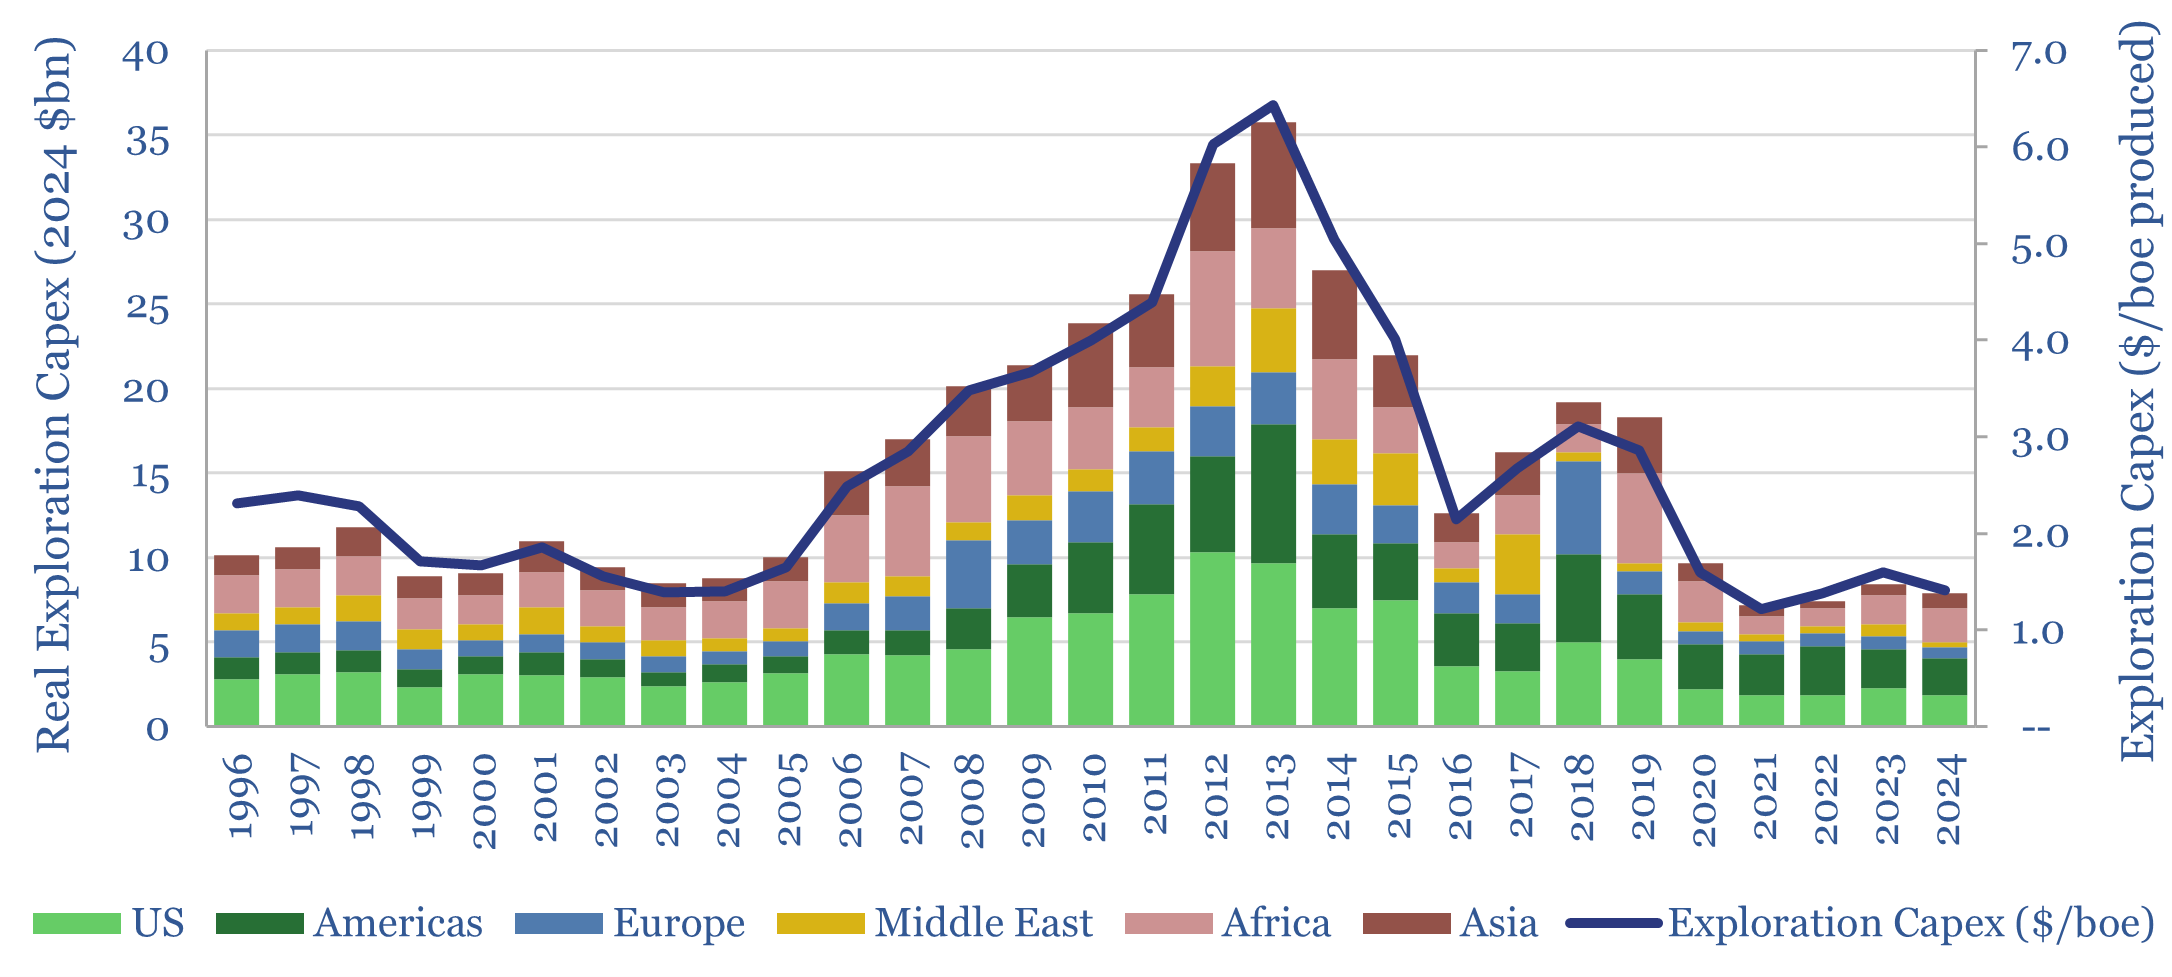
Exploration capex: long-term spending from Oil Majors?
Download
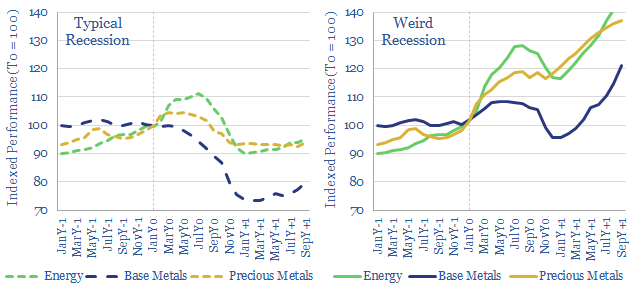
Weird recessions: can commodities de-couple?
Download
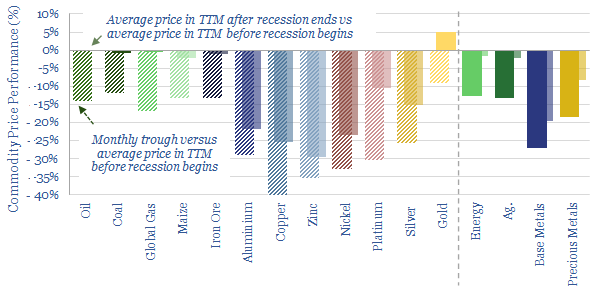
How do commodities perform during recessions?
Download
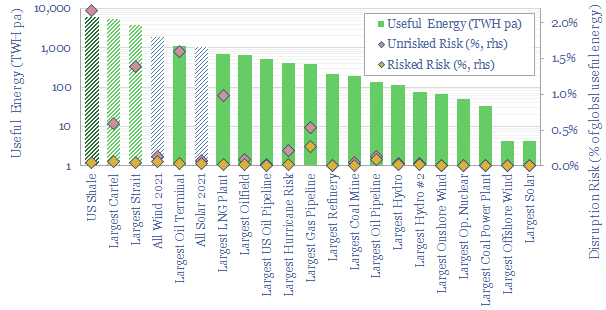
World’s largest energy assets: by category and risk?
Download
Offshore oil: marginal cost?
Download
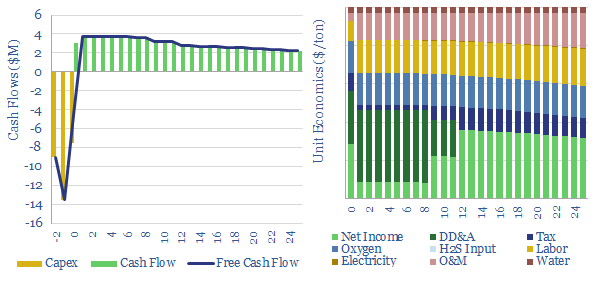
Sulphur recovery units: Claus process economics?
Download
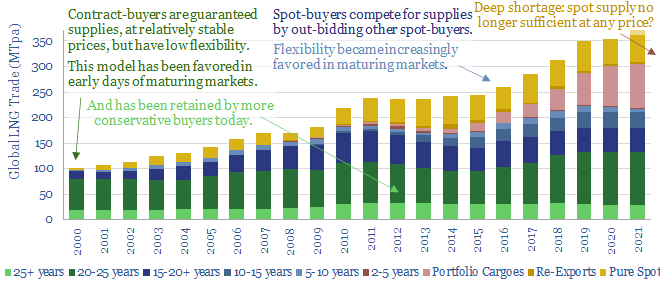
Energy security: the return of long-term contracts?
Download
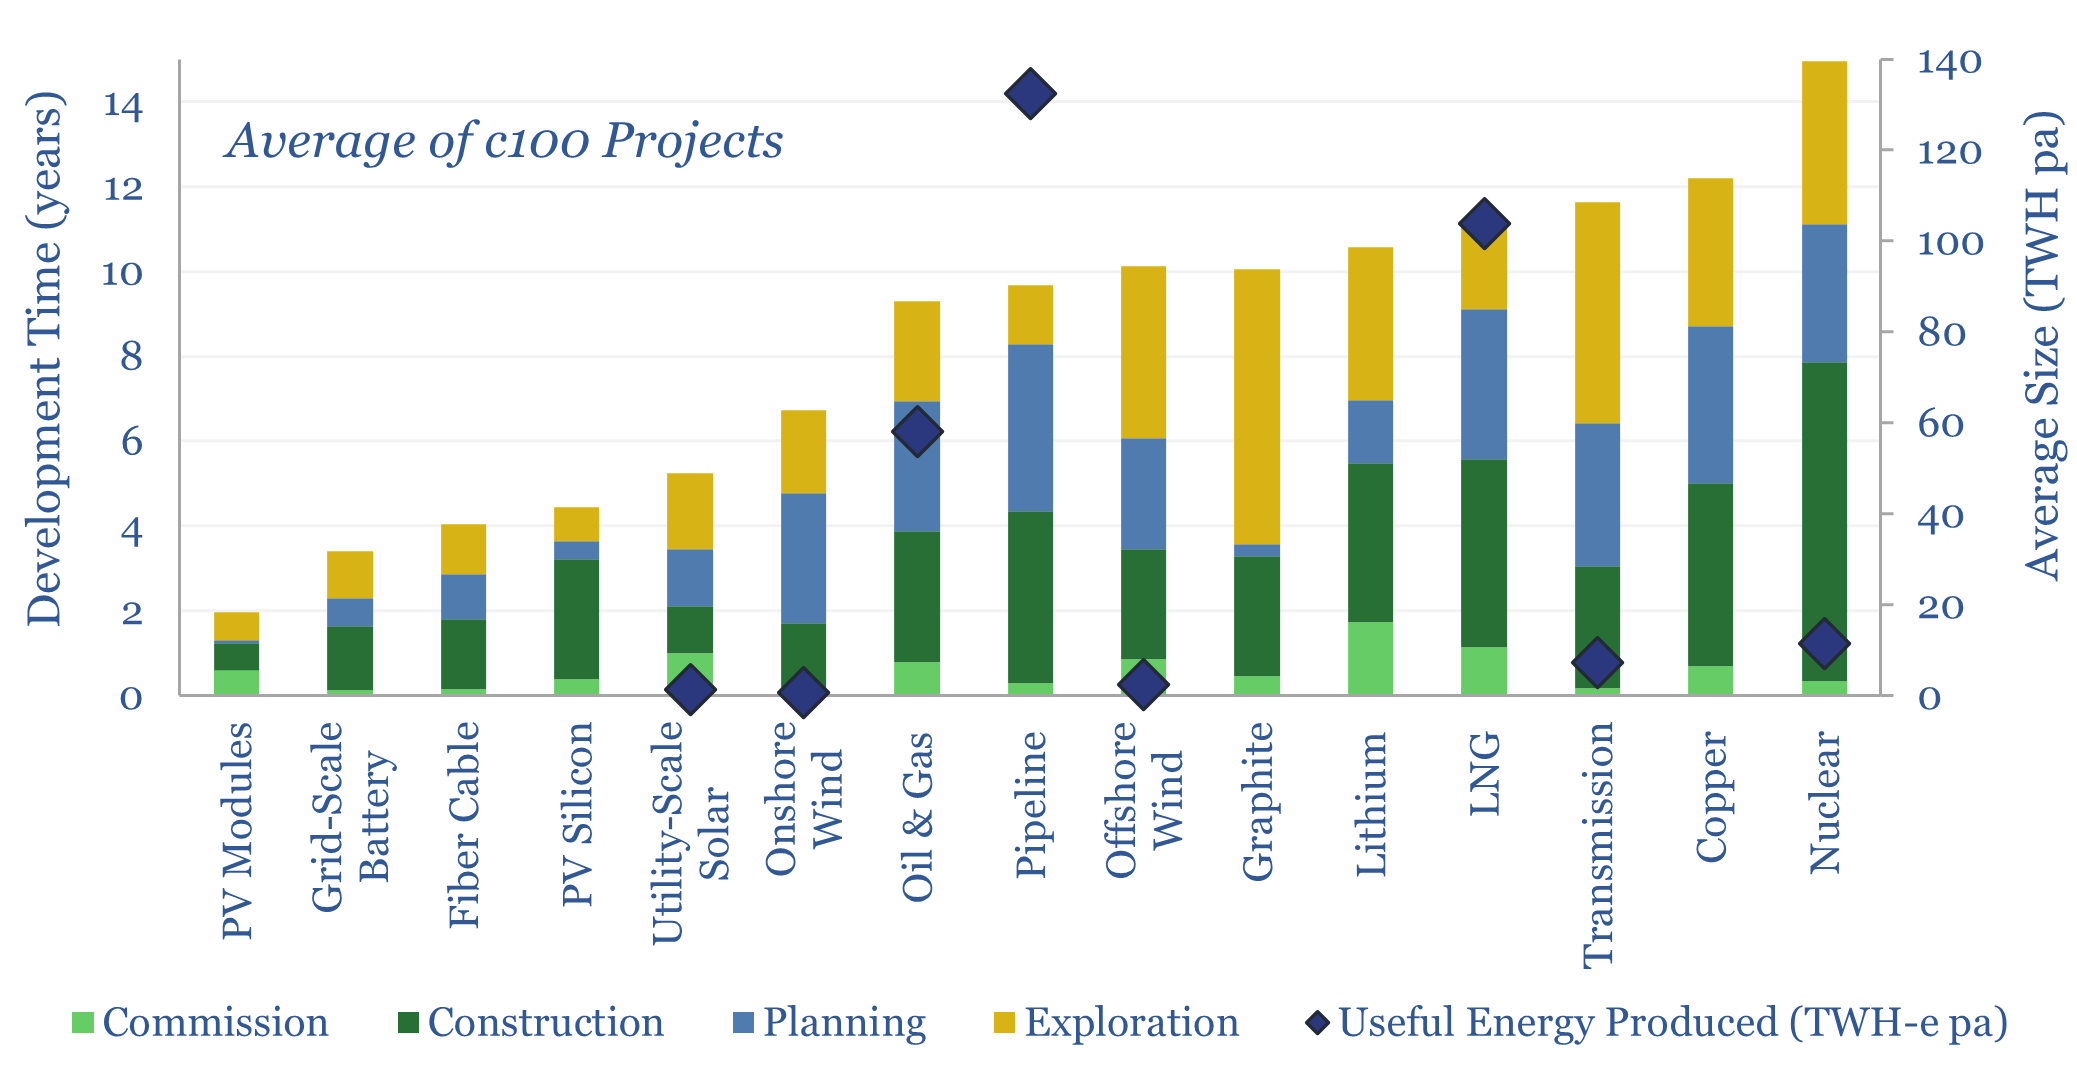
Energy development times: first consideration to full production?
Download
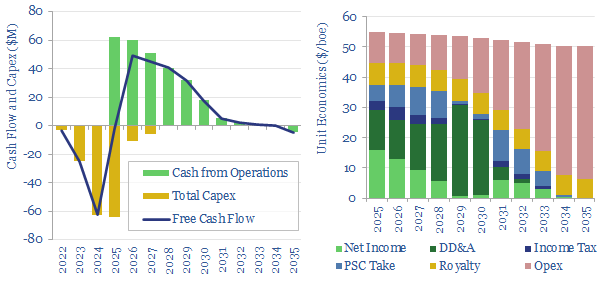
Oil storage terminals: the economics?
Download
Global oil demand: rumors of my death?
Download
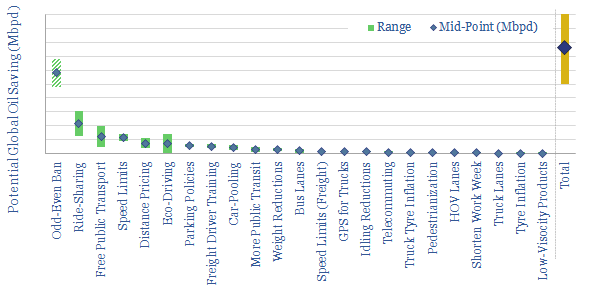
Oil demand: how much can you save in a crisis?
Download
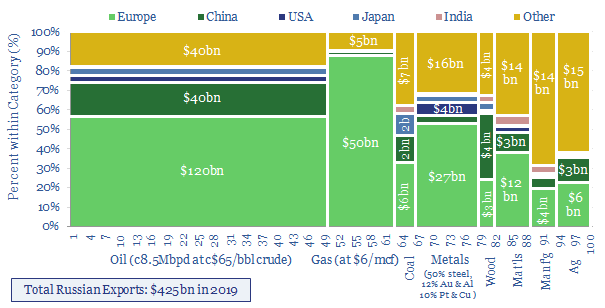
Russia: a breakdown of export revenues?
Download
US CCS: market sizing?
Download
Commercial aviation: air travel economics?
Download
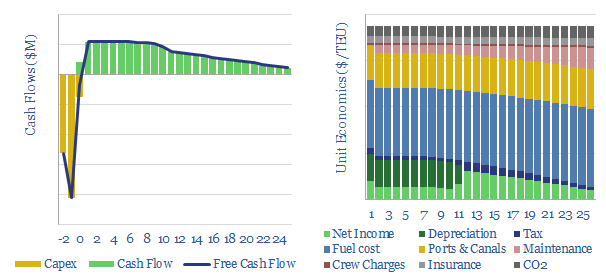
Container freight: shipping economics?
Download
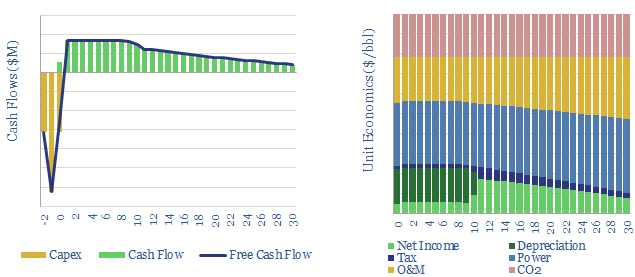
Electro-fuels: start out as a billionaire?
Download
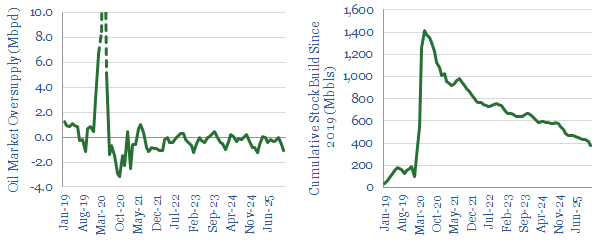
Oil markets: more balanced than ever before?
Download
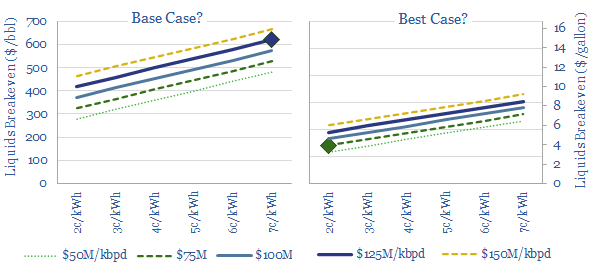
Power-to-liquids: the economics?
Download
Shale Research
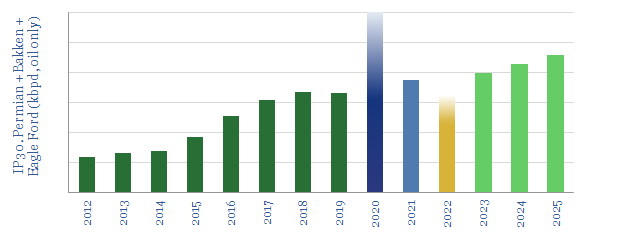
US shale: outlook and forecasts?
Download
Shale water costs: transport, treatment and disposal?
Download
Shale oil: fractured forecasts?
Download
Flaring reduction: fire extinguishers?
Download
US CO2 and Methane Intensity by Basin
Download
Flaring reduction: screen of service and equipment companies?
Download
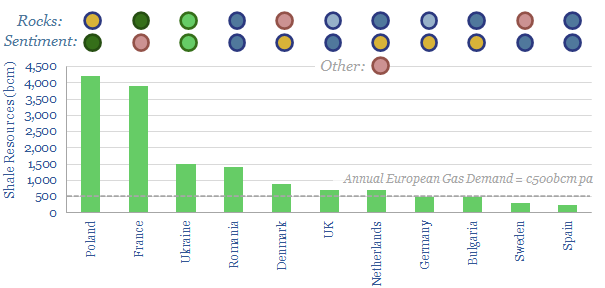
European shale: an overview?
Download
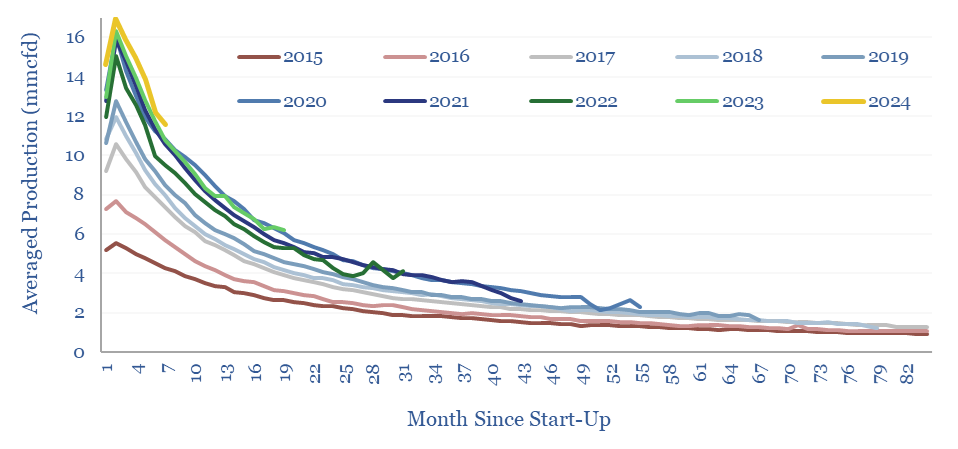
Marcellus shale: well by well production database?
Download
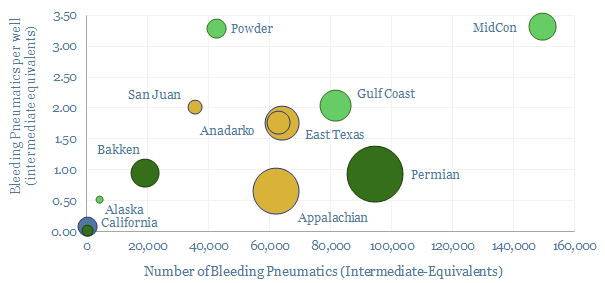
Methane emissions from pneumatic devices: by operator, by basin?
Download
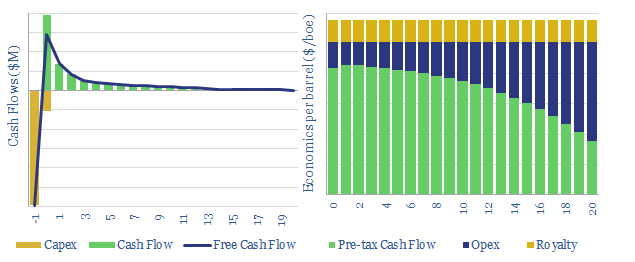
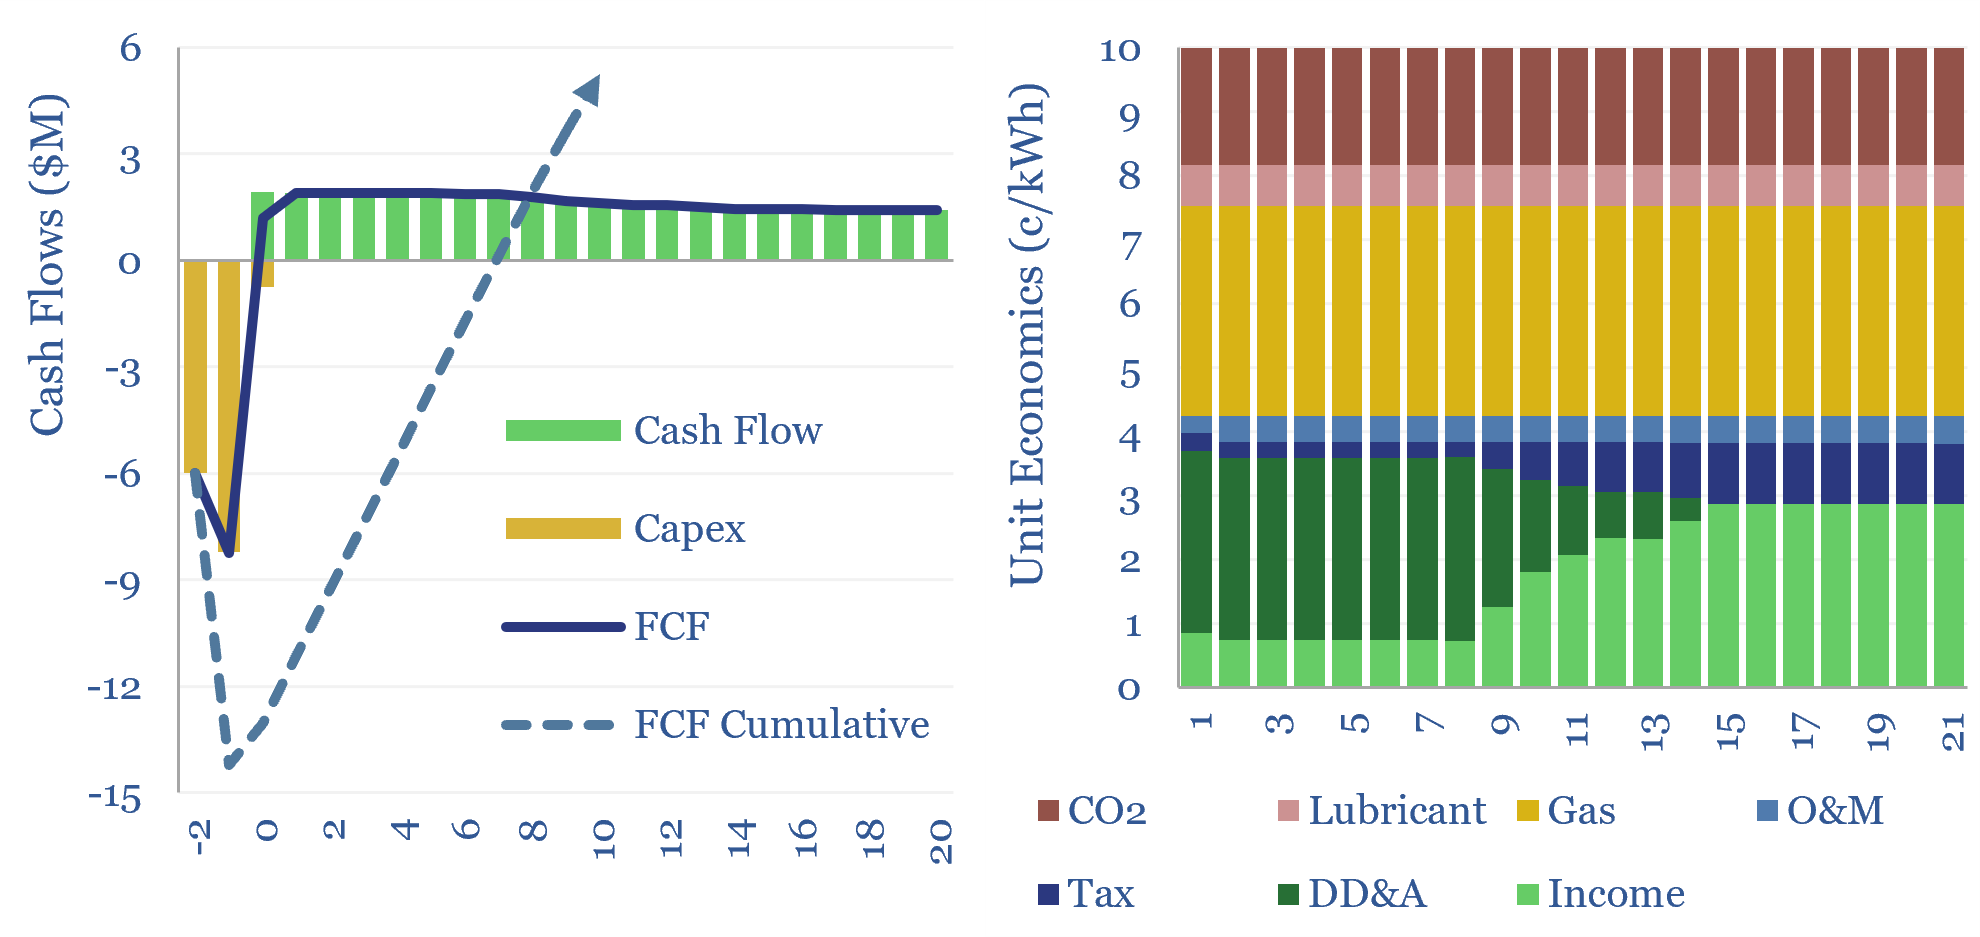
US shale gas: the economics?
Download
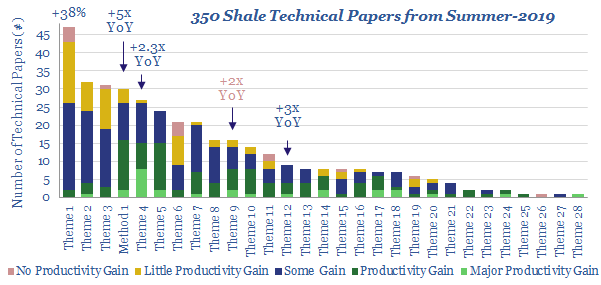
Shale productivity: snakes and ladders?
Download
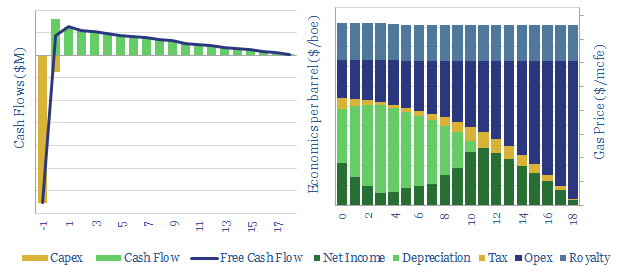
US shale: the economics?
Download
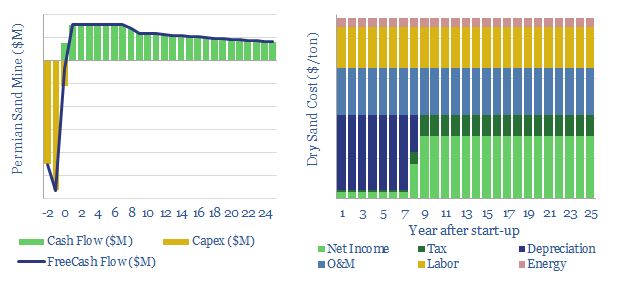
US shale sand mines: simple economics?
Download
US shale: our outlook in the energy transition?
Download
US Shale: the second coming?
Download
Ventures for an Energy Transition?
Download
US shale: the quick and the dead?
Download
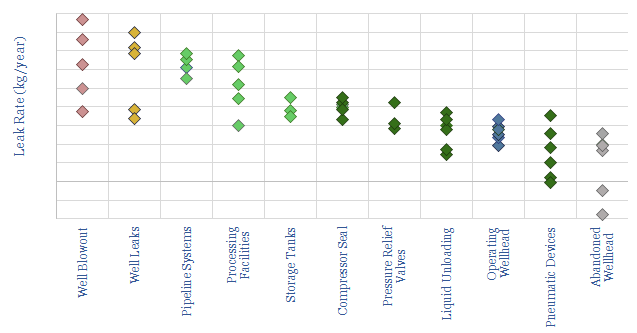
Fugitive methane: what components are leaking?
Download
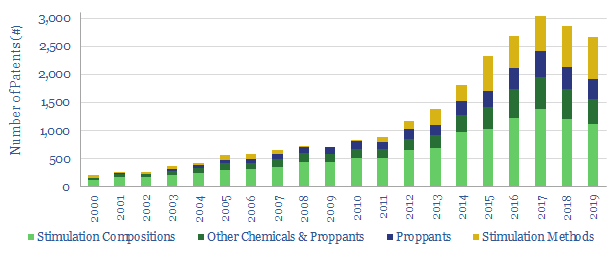
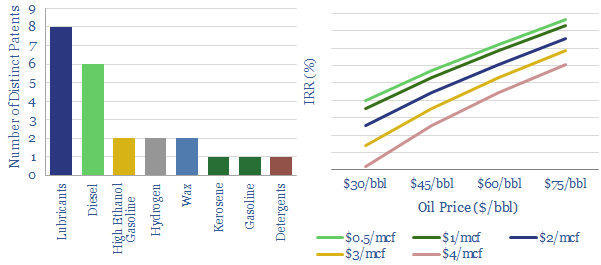
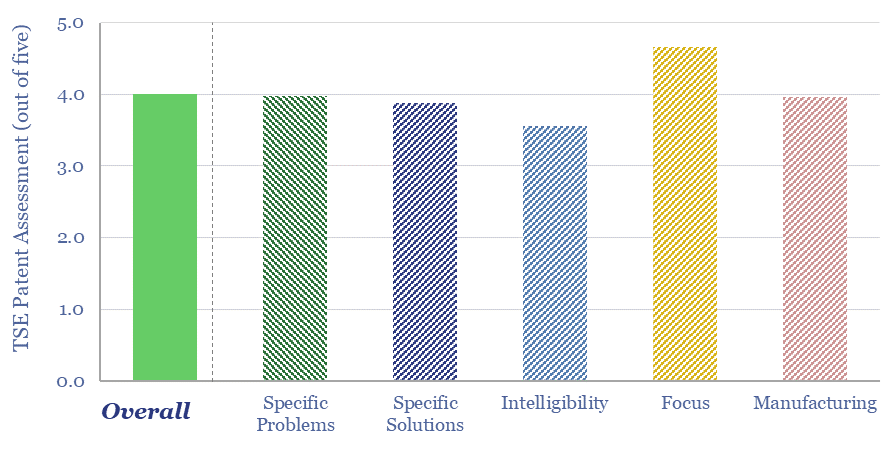
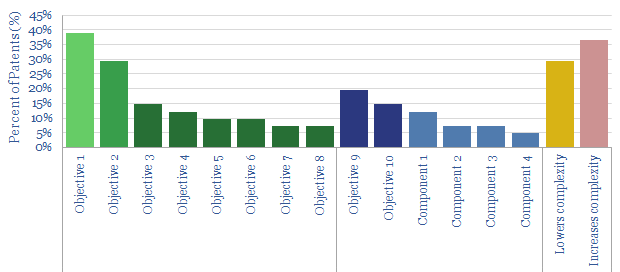
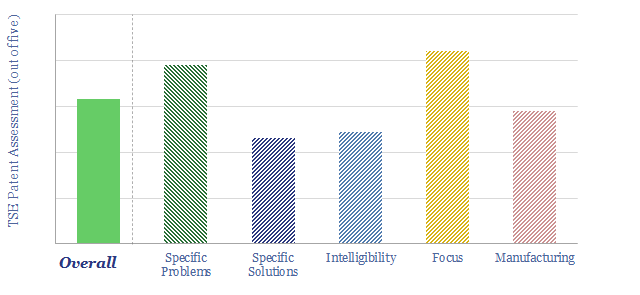
Hydraulic Fracturing: where’s the IP?
Download
Chevron: SuperMajor Shale in 2020?
Download
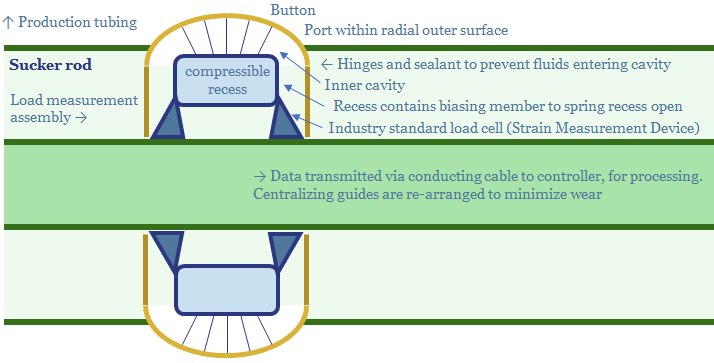
EOG’s Digitization: Pumped-Up?
Download
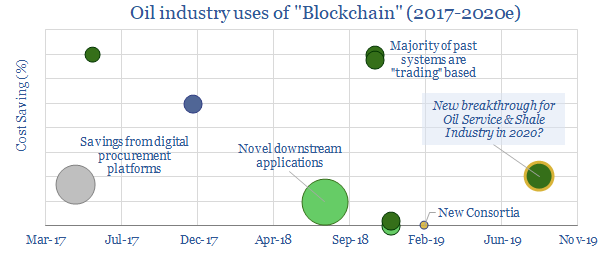
Blockchain in the Oil & Gas Supply Chain
Download
Ten Themes for Energy in 2020
Download
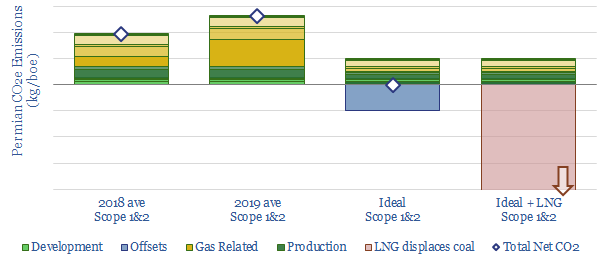
Shale growth: what if the Permian went CO2-neutral?
Download
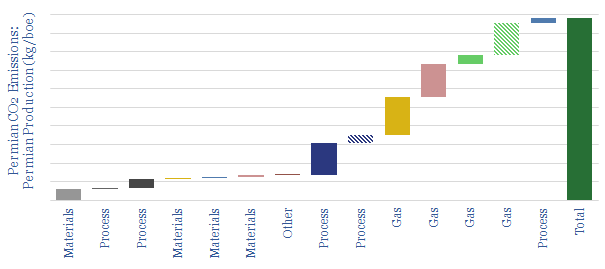
CO2 intensity of shale: breakdown by category?
Download
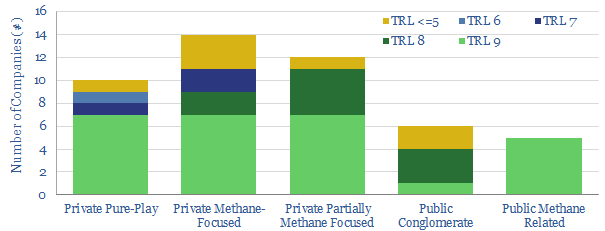
Screen of companies detecting methane leaks?
Download
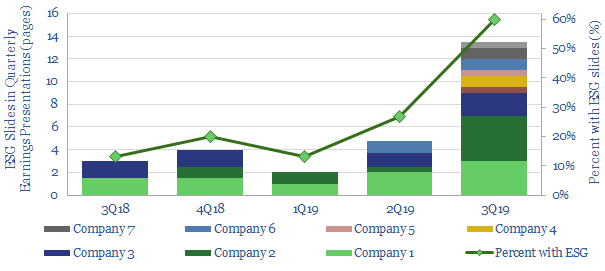
US E&Ps turn to ESG?
Download
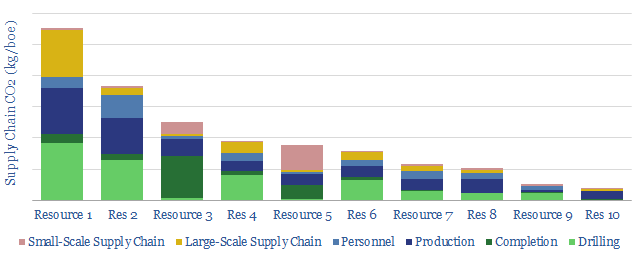
CO2 Intensity of Oilfield Supply Chains
Download
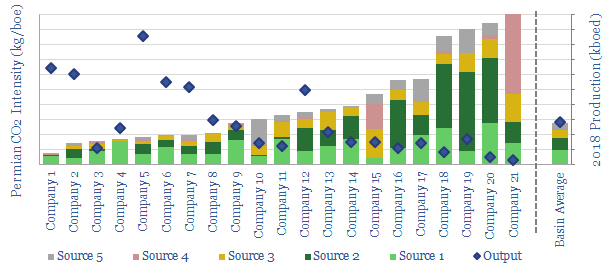
Permian CO2 Emissions by Producer
Download
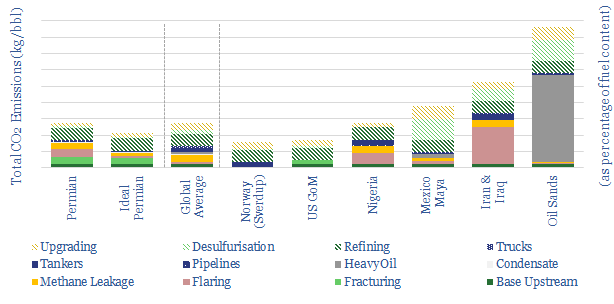
Oil industry CO2 per barrel?
Download
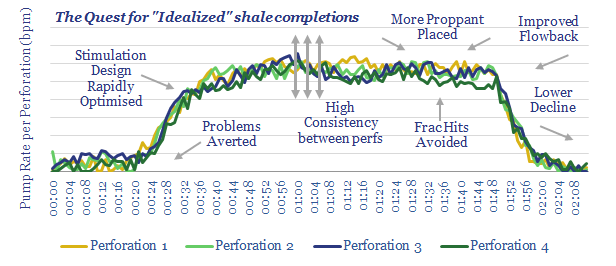
US Shale: No Country for Old Completion Designs
Download
US Shale Gas to Liquids?
Download
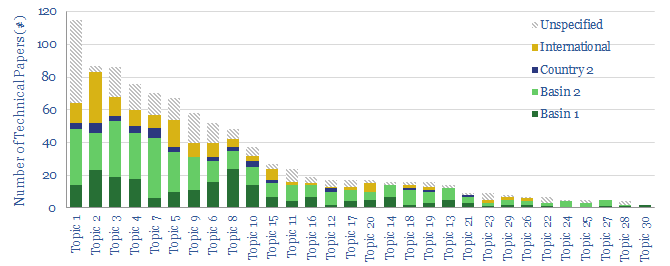
The cutting edge of shale technology?
Download
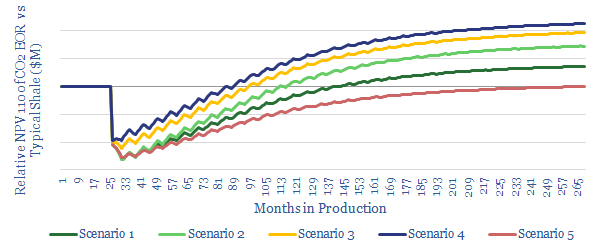
CO2-EOR in Shale: the economics
Download
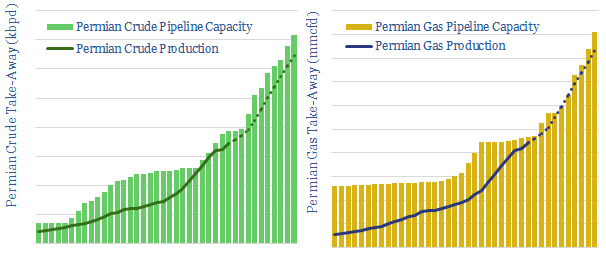
Permian Pipeline Bottlenecks?
Download
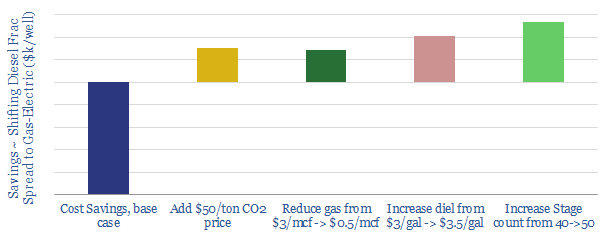
Dreaming of Electric Frac Fleets?
Download
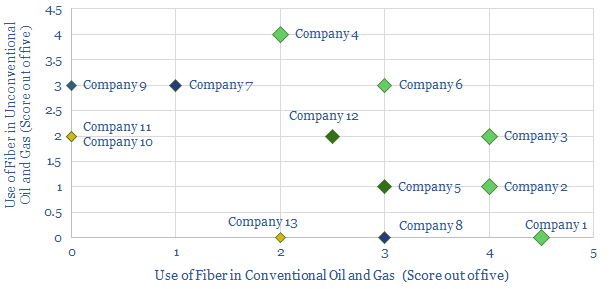
Shale: Upgrade to Fiber?
Download
Leading Companies in DAS?
Download
DAS. At the cutting edge in shale?
Download
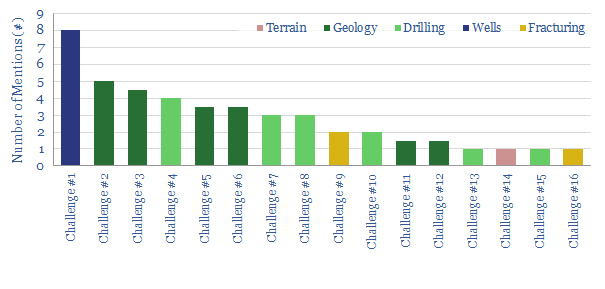
China’s Shale Challenge?
Download
Natural Gas Research
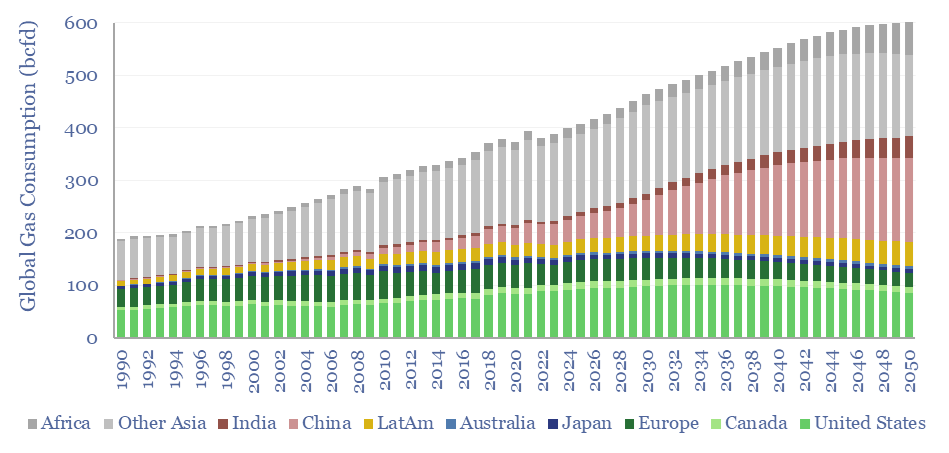
Global gas supply-demand in energy transition?
Download
Reciprocating gas engines: levelized costs?
Download
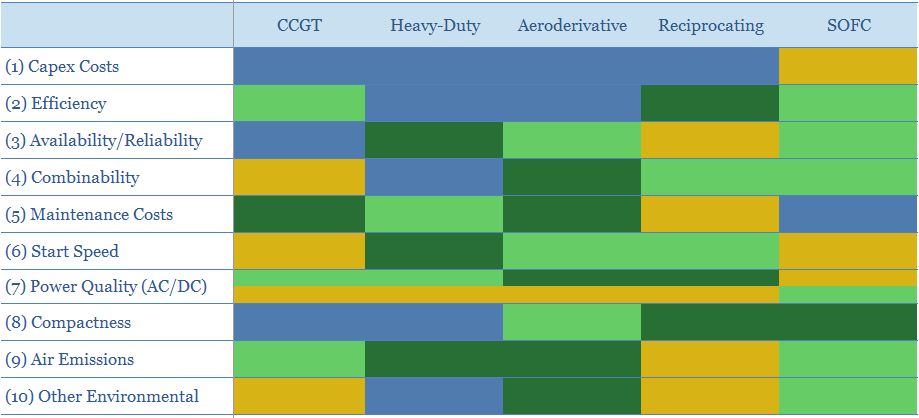
Gas generation: what kind of bear is best?
Download
VoltaGrid: mobile micro-grid technology?
Download
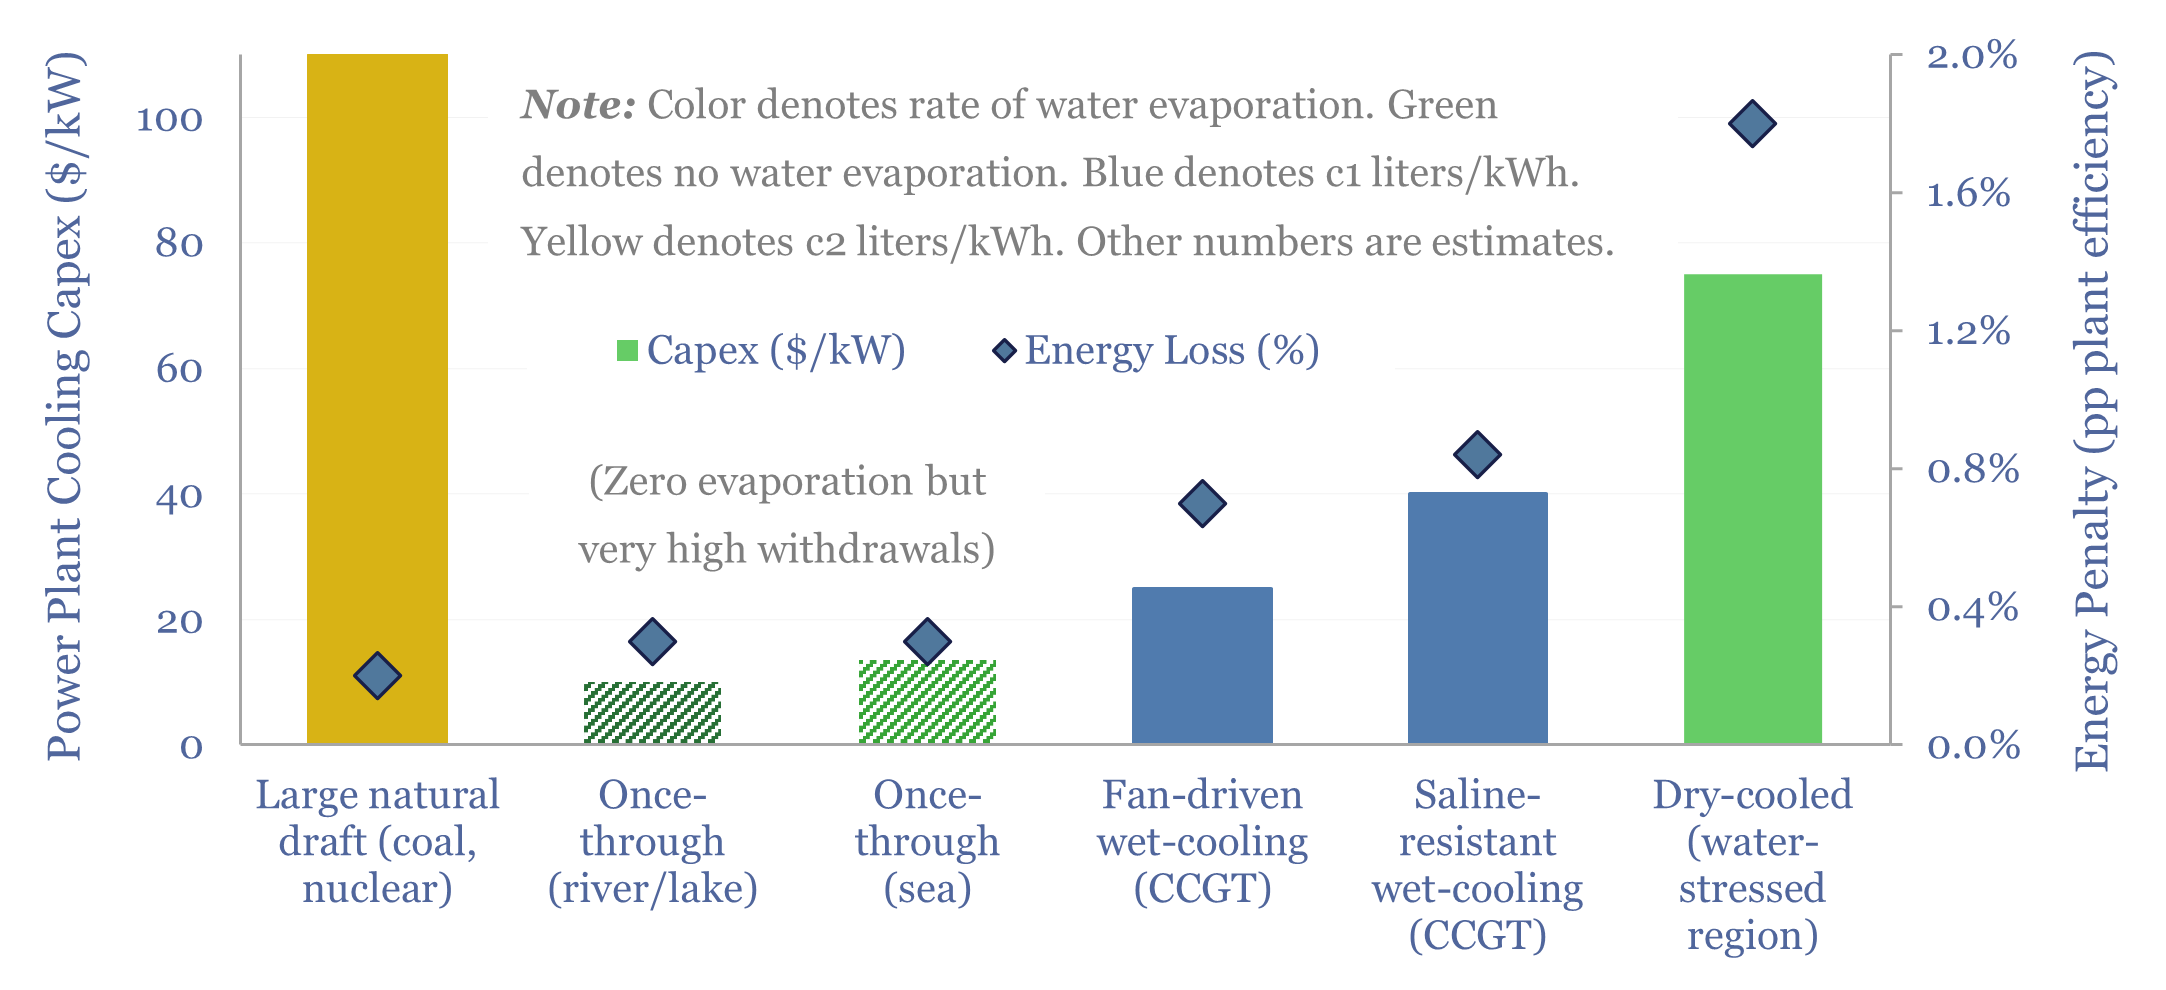
Power plant cooling: adapting for water scarcity?
Download
Doosan Enerbility: gas turbine technology?
Download
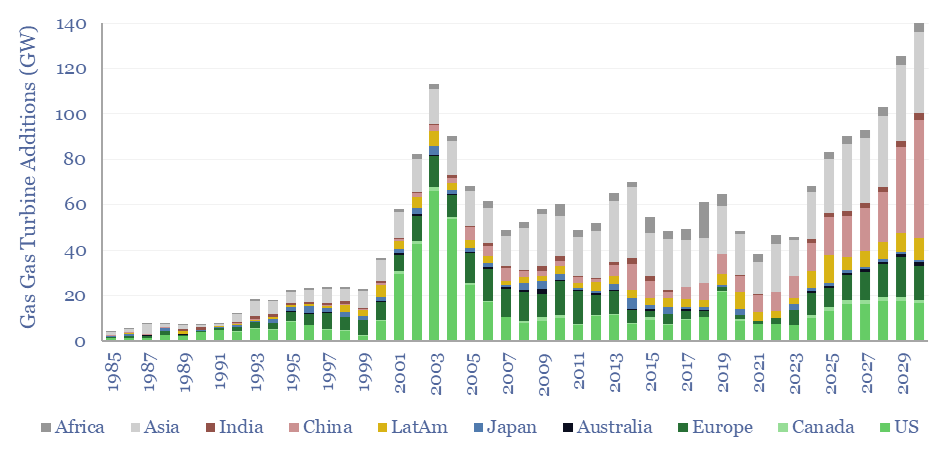
Gas turbines: what outlook in energy transition?
Download
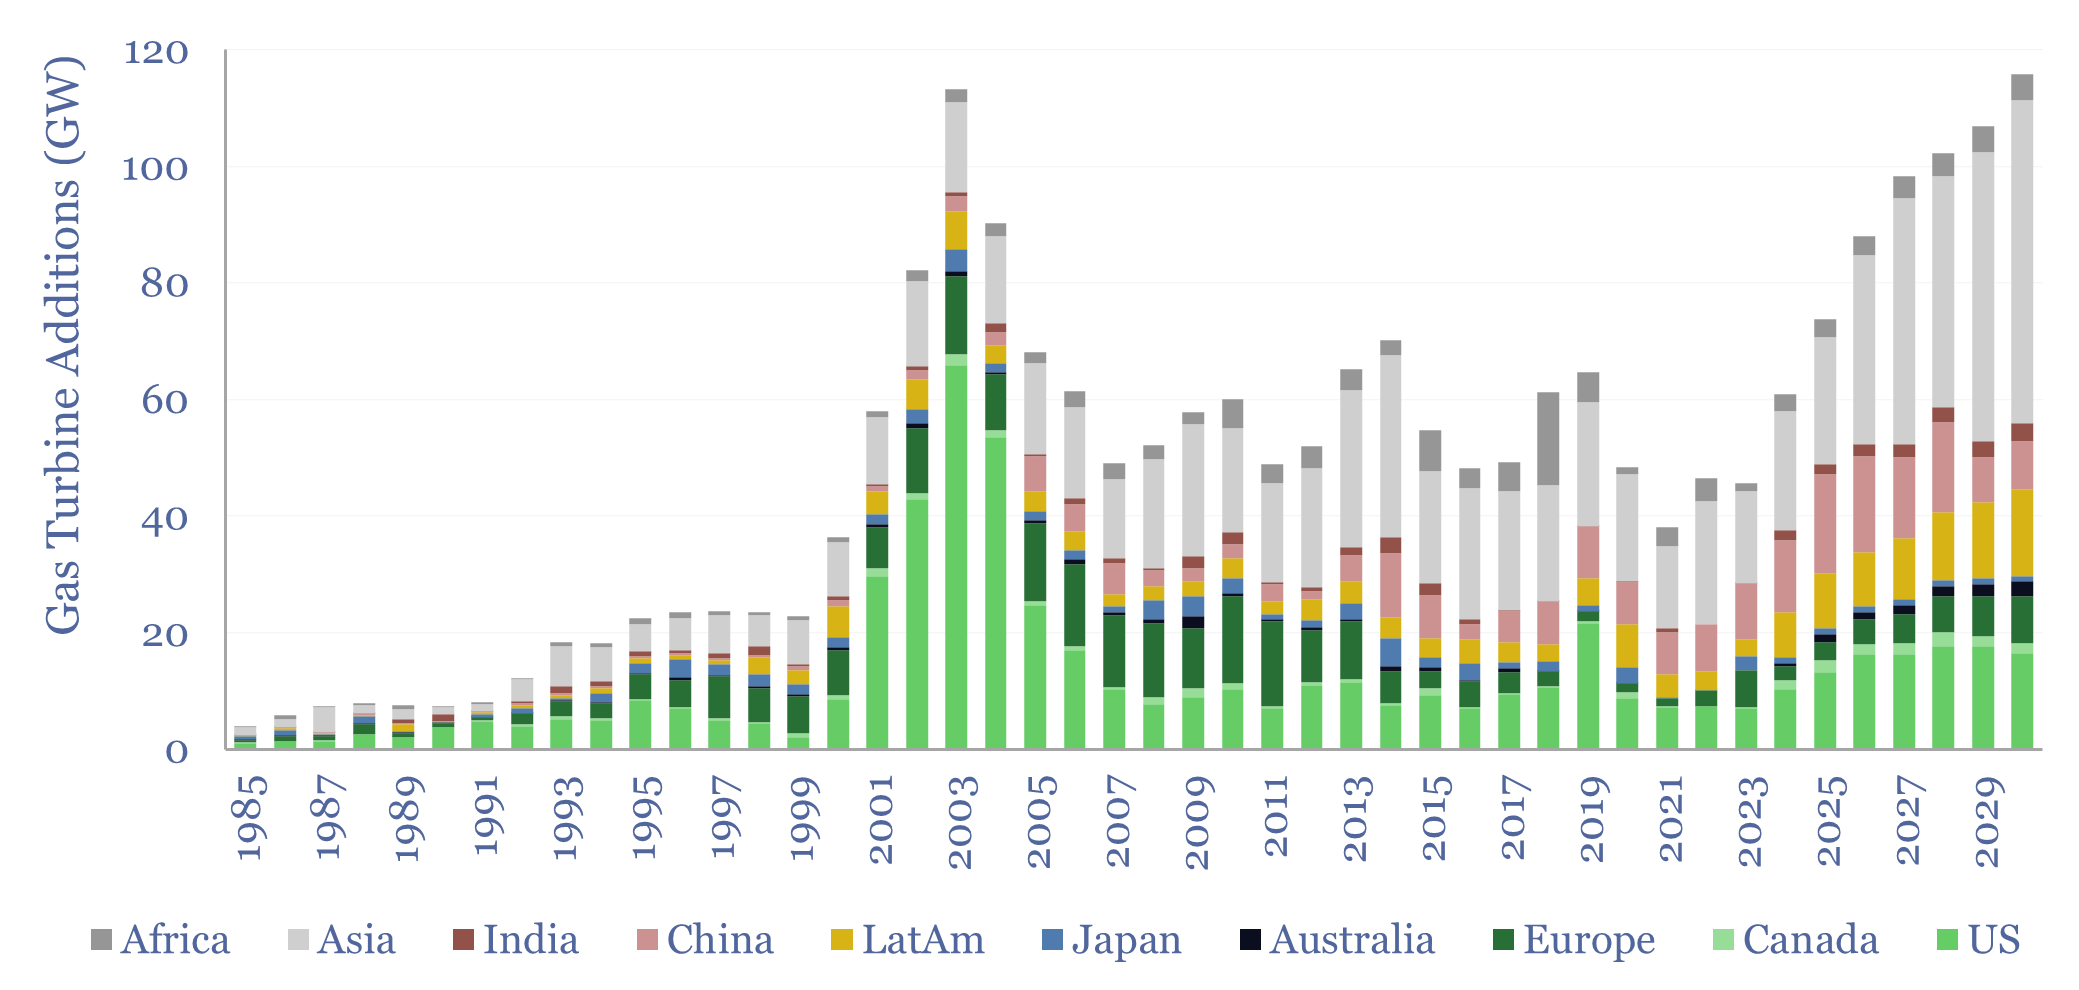
Global gas turbines by region and over time?
Download
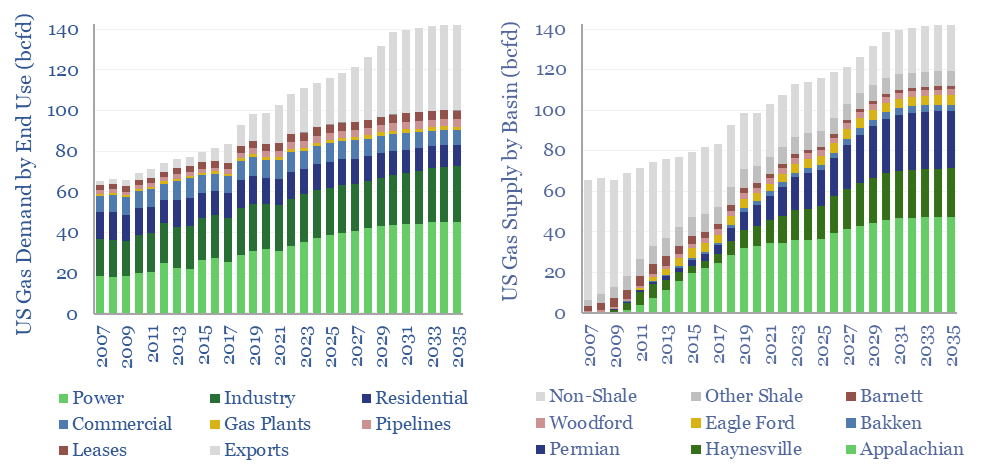
US natural gas: the stuff of dreams?
Download
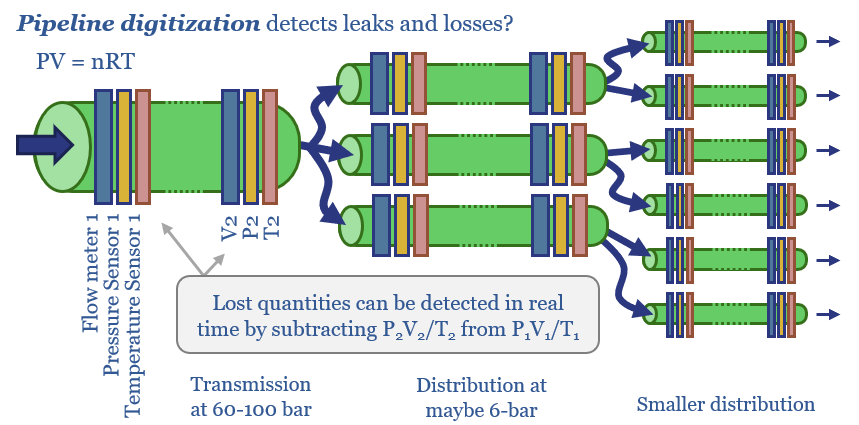
Seeing sense: digitize the downstream gas network?
Download
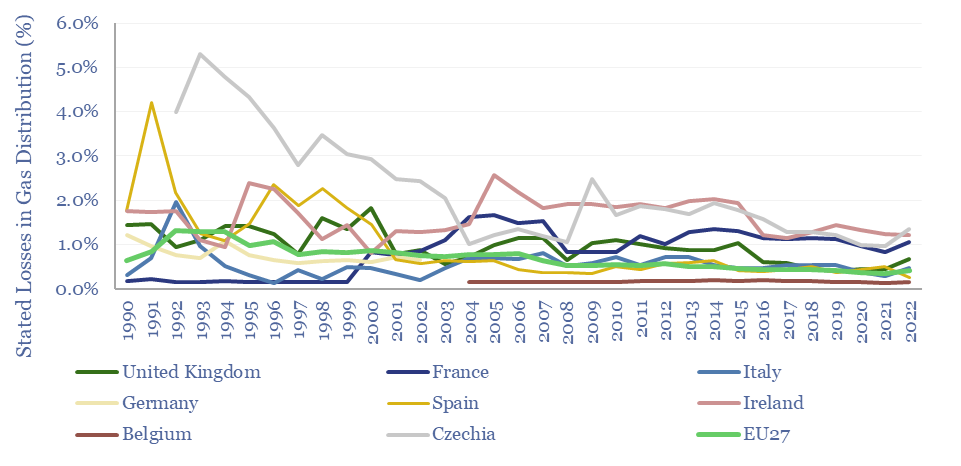
Gas distribution: loss rates, leakage, unaccounted gas?
Download
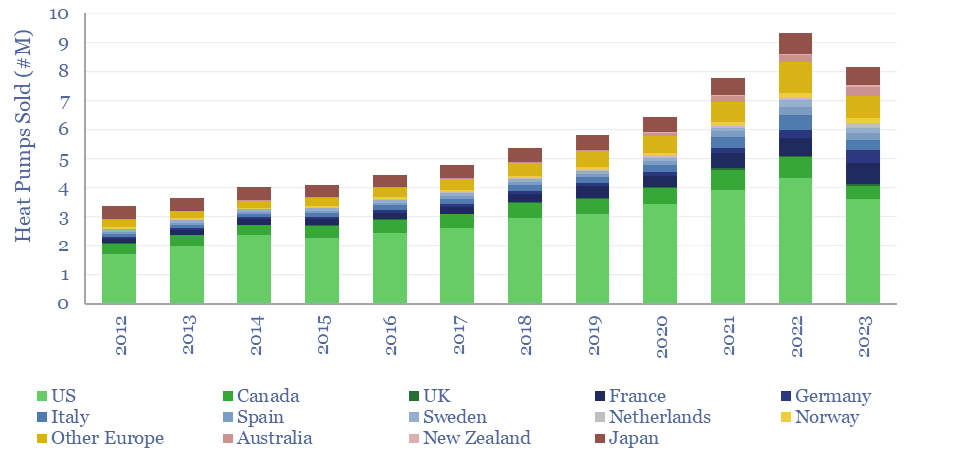
Global heat pump sales by country?
Download
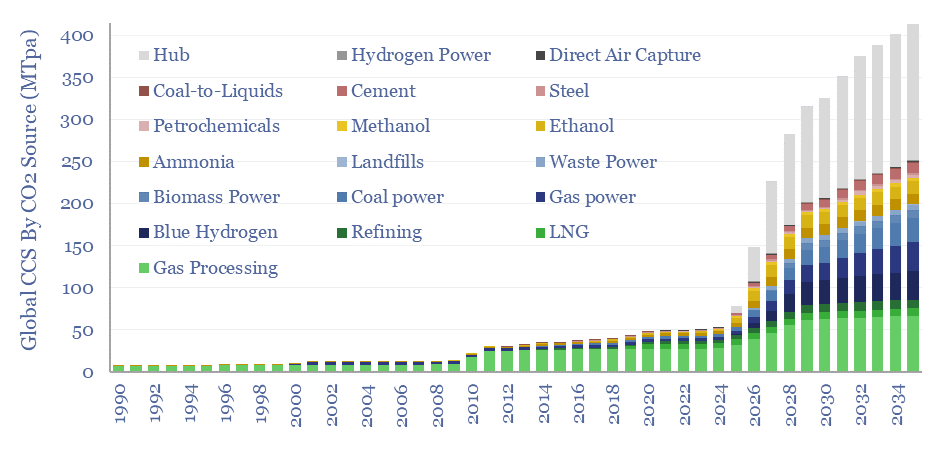
Global CCS Projects Database
Download
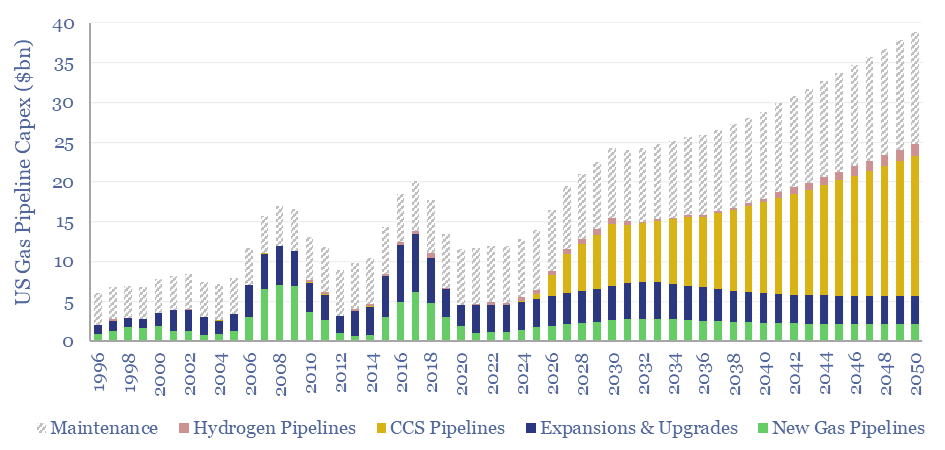
US gas pipeline capex over time?
Download
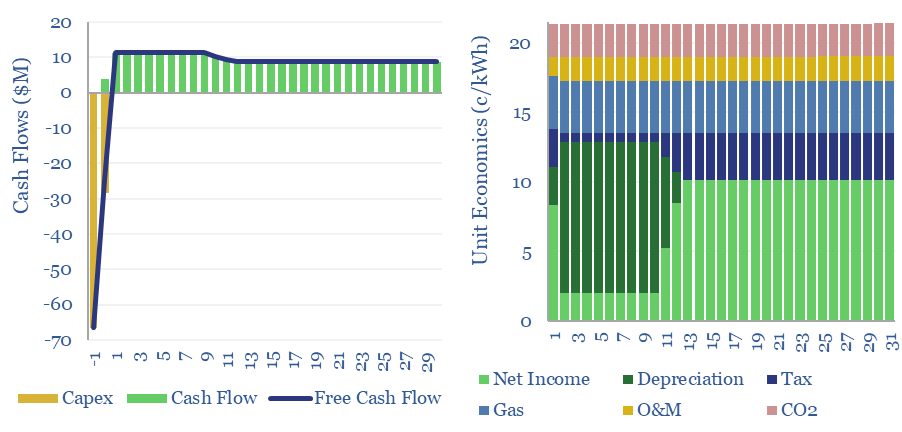
Gas peaker plants: the economics?
Download
Back up: does ramping renewables displace gas?
Download
Mainspring Energy: linear generator breakthrough?
Download
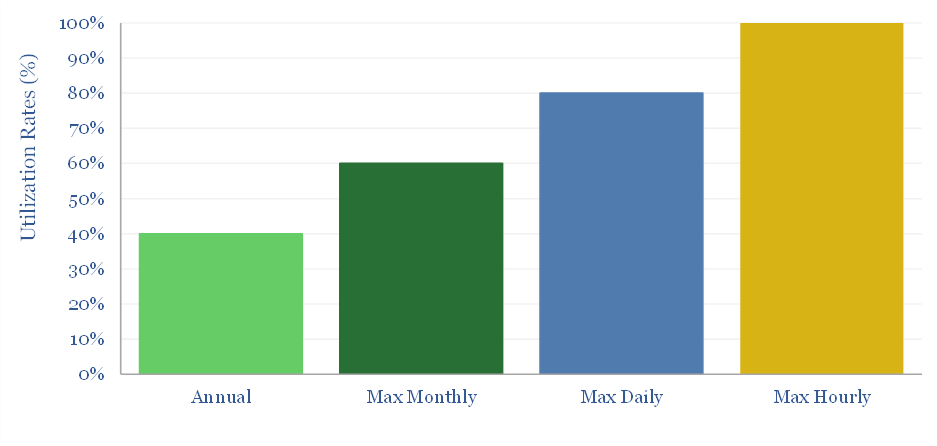
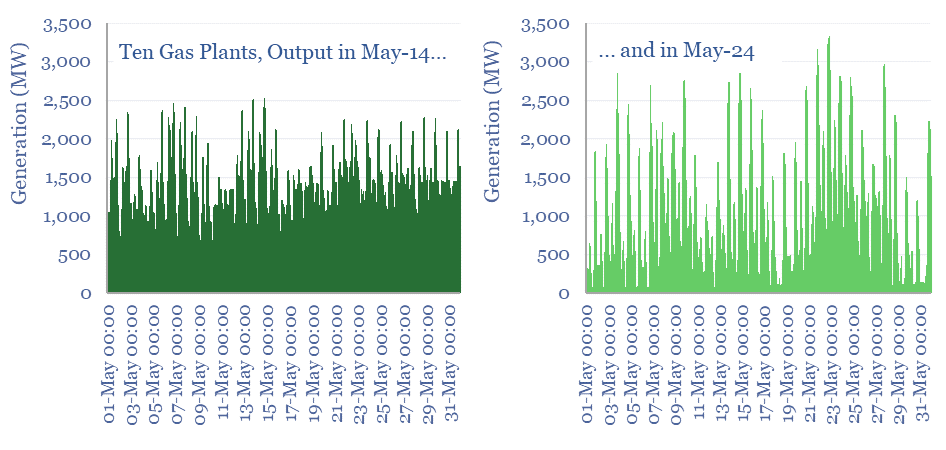
Gas power: does low utilization entail spare capacity?
Download
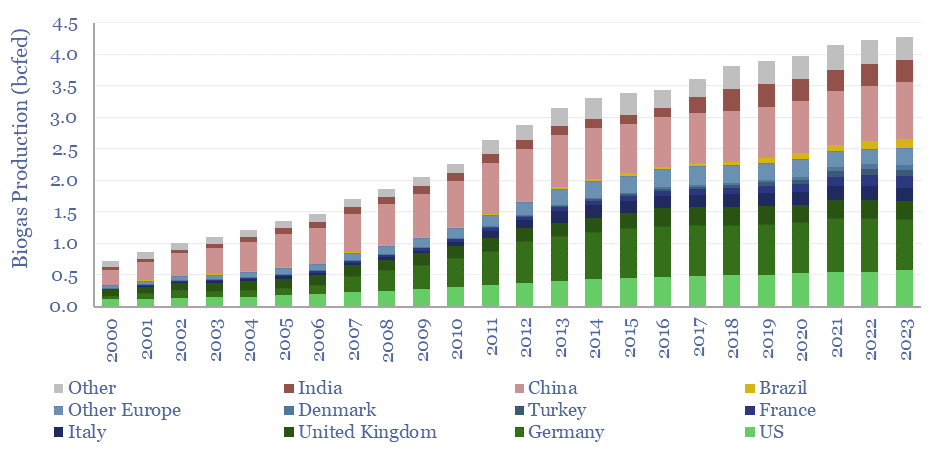
Global biogas production by country?
Download
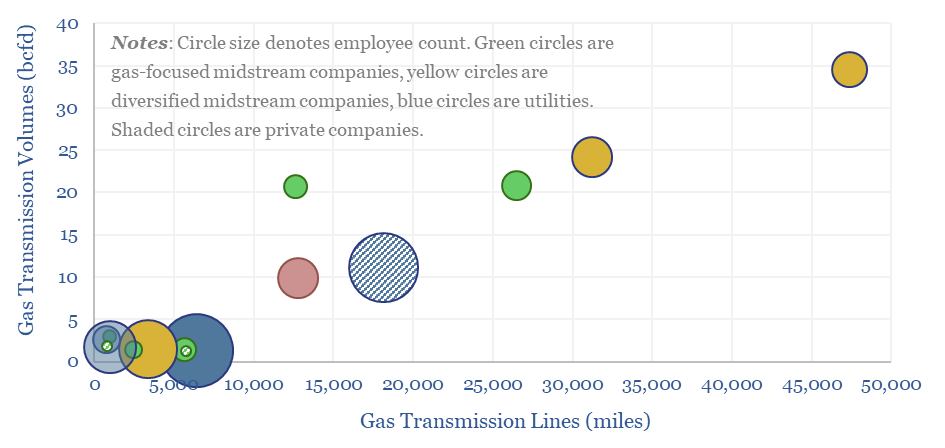
US gas transmission: by company and by pipeline?
Download
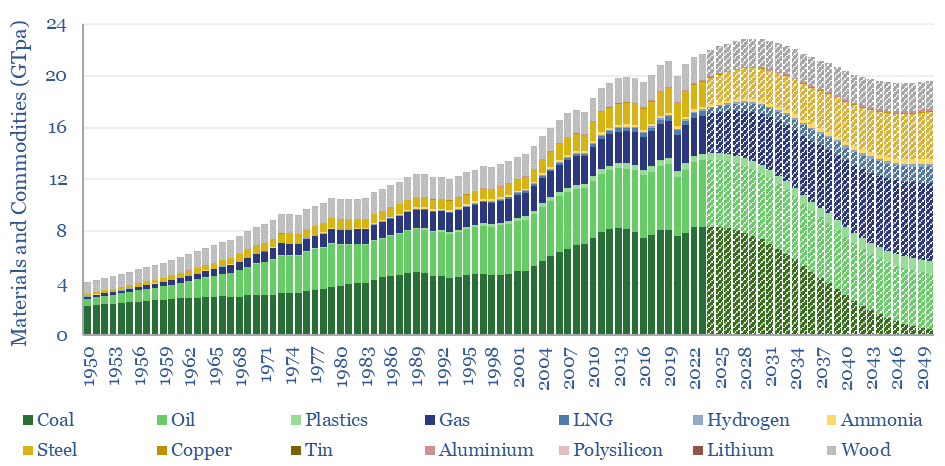
Peak commodities: everything, everywhere, all at once?
Download
Renewable-heavy grids: dividing the pie?
Download
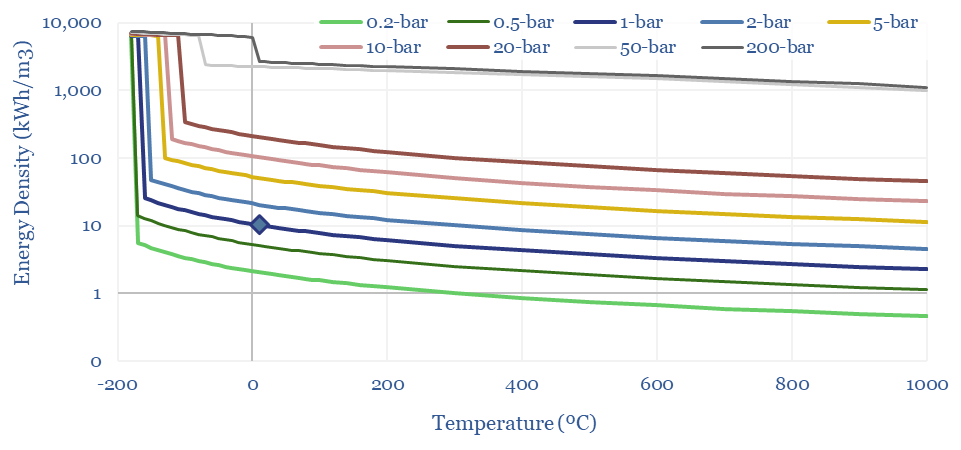
Density of gases: by pressure and temperature?
Download
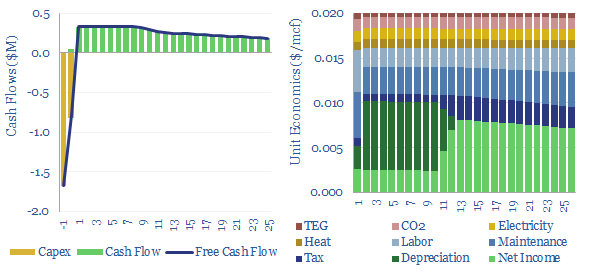
Gas dehydration: costs and economics?
Download
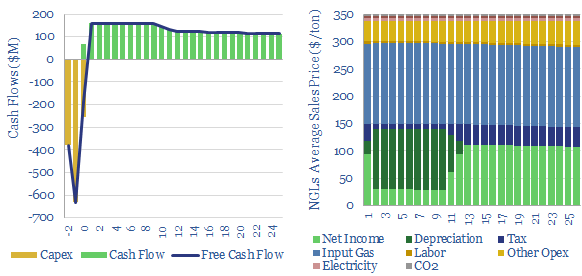
Gas fractionation: NGL economics?
Download
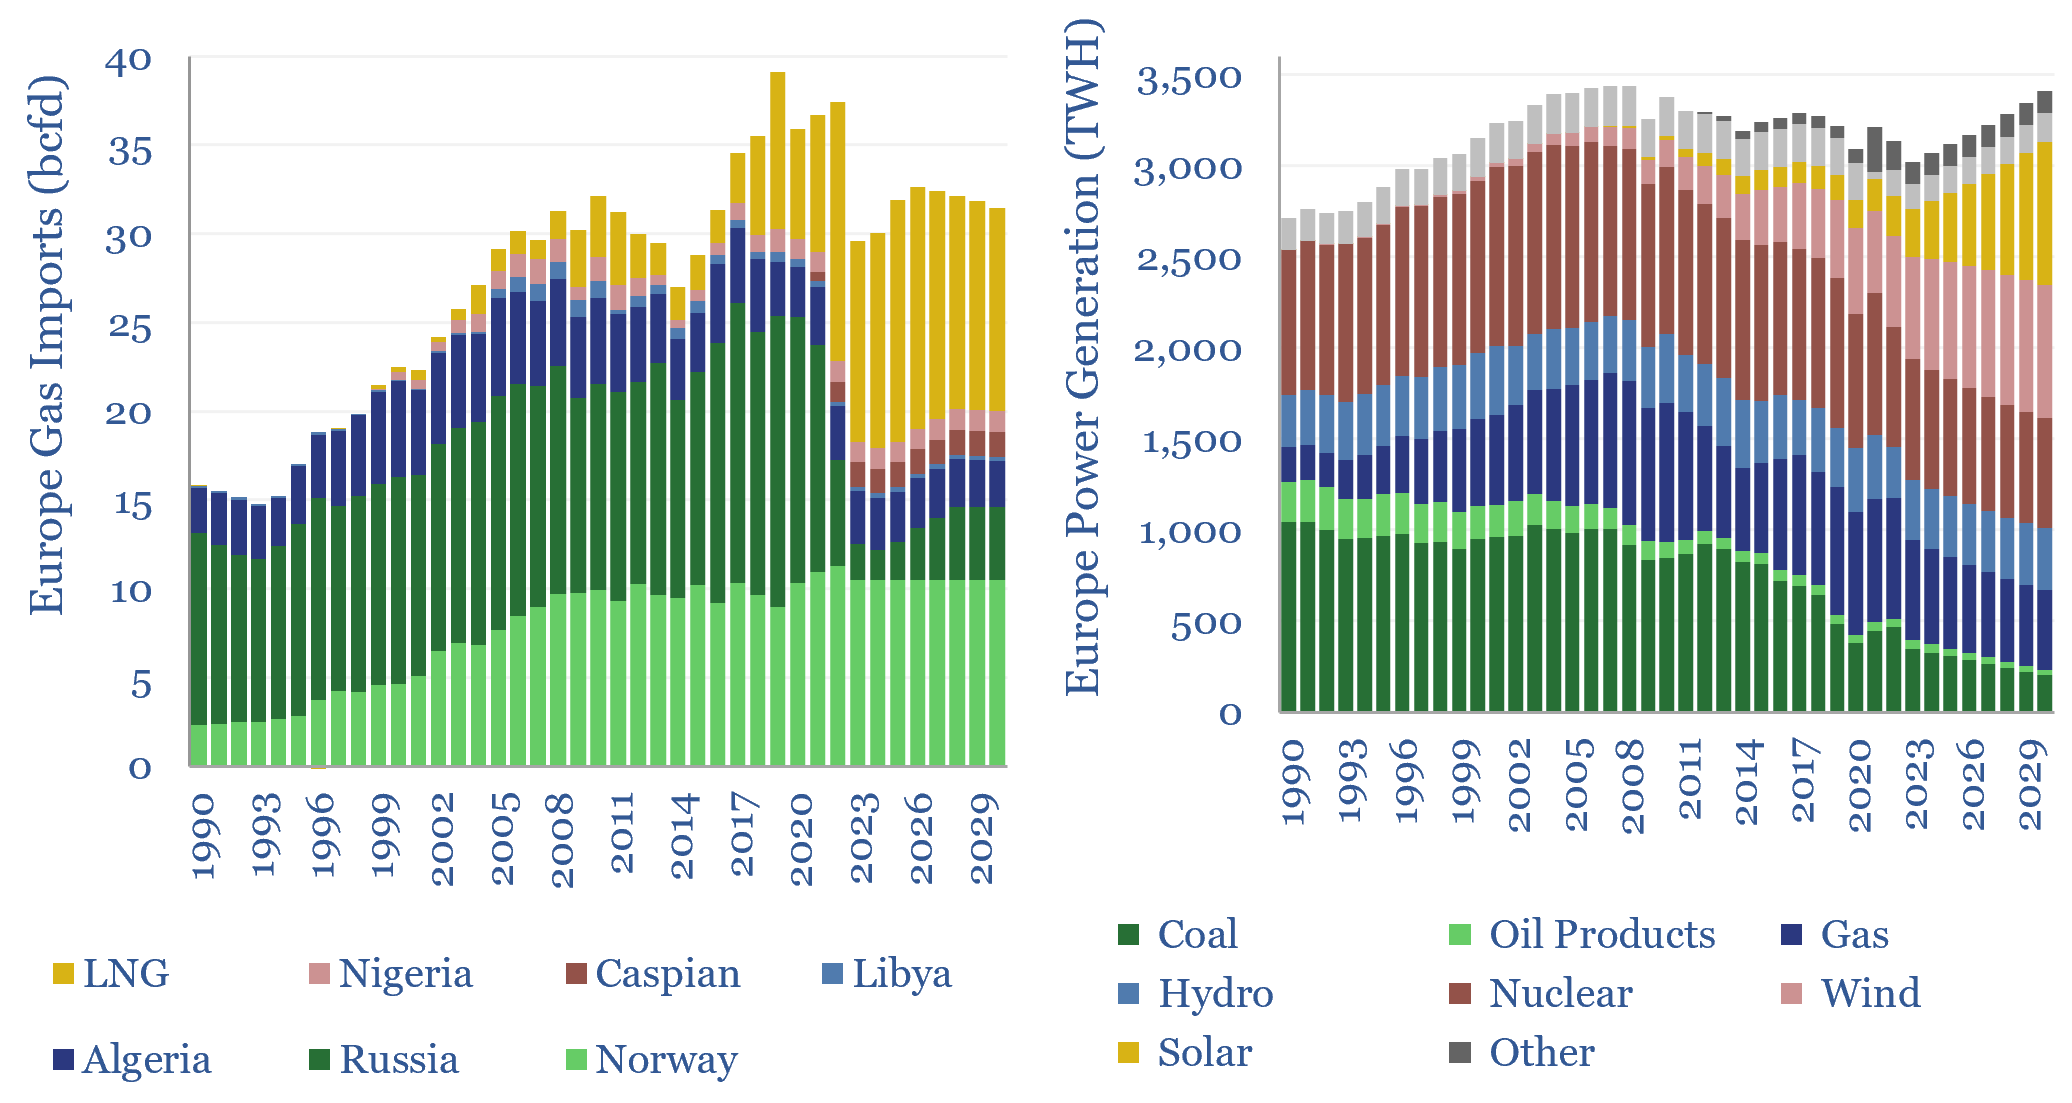
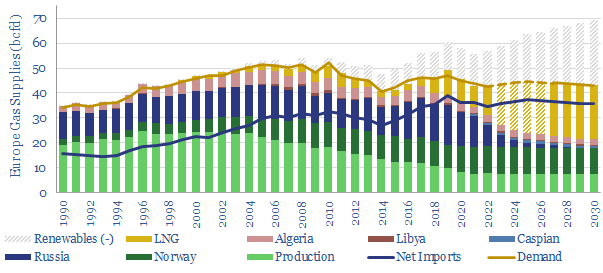
European gas and power model: natural gas supply-demand?
Download
Biogas: the economics?
Download
Development capex: long-term spending from Oil Majors?
Download
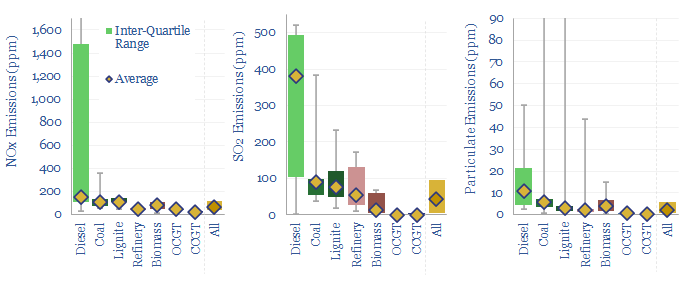
Air quality: sulphur, NOx and particulate emissions?
Download
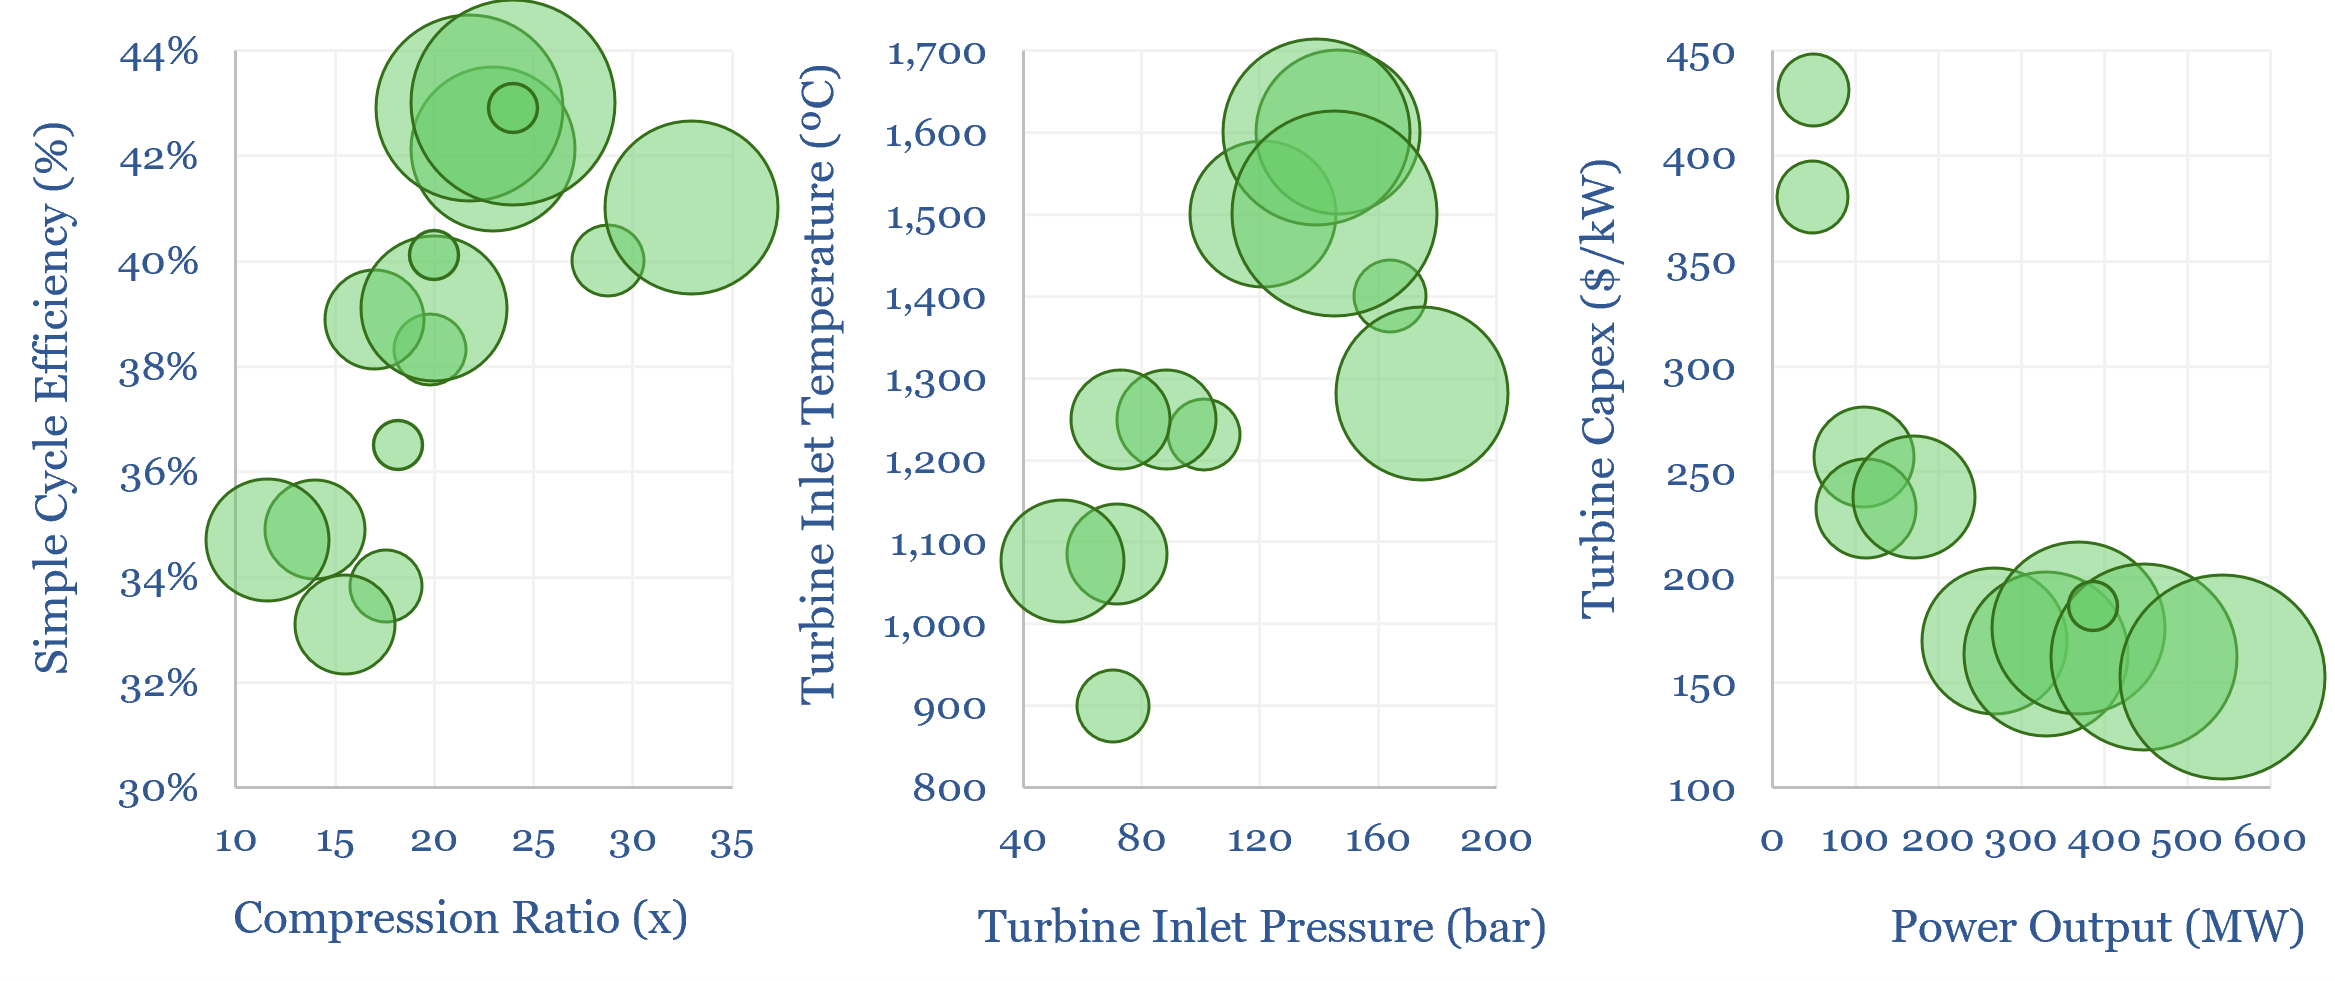
Gas turbines: operating parameters?
Download
NET Power: gas-fired power with inherent CO2 capture?
Download
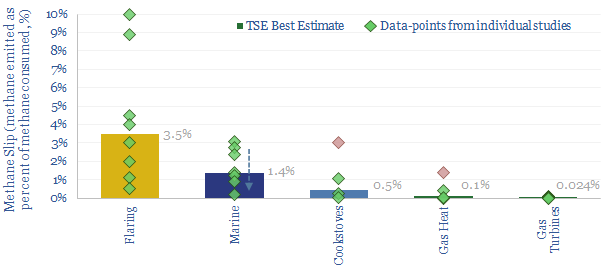
Methane slip: how much gas evades combustion?
Download
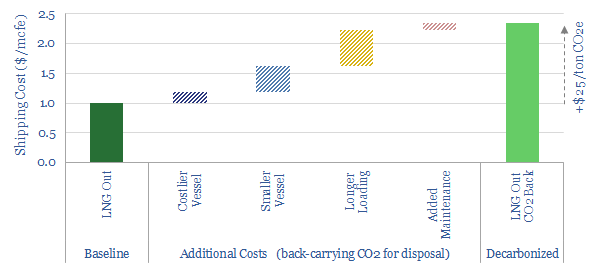
Decarbonized gas: ship LNG out, take CO2 back?
Download
Exploration capex: long-term spending from Oil Majors?
Download
CH4 context: the largest methane leaks of all time?
Download
Global gas: five predictions through 2030?
Download
Scope 4 emissions: avoided CO2 has value?
Download
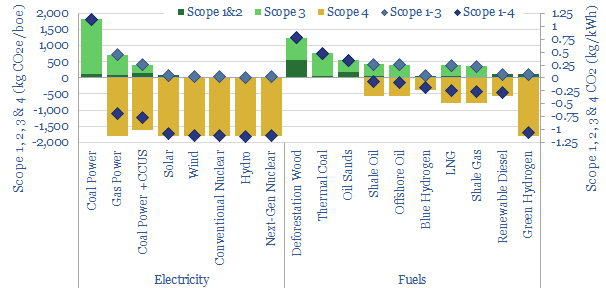
CO2 intensity: Scope 1, 2 & 3 and Scope 4 emissions?
Download
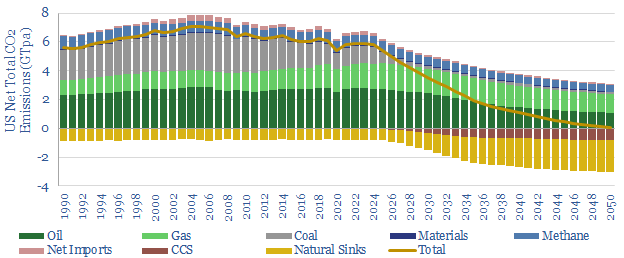
US decarbonization: energy and CO2 emissions?
Download
Gas diffusion: how will record prices resolve?
Download
LNG Research
LNG: top conclusions in the energy transition?
Download
Global gas supply-demand in energy transition?
Download
LNG plant compressors: chilling goes electric?
Download
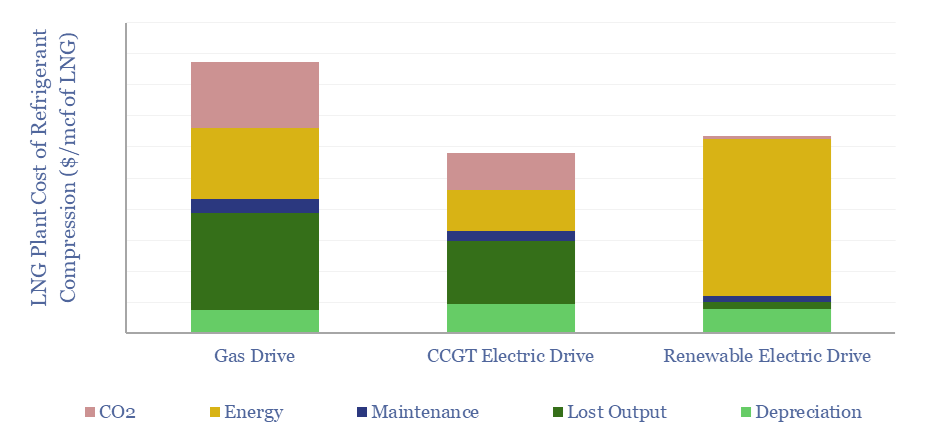
LNG plant compression: gas drives vs electric motors?
Download
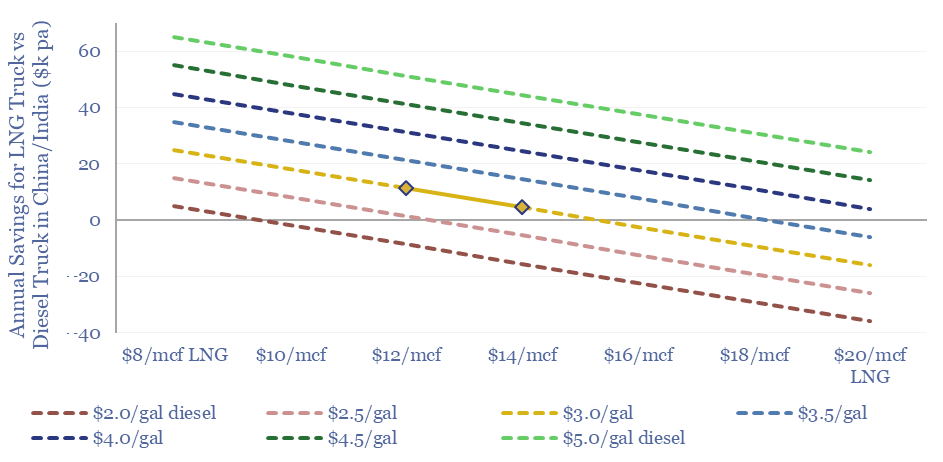
LNG trucks: Asian equation?
Download
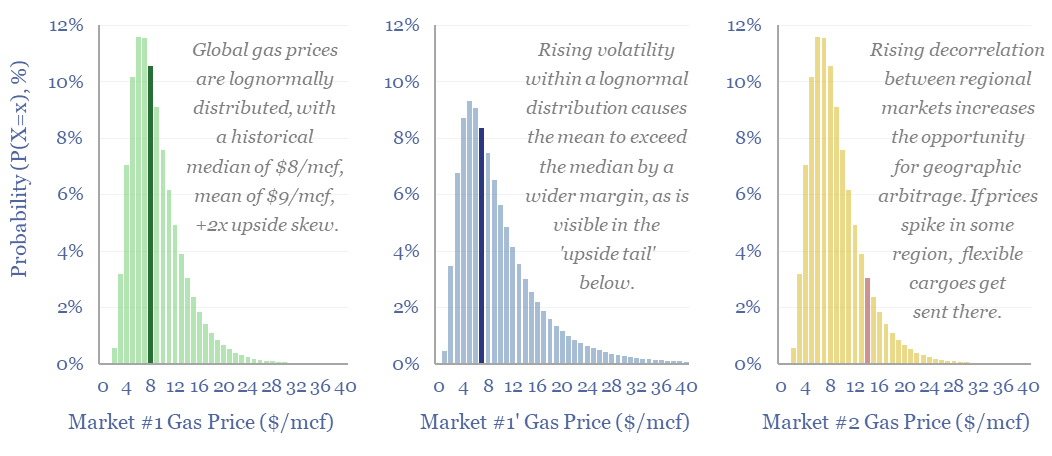
Energy trading: value in volatility?
Download
European gas and power model: natural gas supply-demand?
Download
Liquefied CO2 carriers: CO2 shipping costs?
Download
Decarbonized gas: ship LNG out, take CO2 back?
Download
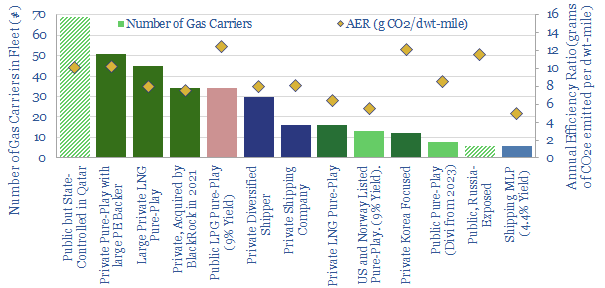
LNG shipping: company screen?
Download
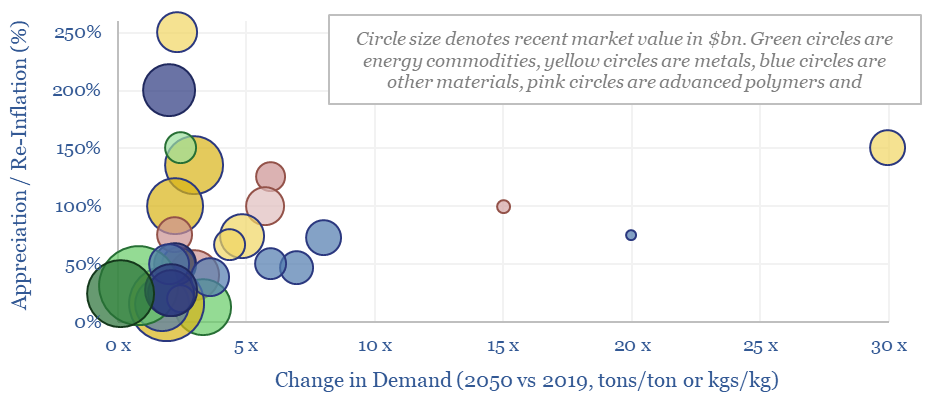
Energy transition: top commodities?
Download
Global gas: five predictions through 2030?
Download
Gas diffusion: how will record prices resolve?
Download
North Field: sharing the weight of the world?
Download
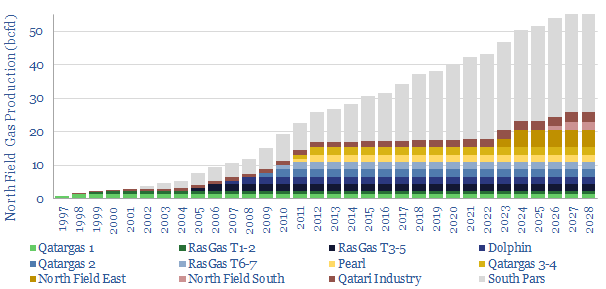
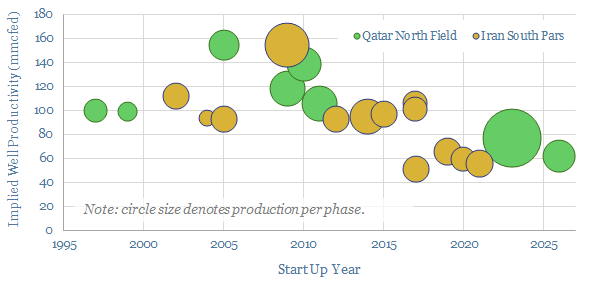
Qatar’s North Field: production and productivity?
Download
Energy security: the return of long-term contracts?
Download
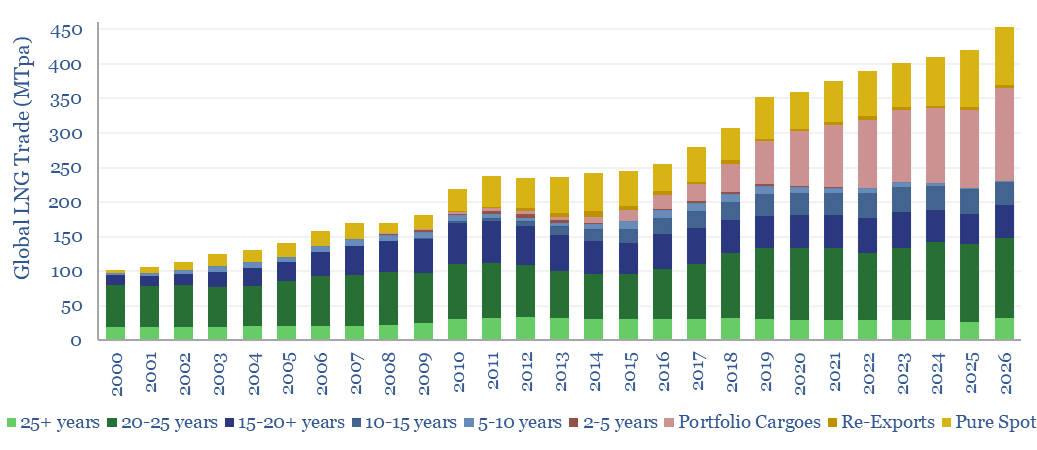
Global LNG: offtake contracts and spot market development?
Download
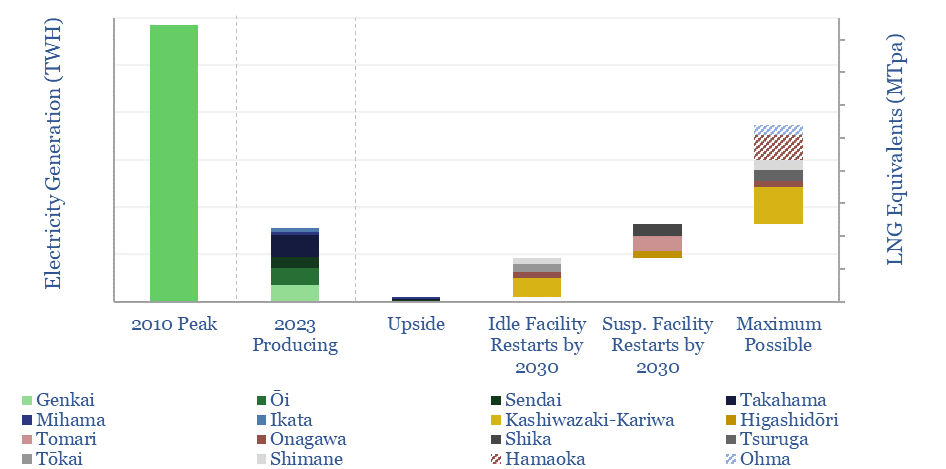
Japan: nuclear restart tracker?
Download
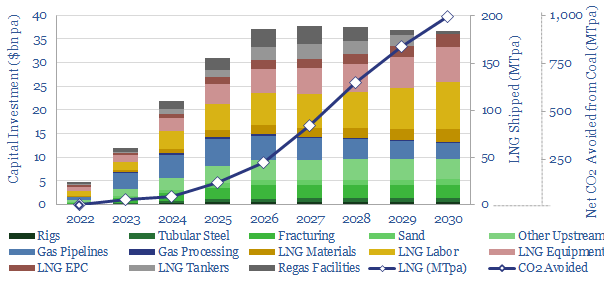
US LNG: new perceptions?
Download
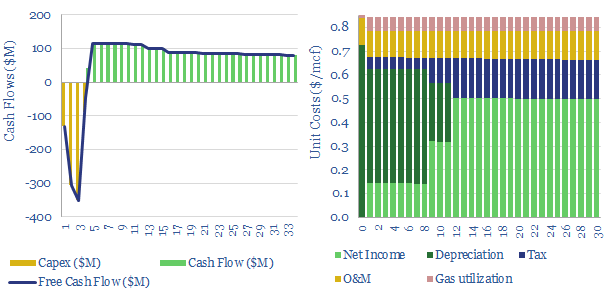
LNG regasification: the economics?
Download

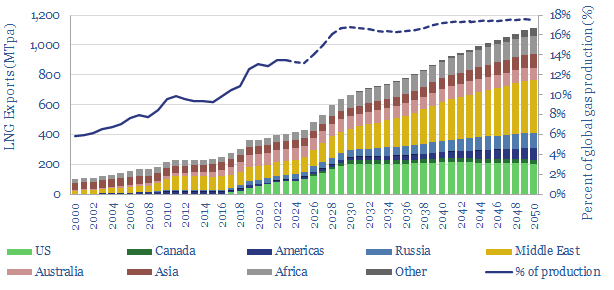
Global LNG supply model: by project and by country?
Download
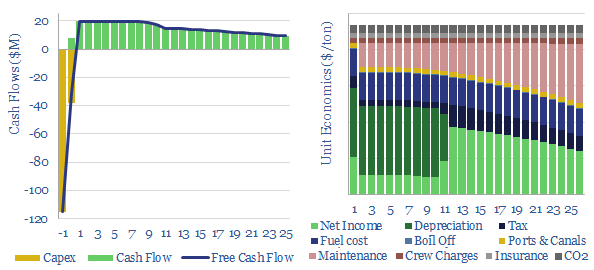
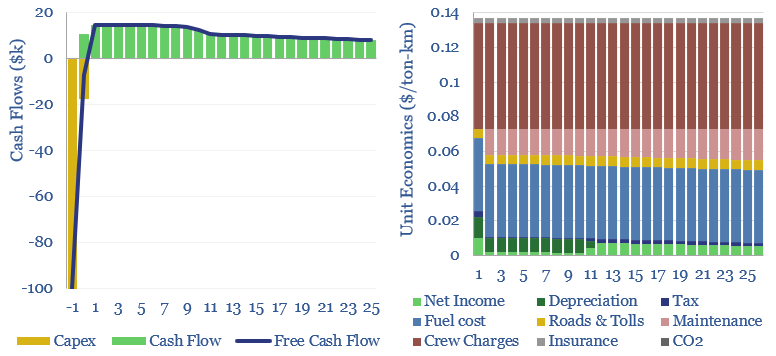
LNG transport: shipping economics?
Download
LNG in the energy transition: rewriting history?
Download
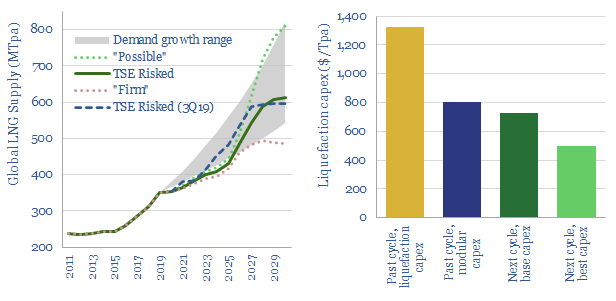
LNG liquefaction: what challenges and opportunities?
Download
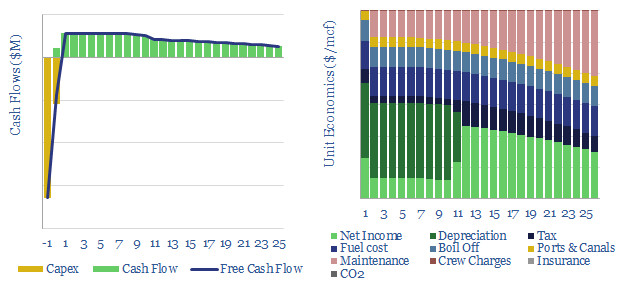
LNG liquefaction: the economics?
Download
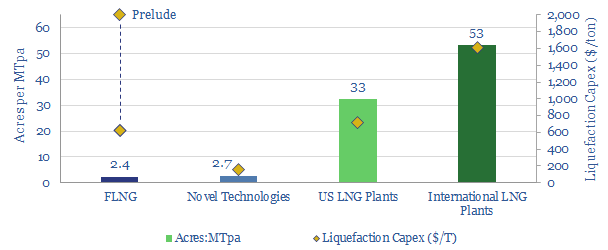
LNG plant footprints: compaction costs?
Download
Heavy truck costs: diesel, gas, electric or hydrogen?
Download
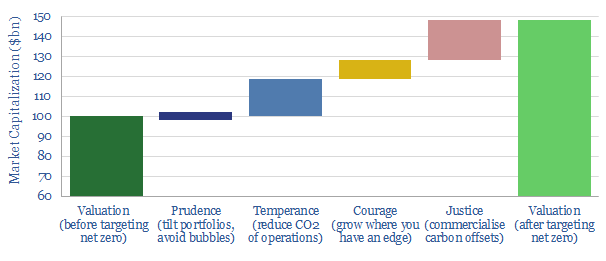
Net zero Oil Majors: four cardinal virtues?
Download
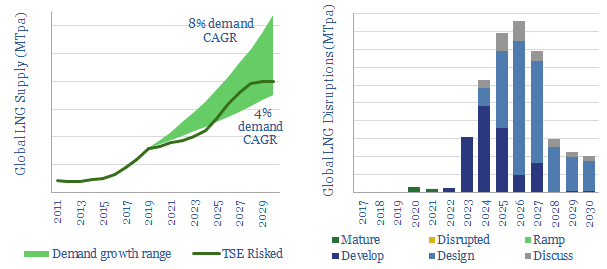
LNG: deep disruptions?
Download
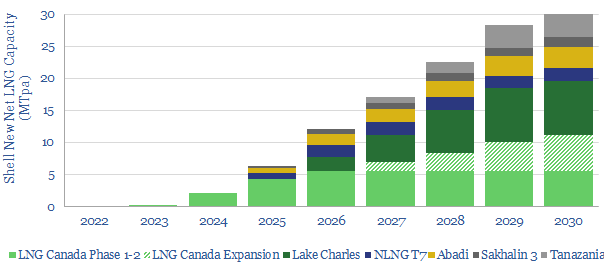
Shell: the future of LNG plants?
Download
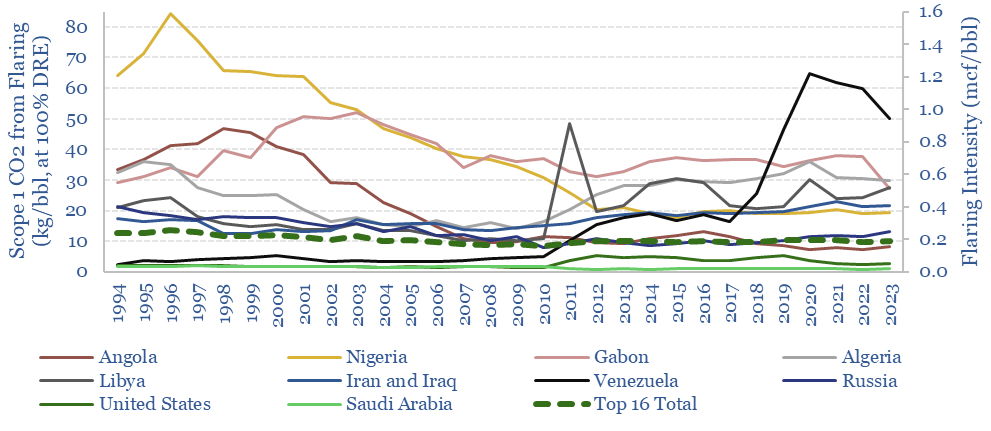
Global Flaring Intensity by Country
Download
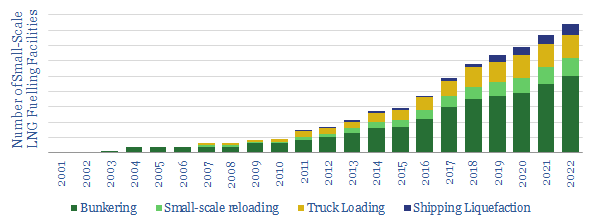
The Ascent of Small Scale LNG?
Download
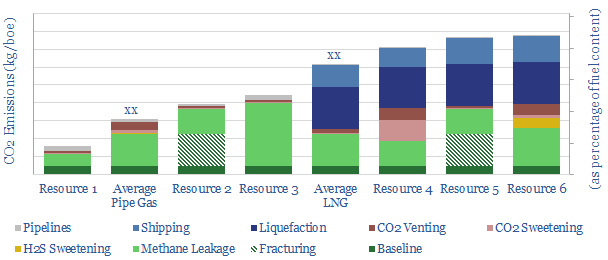
CO2 intensity of natural gas value chains?
Download
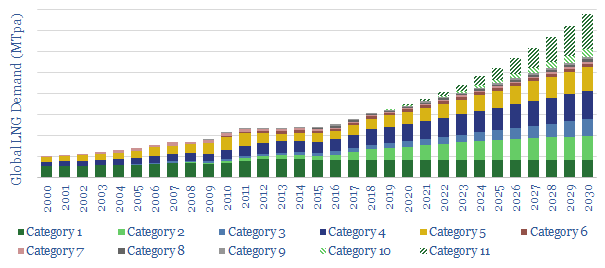
Long-Term LNG Demand: technology-led?
Download
US Shale Gas to Liquids?
Download
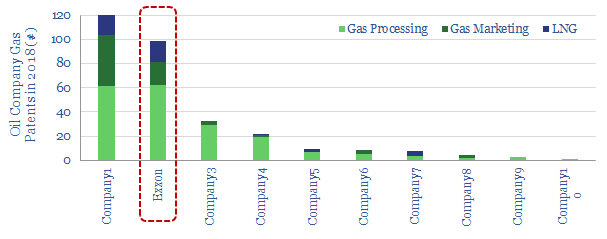
Greenfield LNG: Does Exxon have an edge?
Download
China’s Shale Challenge?
Download
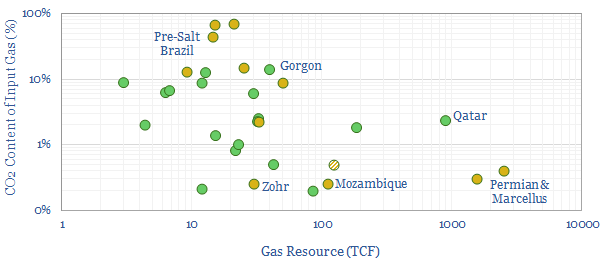
The World’s Great Gas Fields and Their CO2
Download
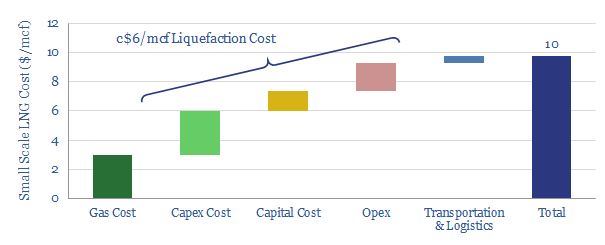
Small-Scale LNG liquefaction Costs: New Opportunities?
Download

LNG in transport: scaling up by scaling down?
Download
Downstream Research
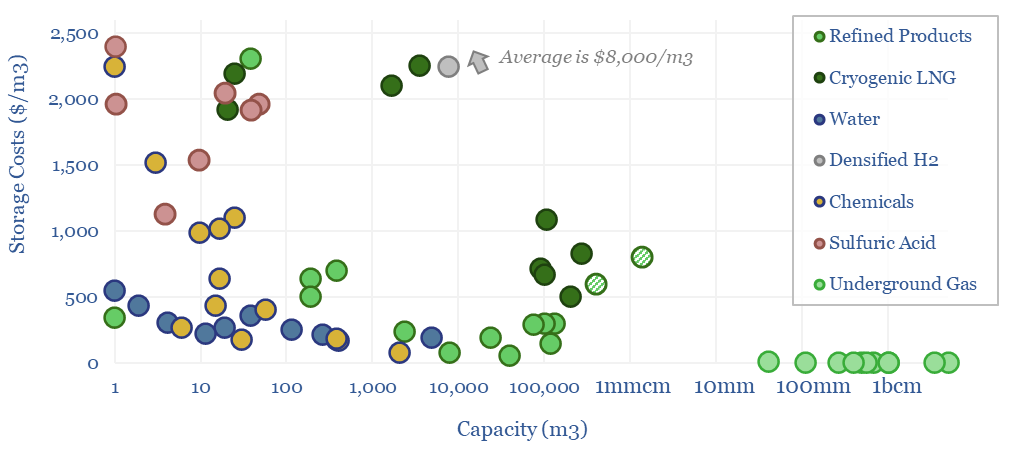
Storage tank costs: storing oil, energy, water and chemicals?
Download
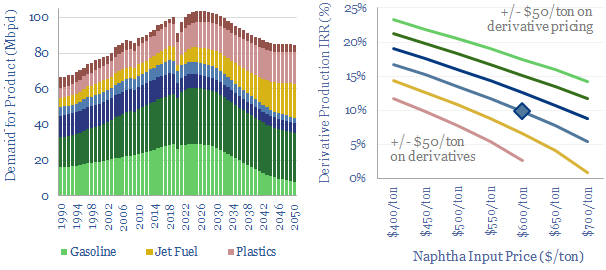
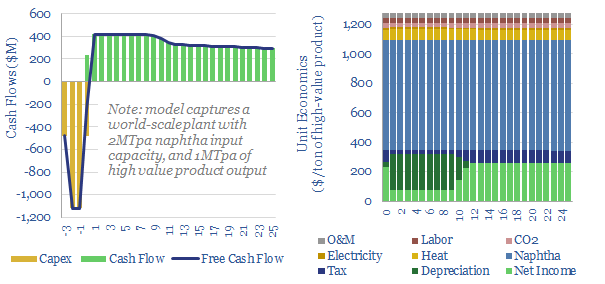
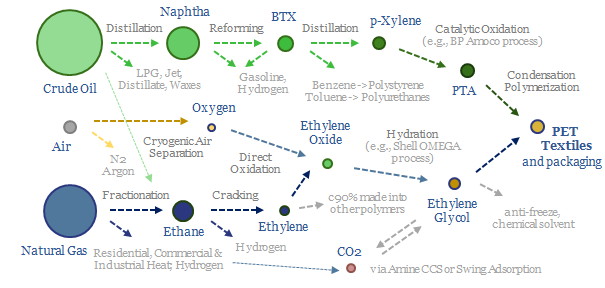
Crude to chemicals: there will be naphtha?
Download
Global oil demand forecasts: by end use, by product, by region?
Download
US Refinery Database: CO2 intensity by facility?
Download
Scope 4 emissions: avoided CO2 has value?
Download
Electric vehicles: chargers of the light brigade?
Download
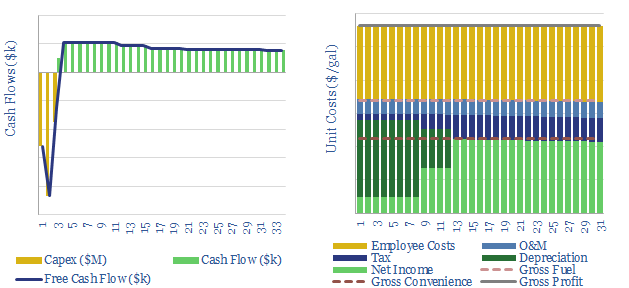
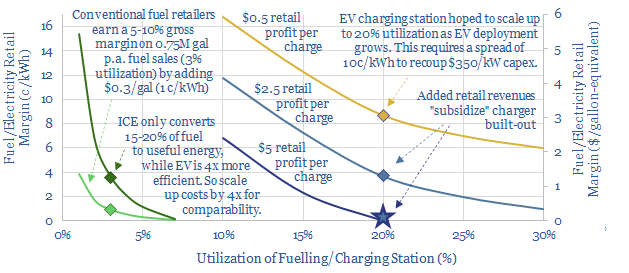
Fuel retail: economics of a petrol station?
Download
Hydroprocessing: the economics?
Download
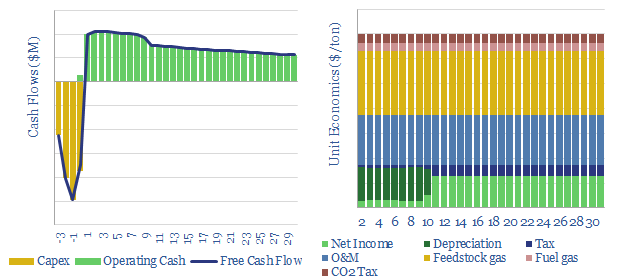
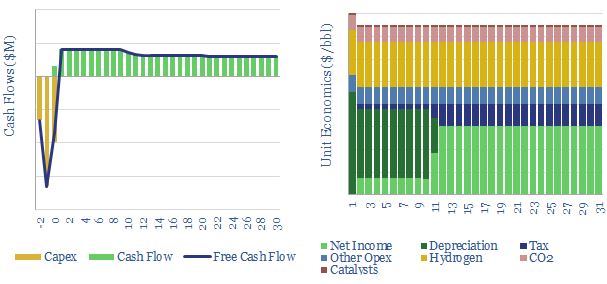
Methanol production: the economics?
Download
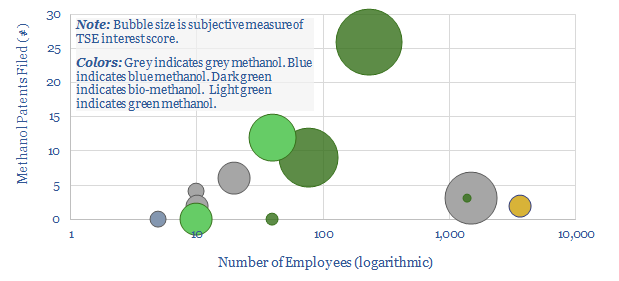
Methanol: leading companies?
Download
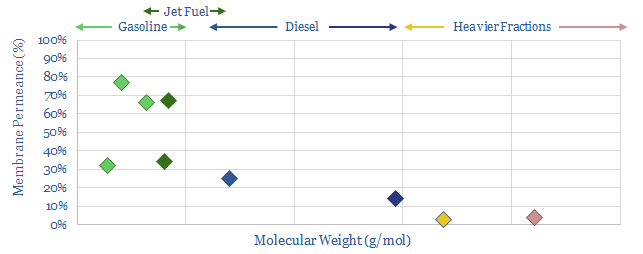
Low-carbon refining: insane in the membrane?
Download
Refinery membranes: where’s the IP?
Download
Pipeline costs: moving oil, products or other liquids?
Download
Waste heat recovery: heat exchanger costs?
Download
Renewable diesel: the economics?
Download
Can carbon-neutral fuels re-shape the oil industry?
Download
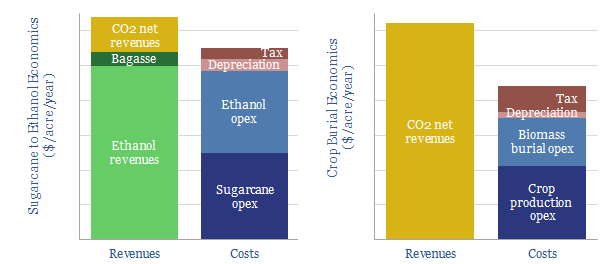
Biomass to biofuel, or biomass for burial?
Download
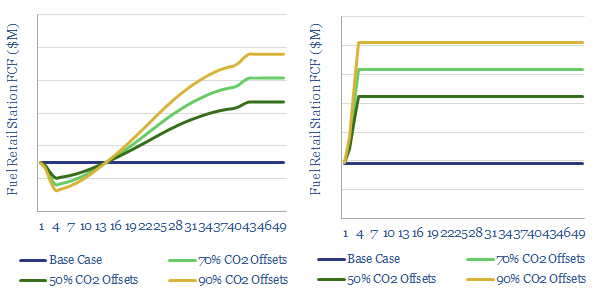
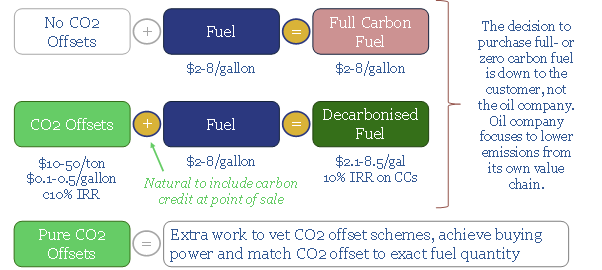
Should fuel retail stations sell carbon credits: the economics?
Download
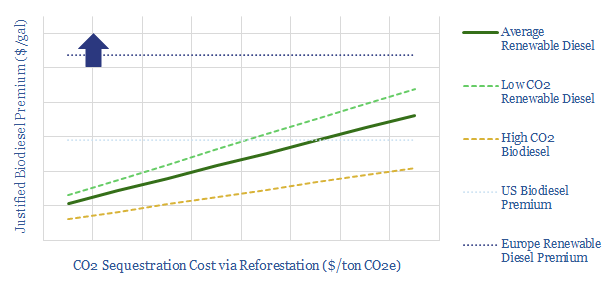
Carbon Offsets vs Renewable Diesel?
Download
Decarbonise Downstream?
Download
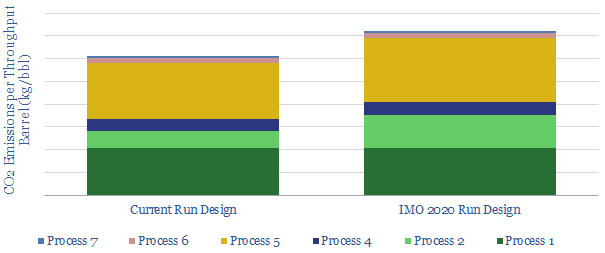
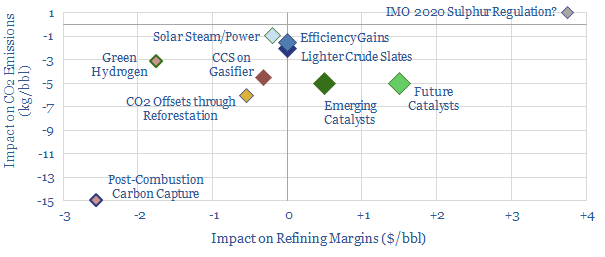
Carbon Costs of IMO 2020?
Download
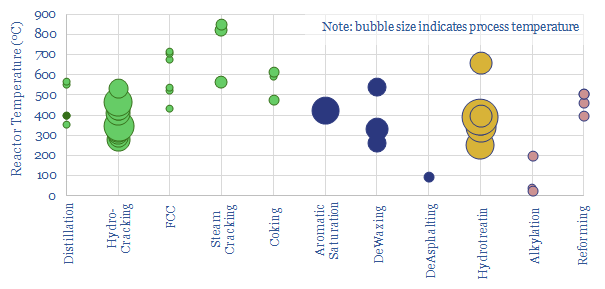
Upgrading Catalysts: lower refinery temperatures and pressures?
Download
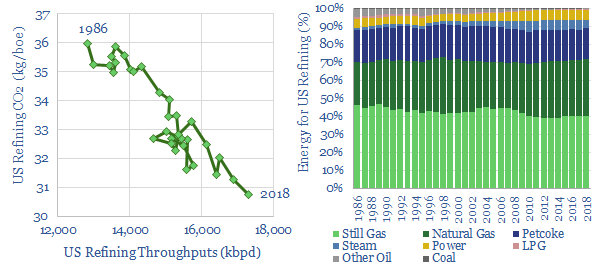
US Refining: energy and CO2 intensity
Download
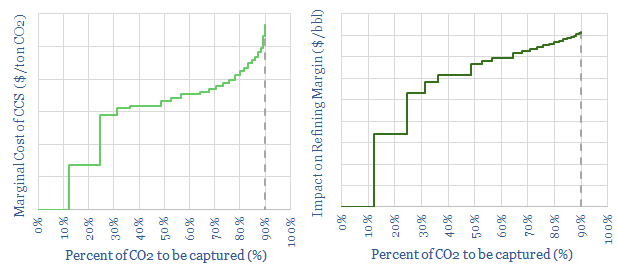
Carbon Capture Costs at Refineries?
Download
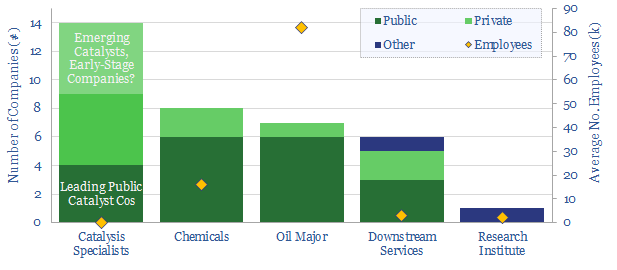
Overview of Downstream Catalyst Companies
Download
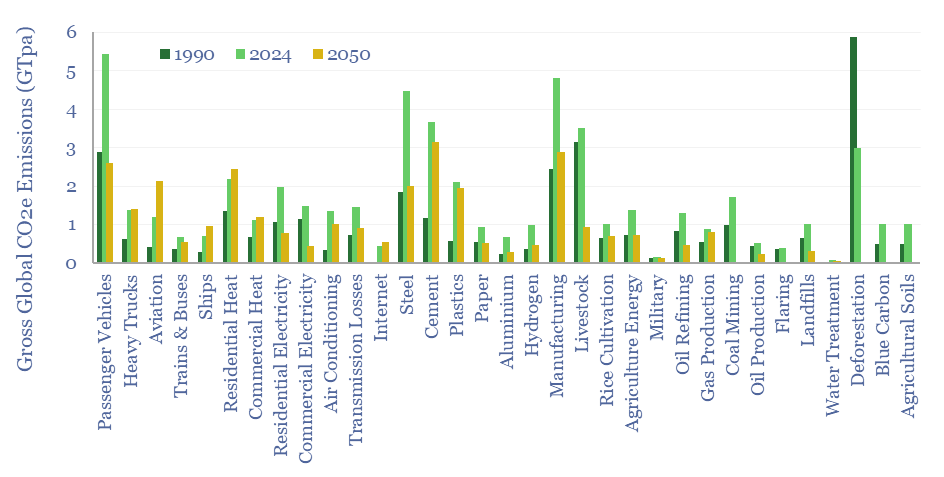
Global CO2 emissions breakdown?
Download
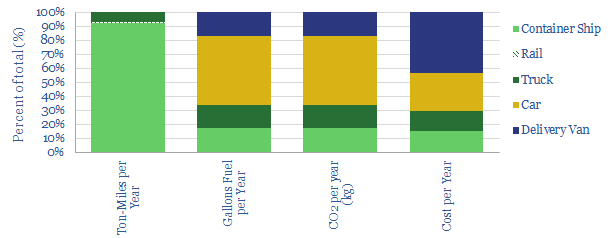
Distribution Costs: Ships, Trucks, Trains and Delivery Vans?
Download
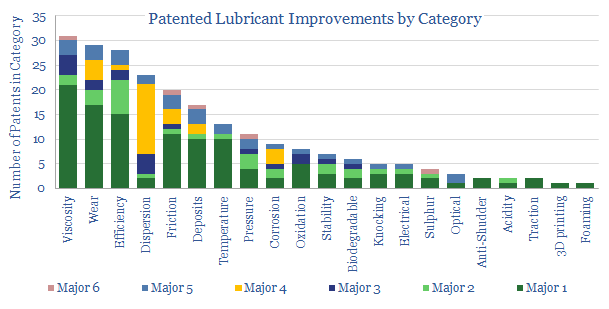
Lubricant Leaders: our top five conclusions
Download
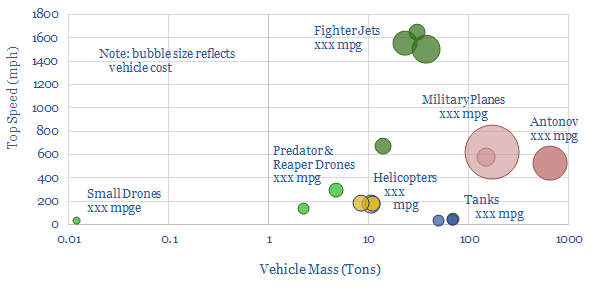
Drones attack military fuel economy?
Download
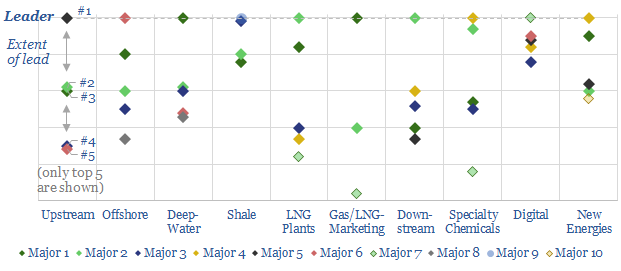
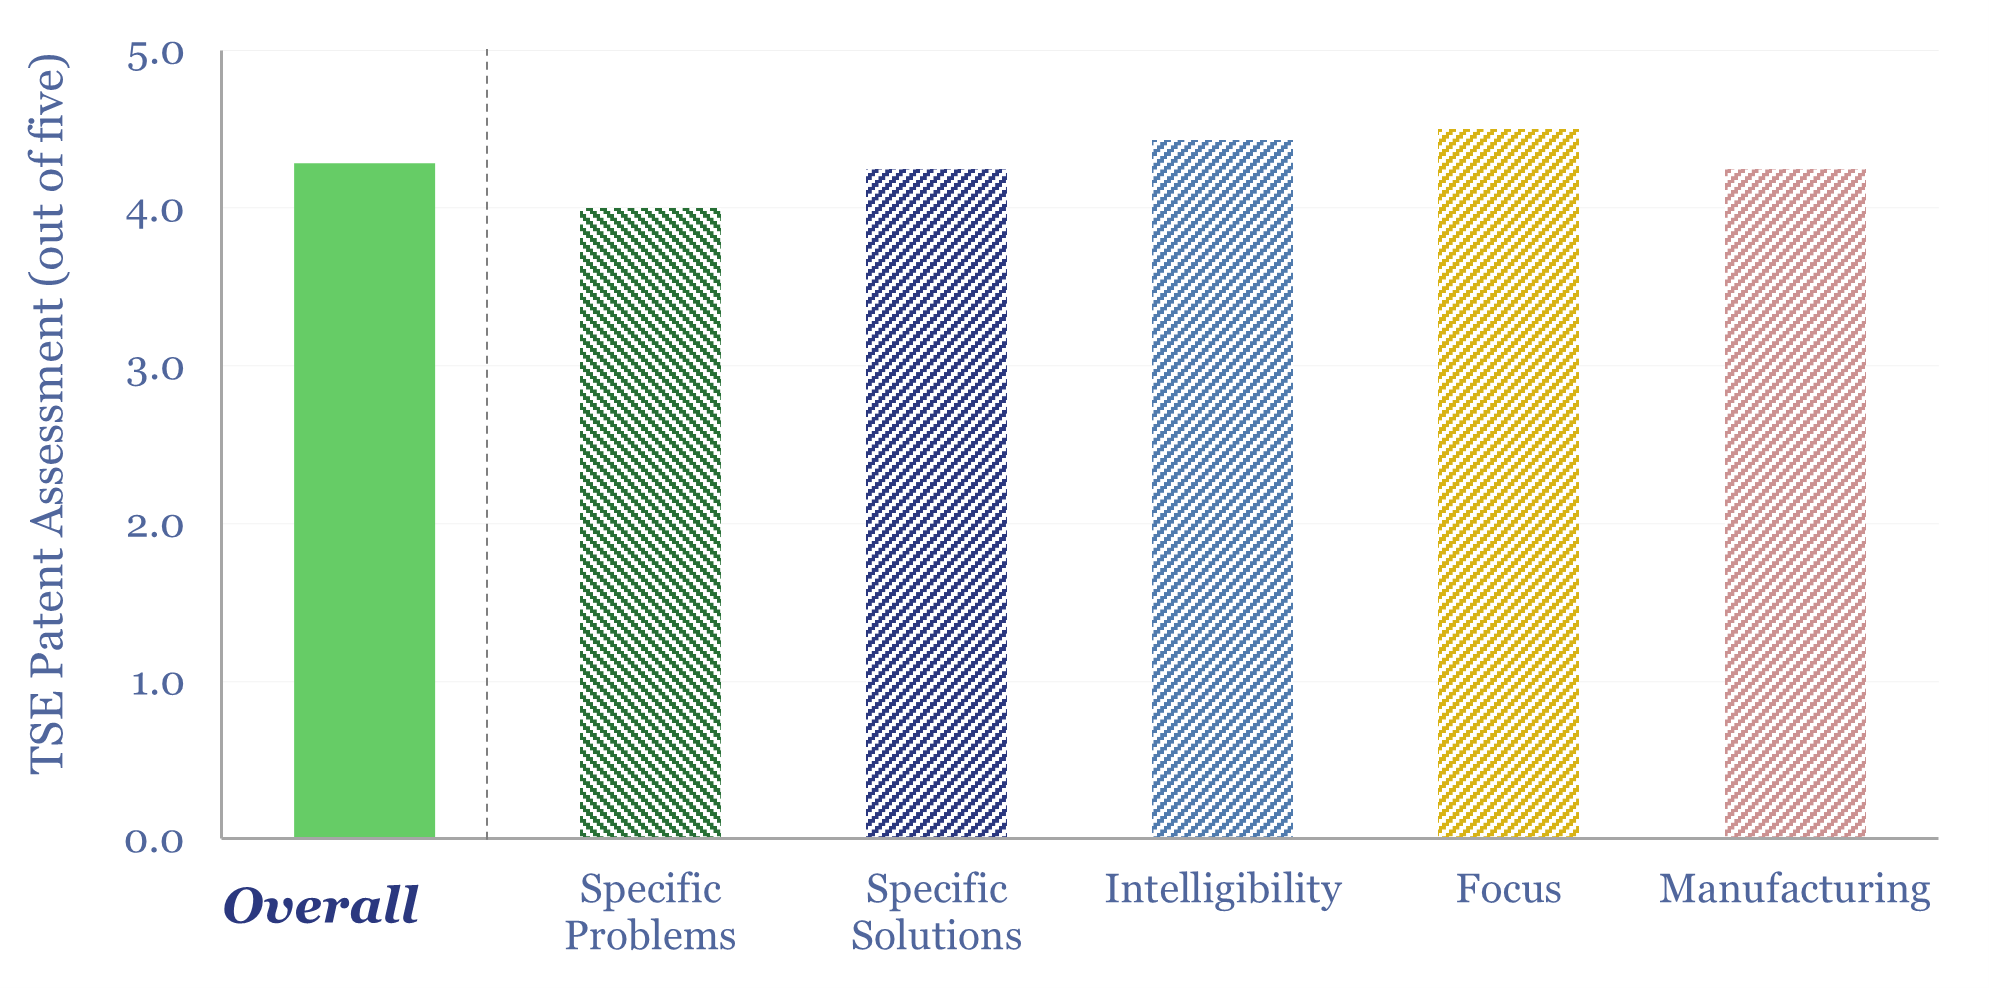
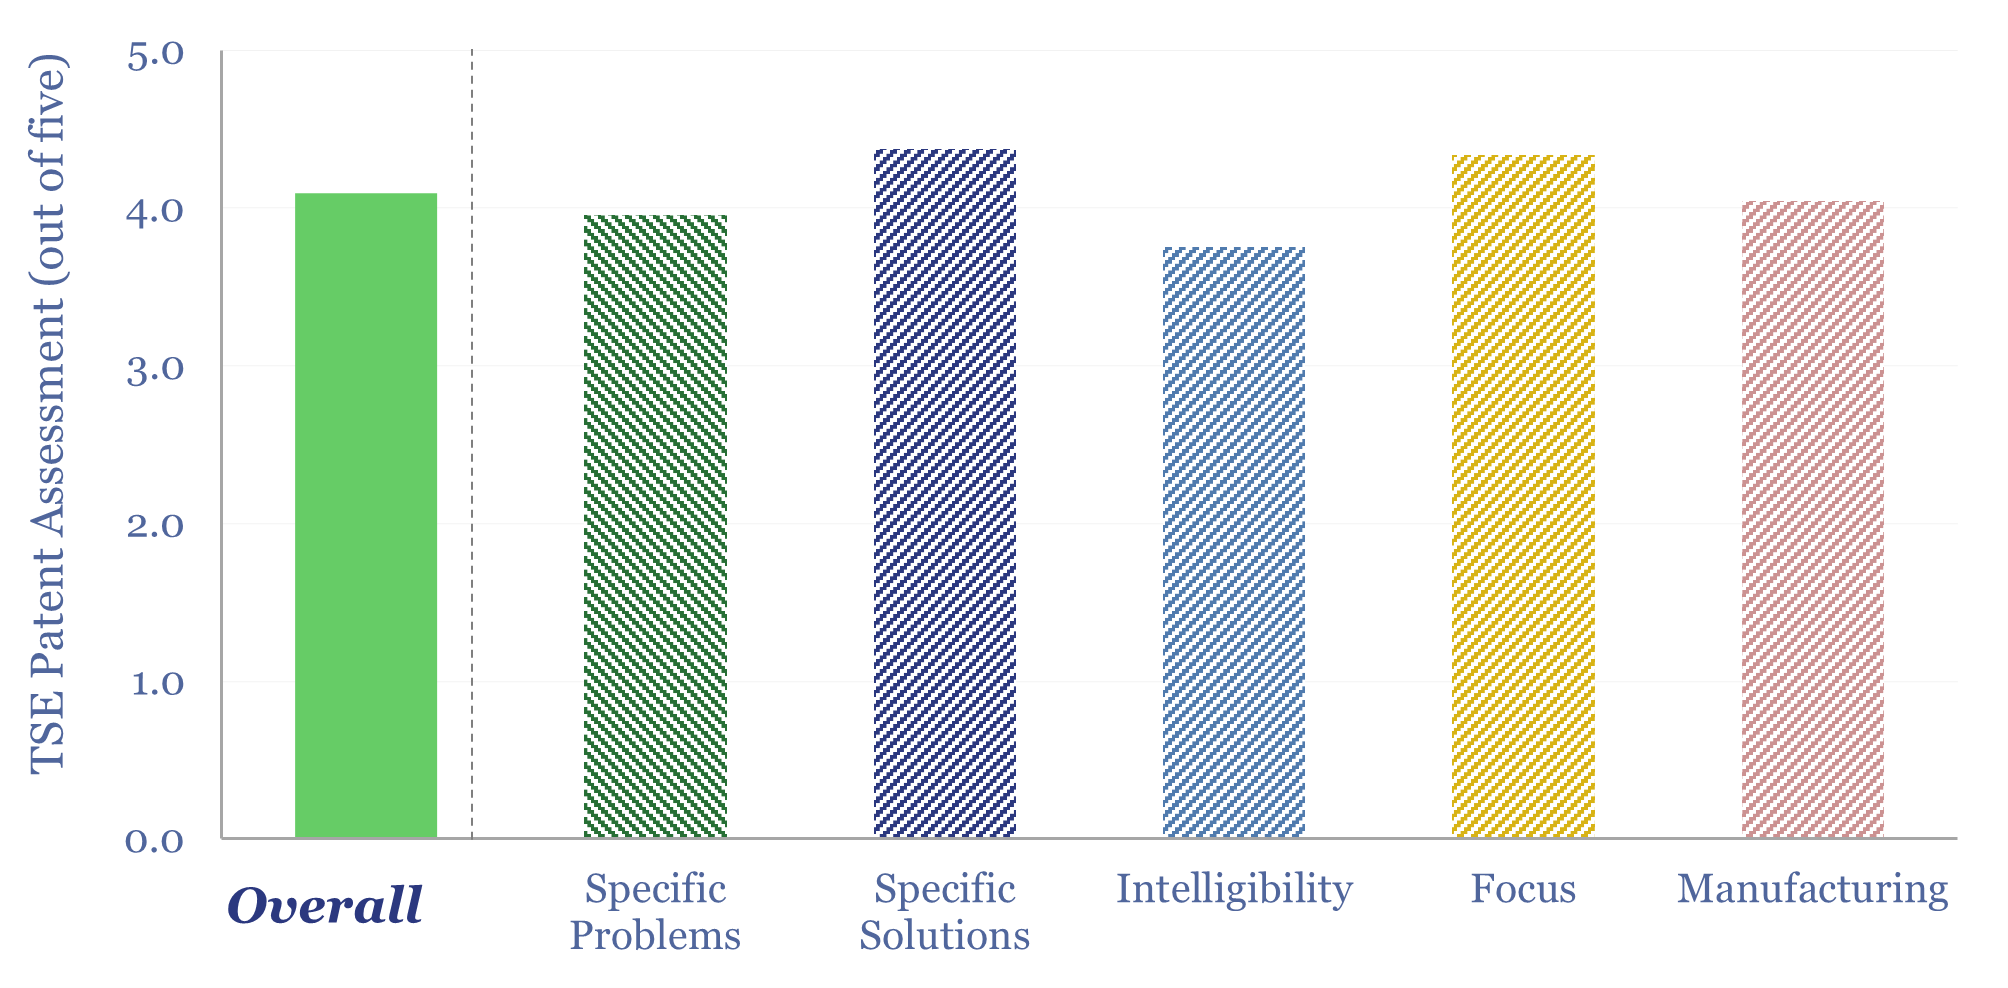
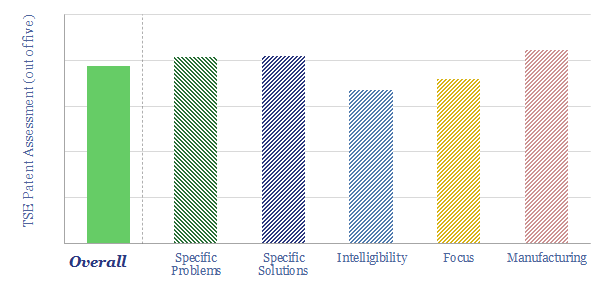
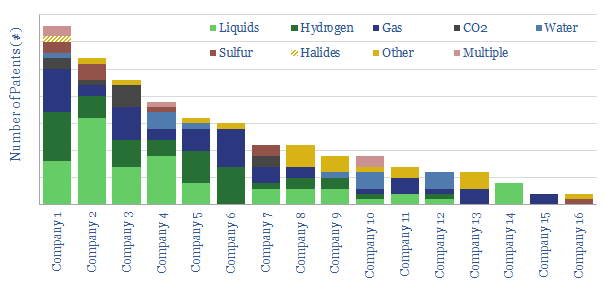
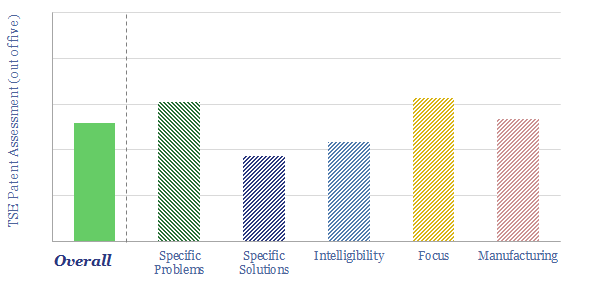
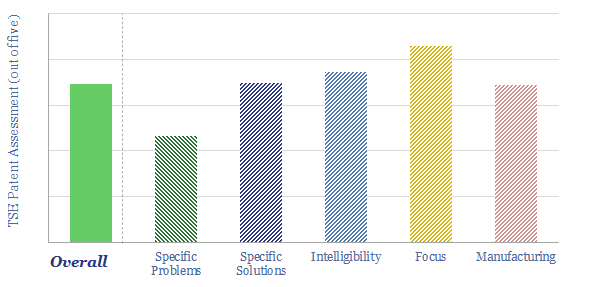
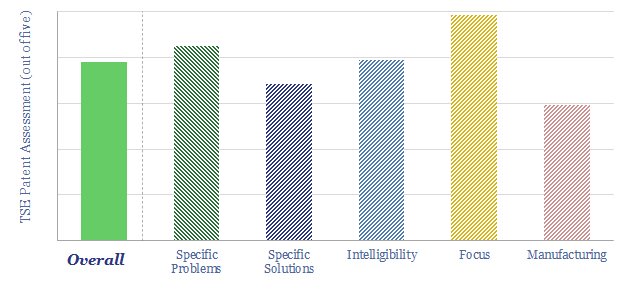
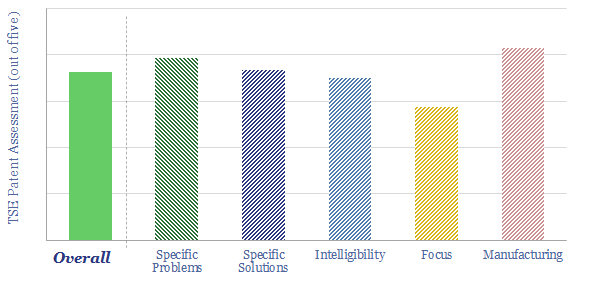
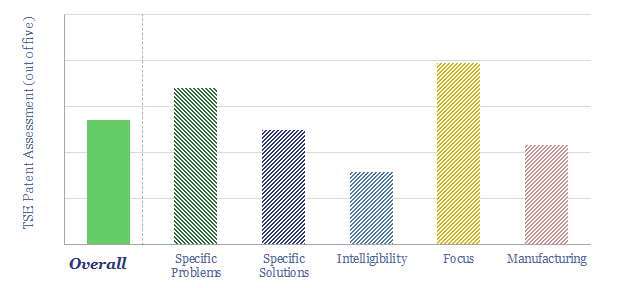
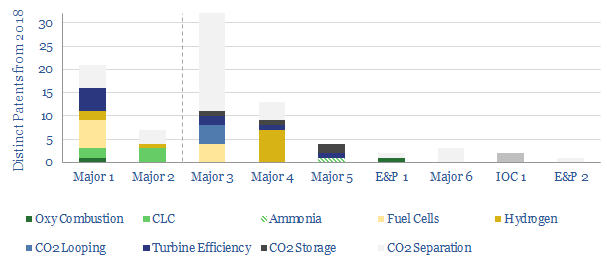
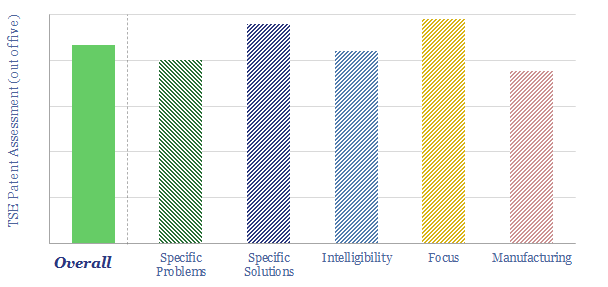
Patent Leaders in Energy
Download
US Shale Gas to Liquids?
Download
Explaining US gasoline?
Download
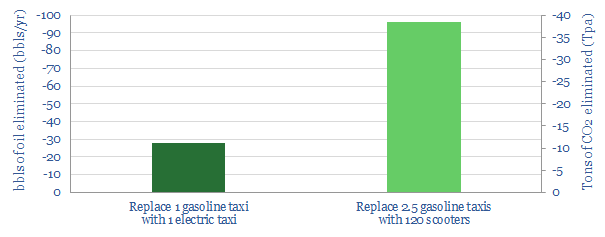
Electric cars slow the energy transition?
Download
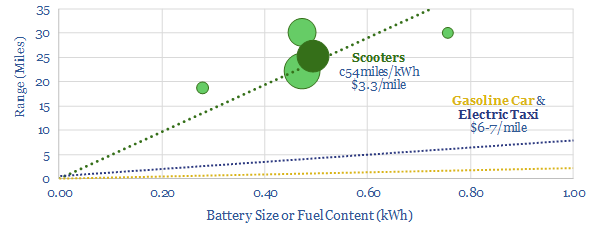
Scooter Wars?
Download
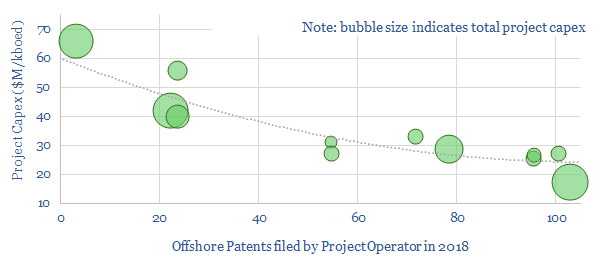
Offshore Capex for Technology Leaders?
Download
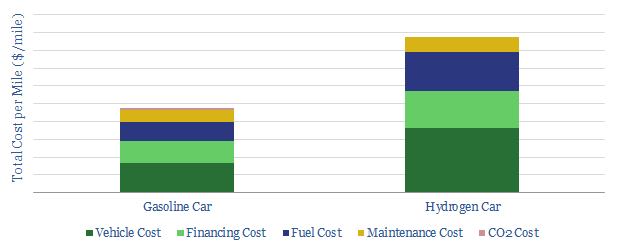
Hydrogen Cars: how economic?
Download
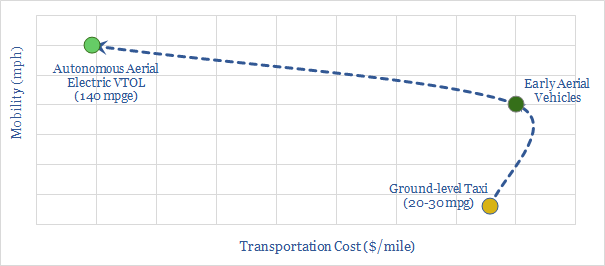
Aerial Vehicles: why flying cars fly
Download
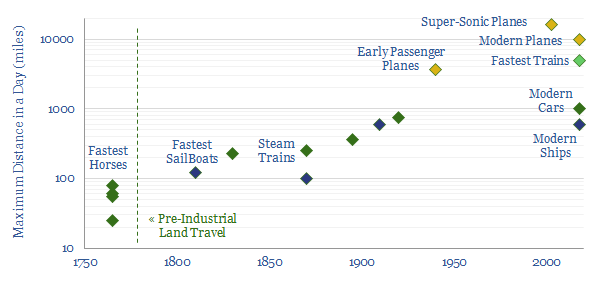
A Short History of Travel Speeds
Download
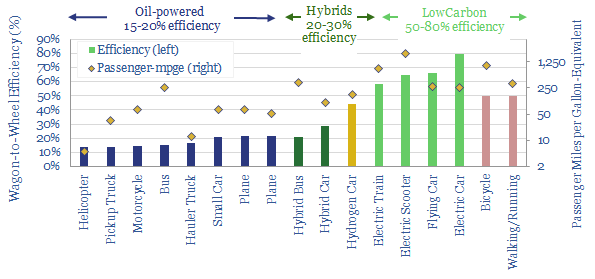
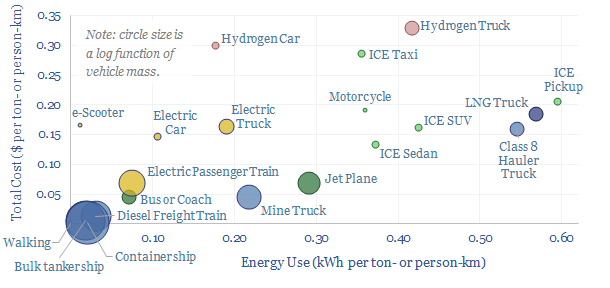
Vehicles: fuel economy and energy efficiency?
Download
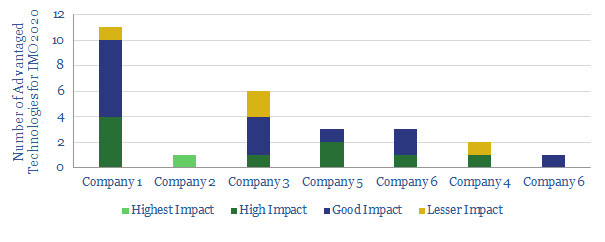
Our Top Technologies for IMO 2020
Download
Plastics and Polymers Research
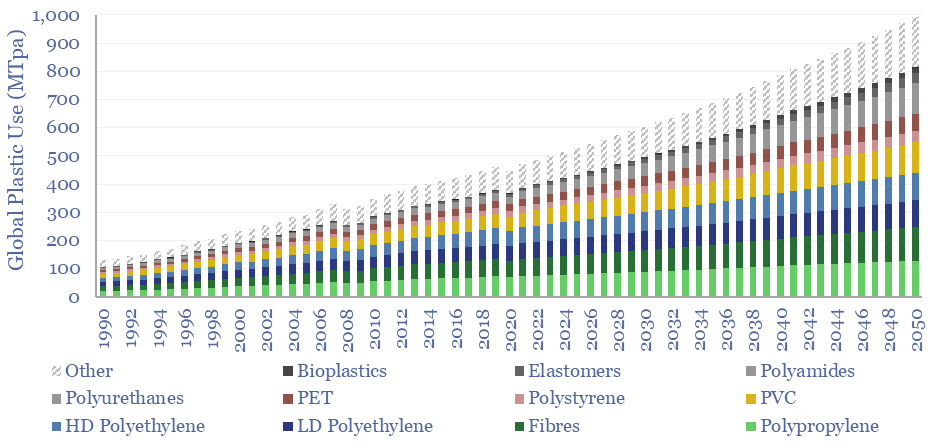
Global plastic demand: breakdown by product, region and use?
Download
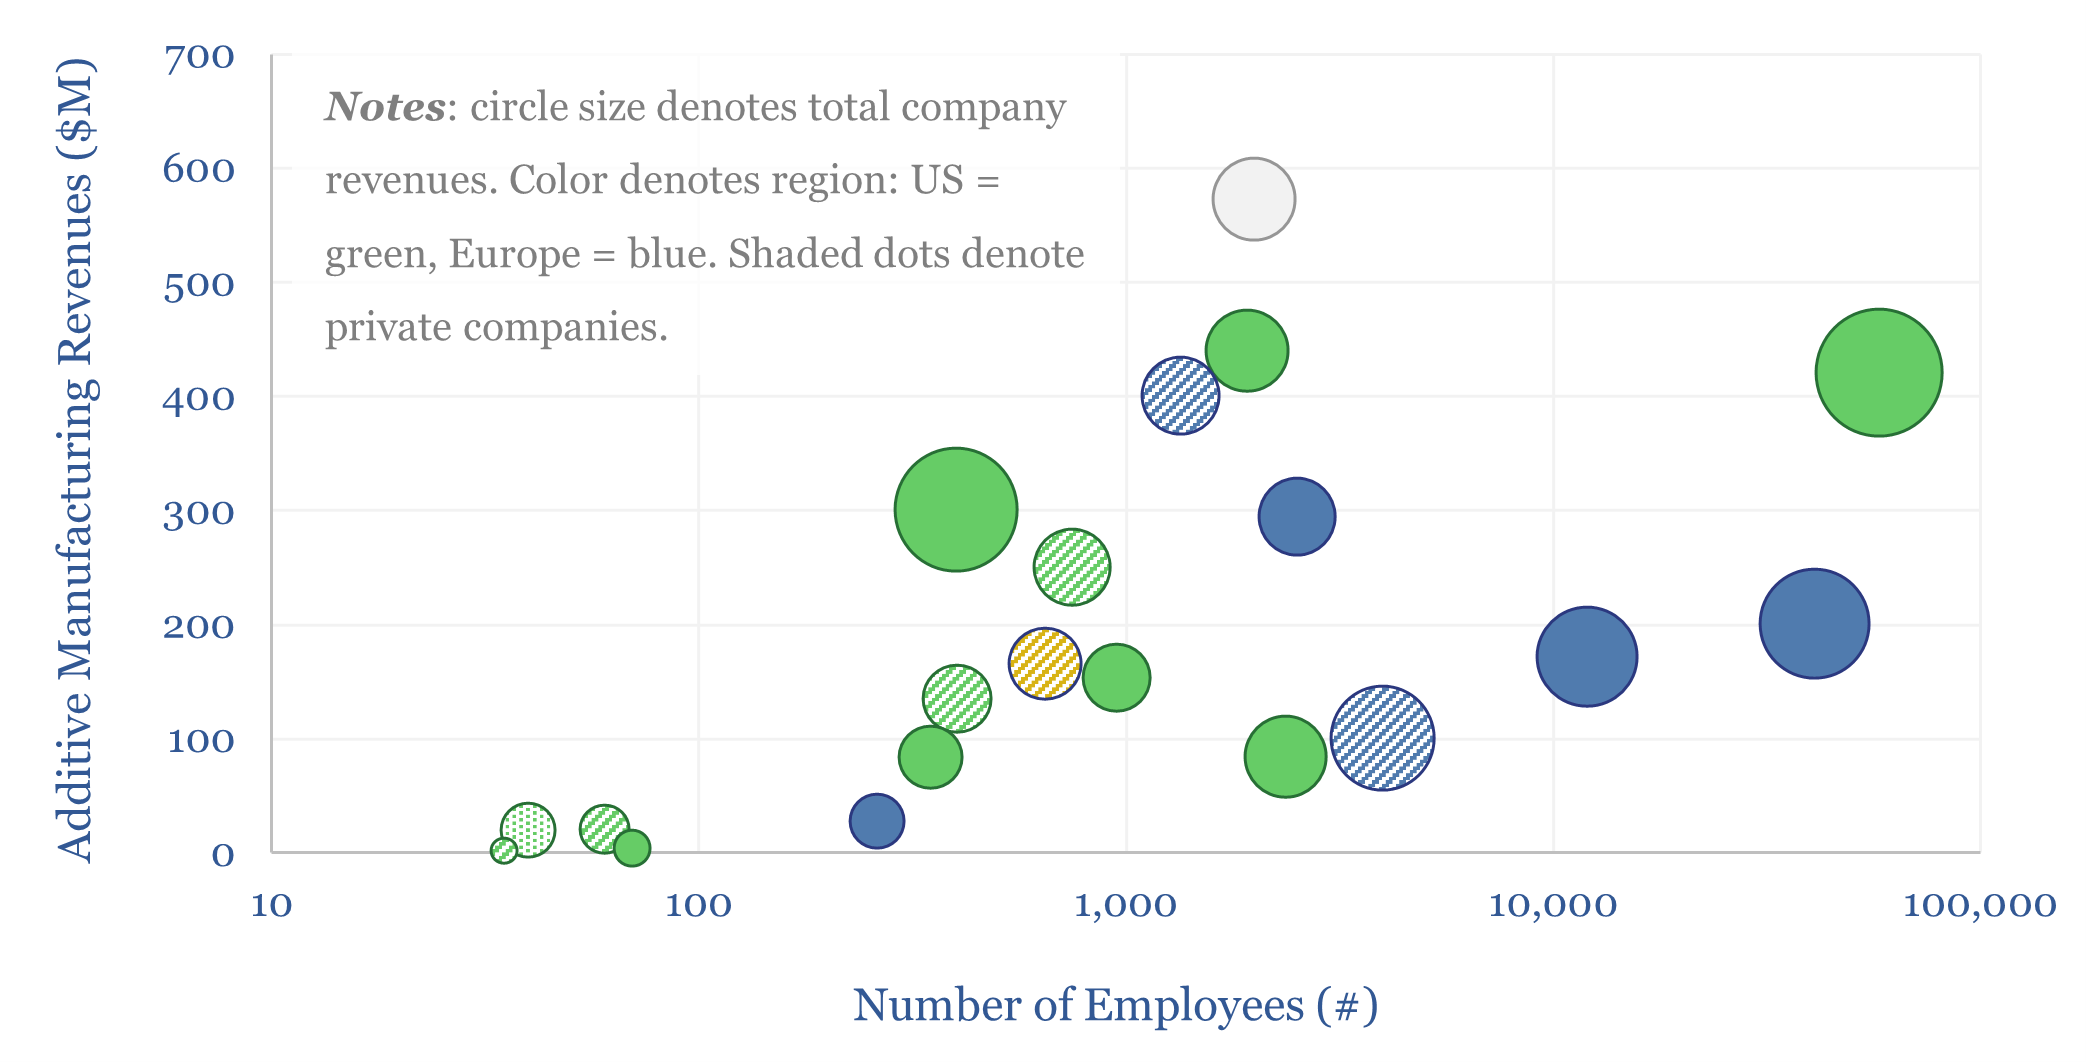
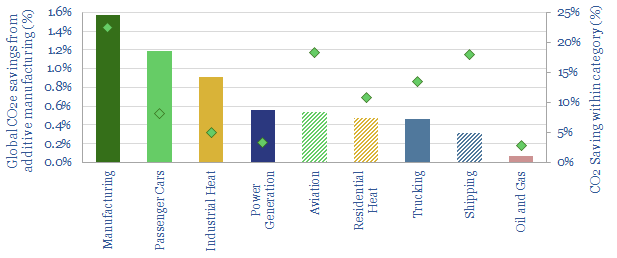
Additive manufacturing: technology leaders?
Download
Poly Vinyl Chloride: the economics?
Download
Eastman: molecular recycling technology?
Download
Plastic recycling: the economics?
Download
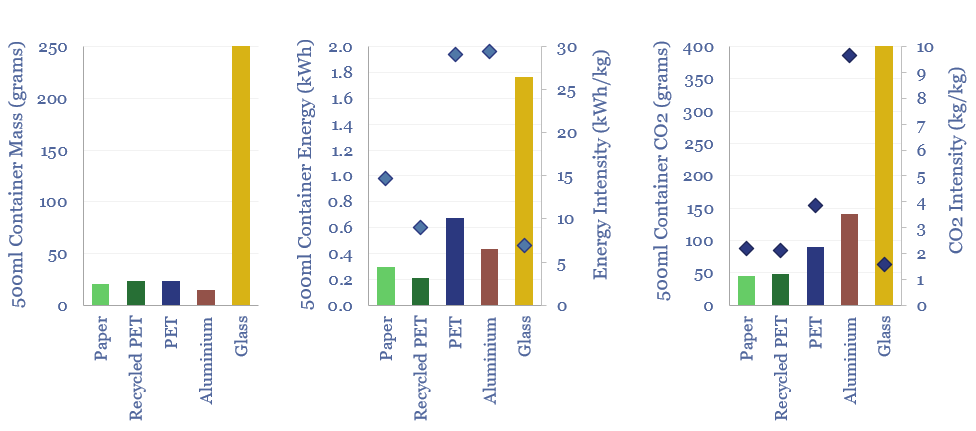
Plastic products: energy and CO2 intensity of plastics?
Download
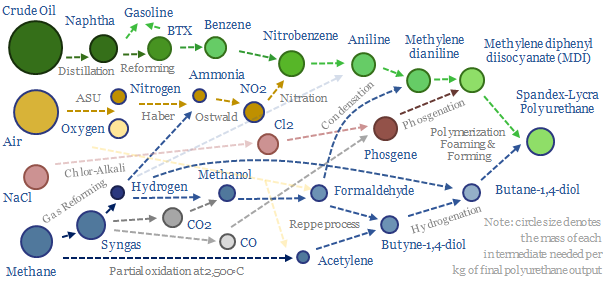
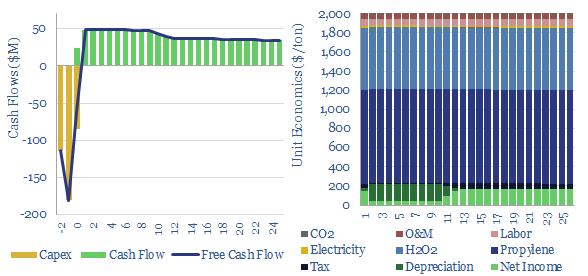
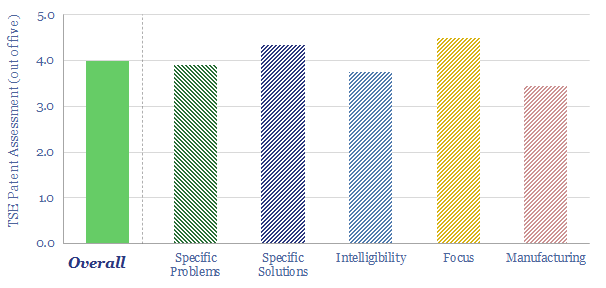
Polyurethanes: what upside in energy transition?
Download
Propylene oxide: production costs?
Download
Naphtha cracking: costs of ethylene, propylene and aromatics?
Download
Crude to chemicals: there will be naphtha?
Download
Newlight AirCarbon: bioplastics breakthrough?
Download
Acetylene: production costs?
Download
Purified terephthalic acid: PTA production costs?
Download
Polyester: production process?
Download
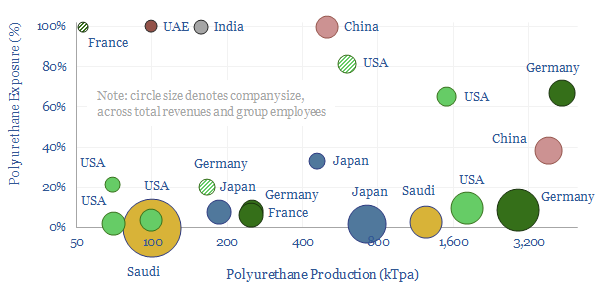
Polyurethane: leading companies?
Download
Alterra Energy: technology review?
Download
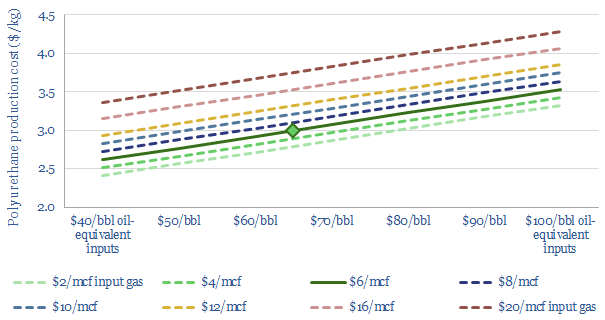
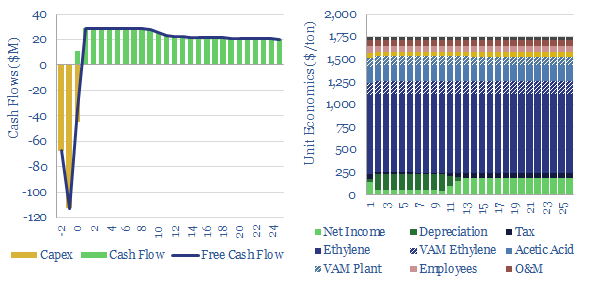
Polyurethane: production costs?
Download
Ethylene vinyl acetate: production costs?
Download
Agilyx: plastic recycling breakthrough?
Download
PureCycle: polypropylene recycling breakthrough?
Download
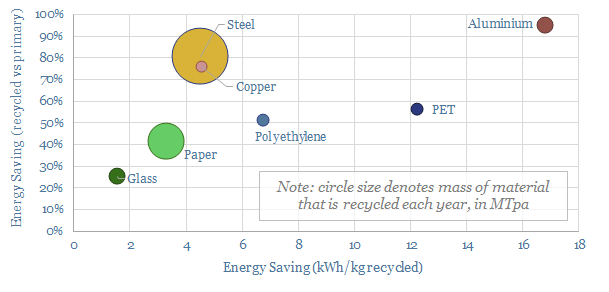
Recycling: a global overview of energy savings?
Download
Stora Enso: next-generation packaging breakthrough?
Download
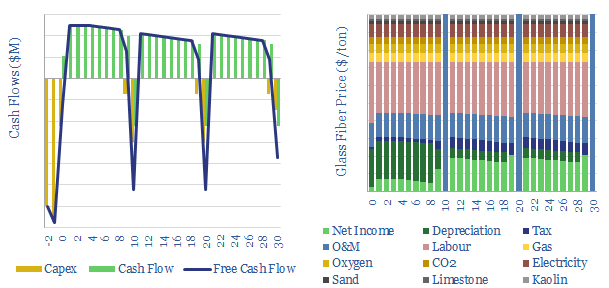
Glass fiber: the economics?
Download
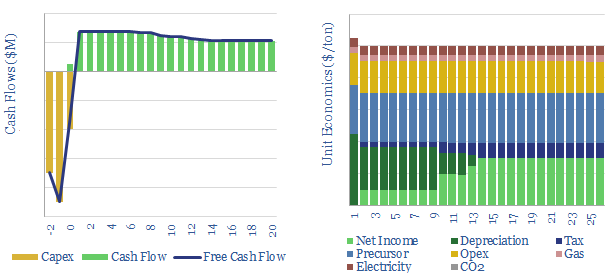
Carbon fiber: energy economics?
Download
Carbios: plastic recycling breakthrough?
Download
Danimer: bio-plastics breakthrough?
Download
Origin Materials: bio-plastics breakthrough?
Download
Polymers and higher olefins: the economics?
Download
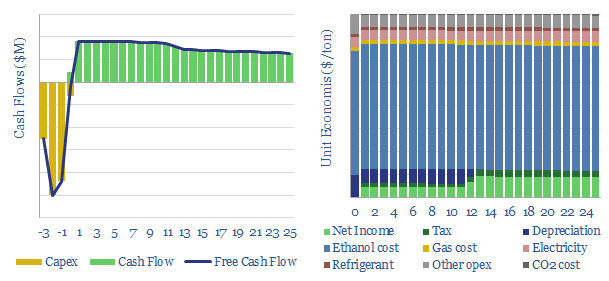
Ethanol-to-ethylene: the economics?
Download
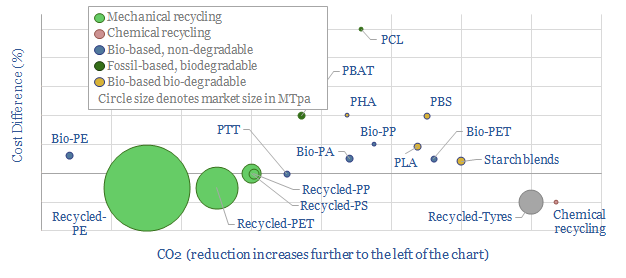
Next-generation plastics: bioplastic, biodegradable, recycled?
Download
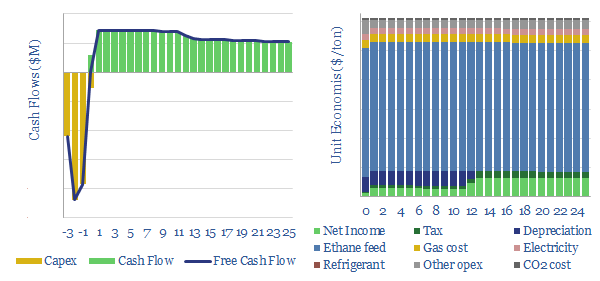
Ethane cracking: the economics?
Download
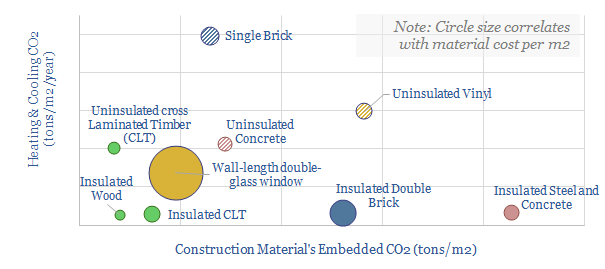
Construction materials: a screen of costs and CO2 intensities?
Download
CO2 electrolysis: the economics?
Download
3D printing an energy transition?
Download
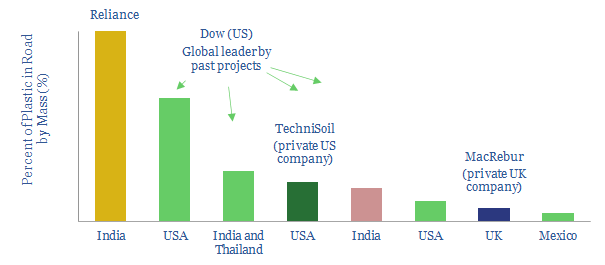
Turn the Plastics into Roads?
Download
Plastic Recycling Companies: pyrolysis and next-generation recycling?
Download
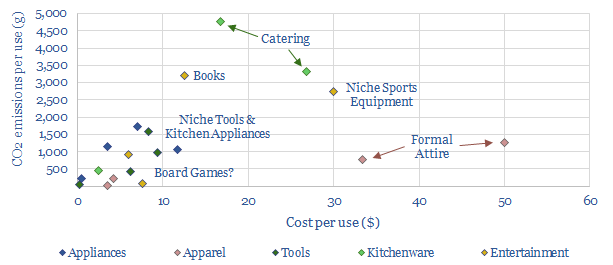
Value in Use: CO2 intensities of household items?
Download
Make CO2 into valuable products?
Download
TOTAL’s Plastic-Recycling Progress?
Download
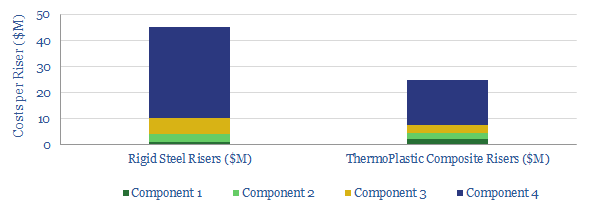
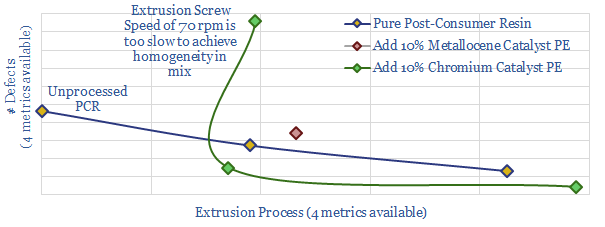
Thermo-Plastic Composite: The Future of Risers?
Download
Coal Research
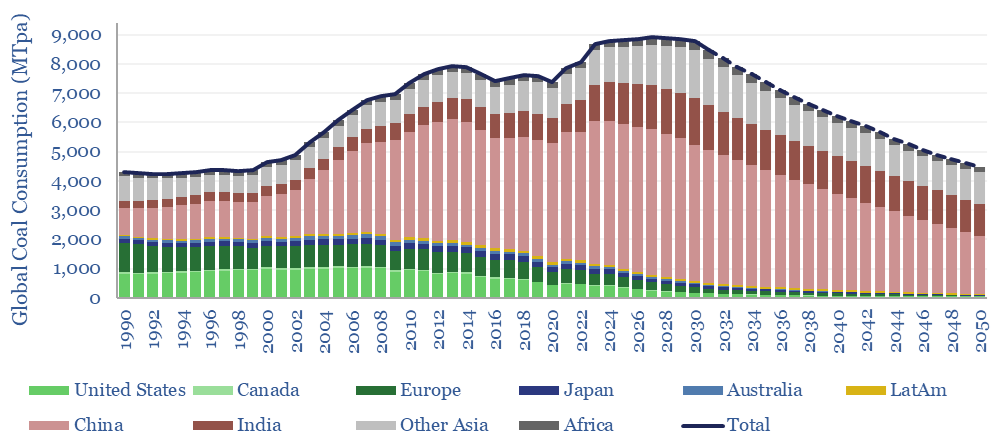
Global coal supply-demand: outlook in energy transition?
Download
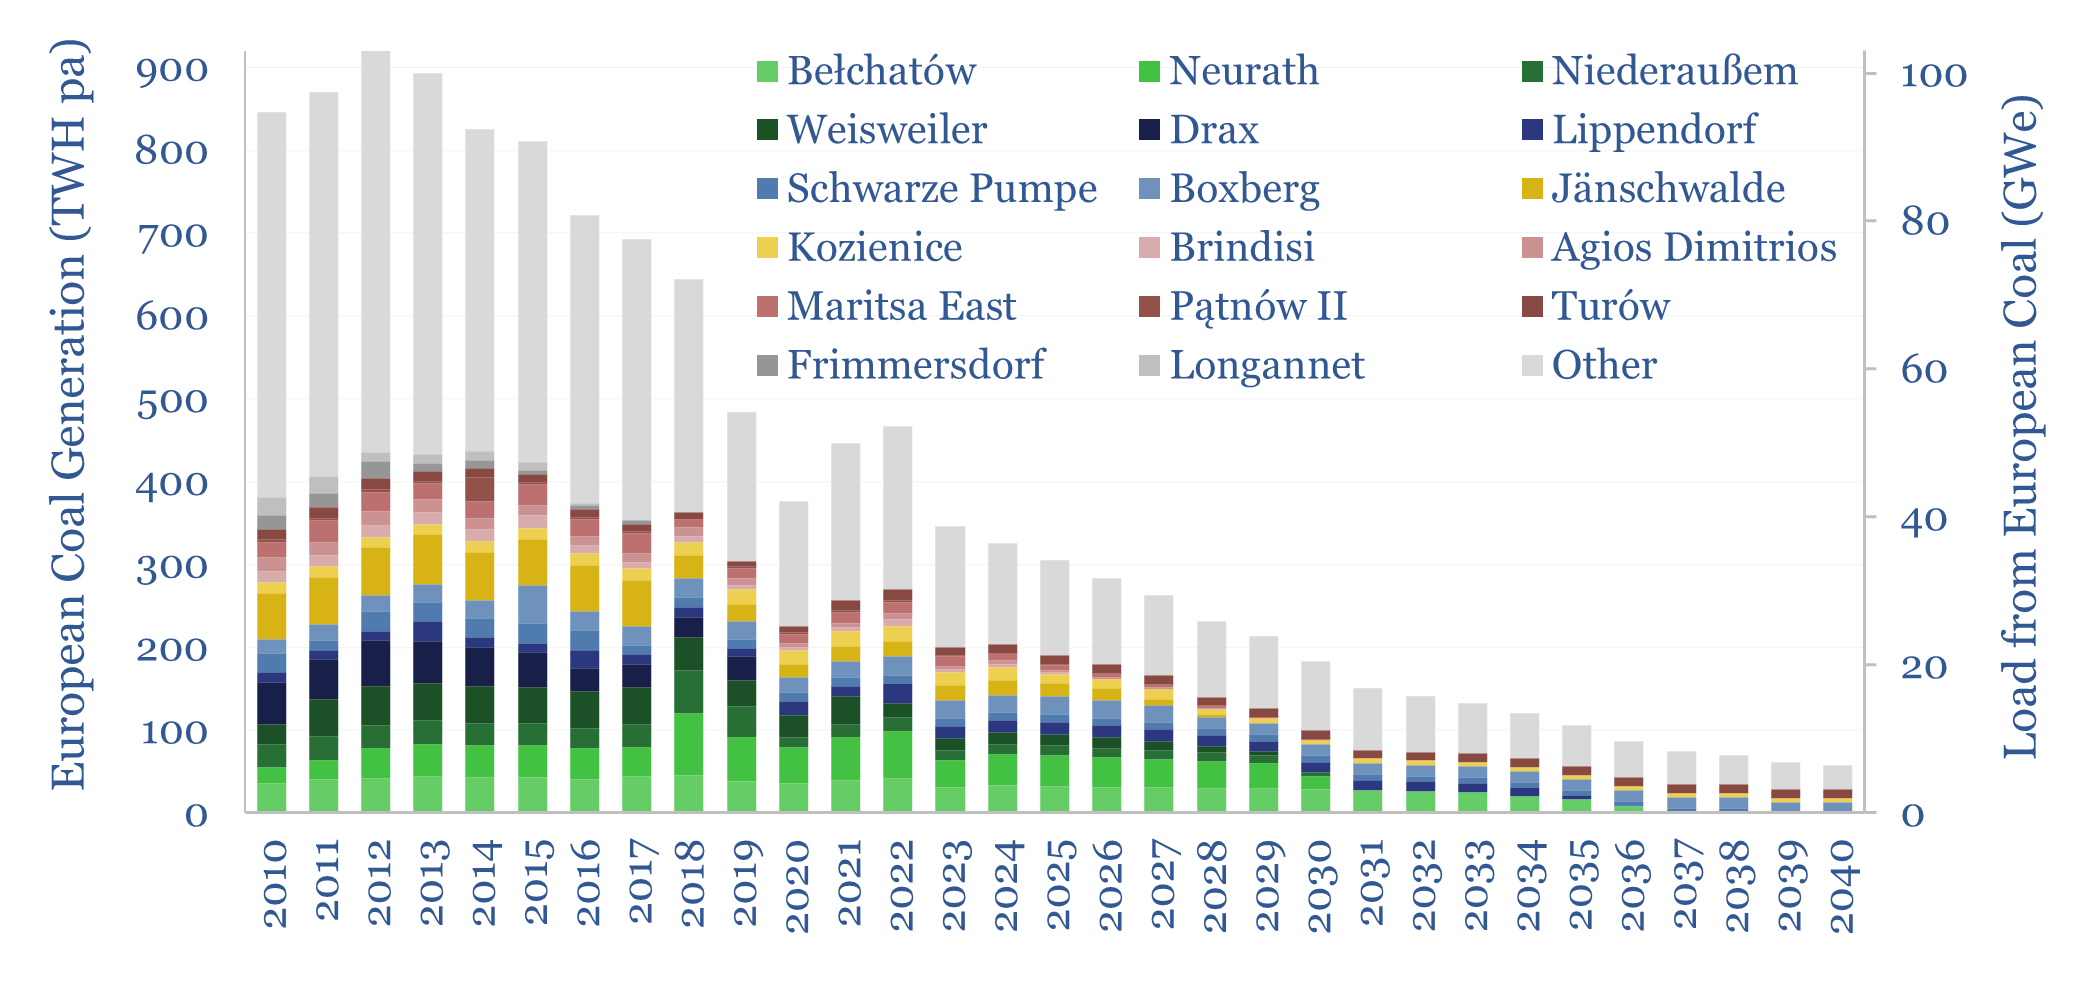
European coal generation by facility and coal plant closures?
Download
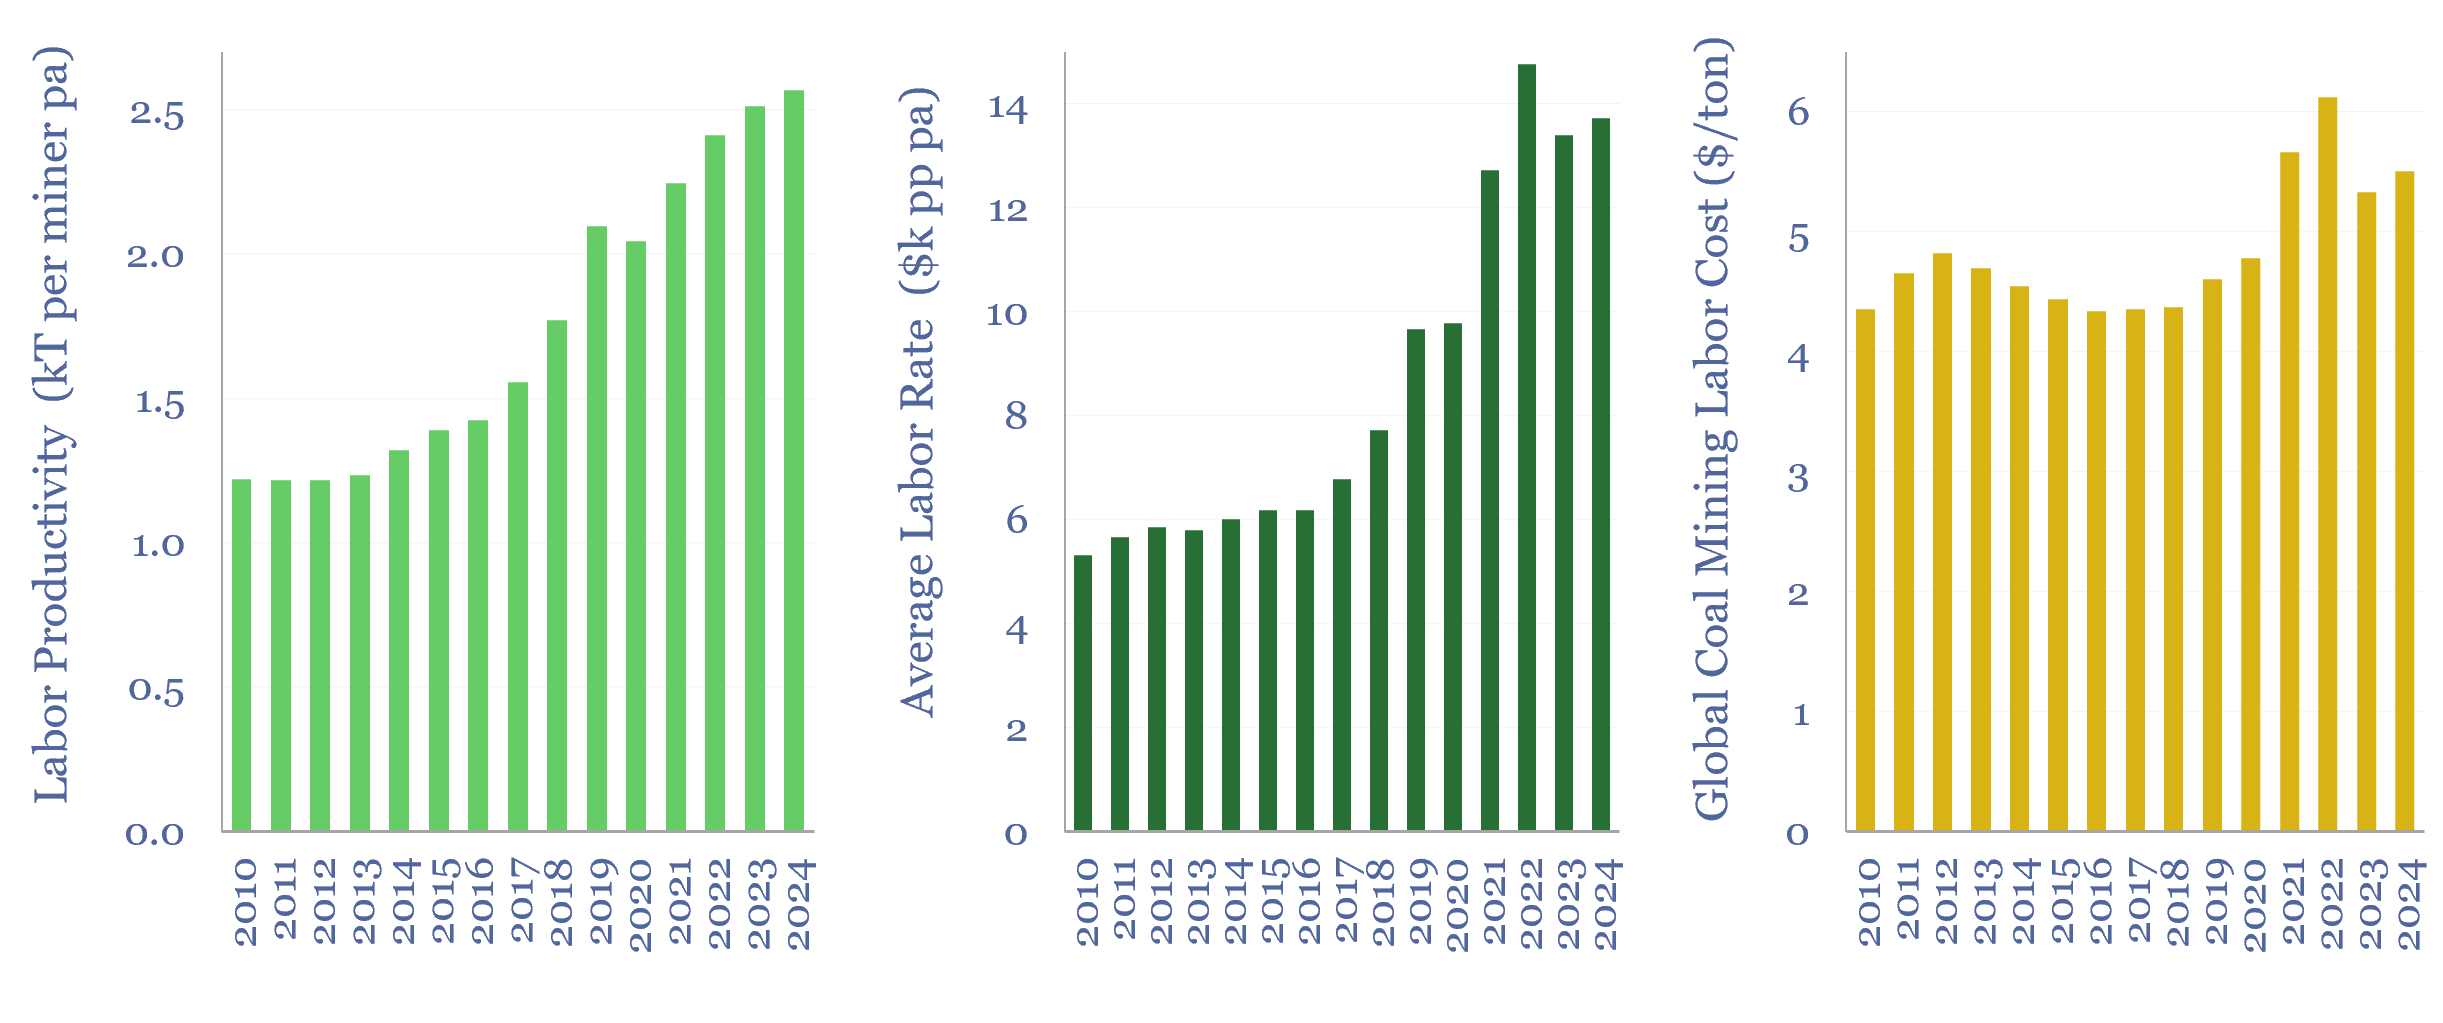
Labor costs of coal production: labor productivity and salaries?
Download
Energy transition: solar and gas -vs- coal hard reality?
Download
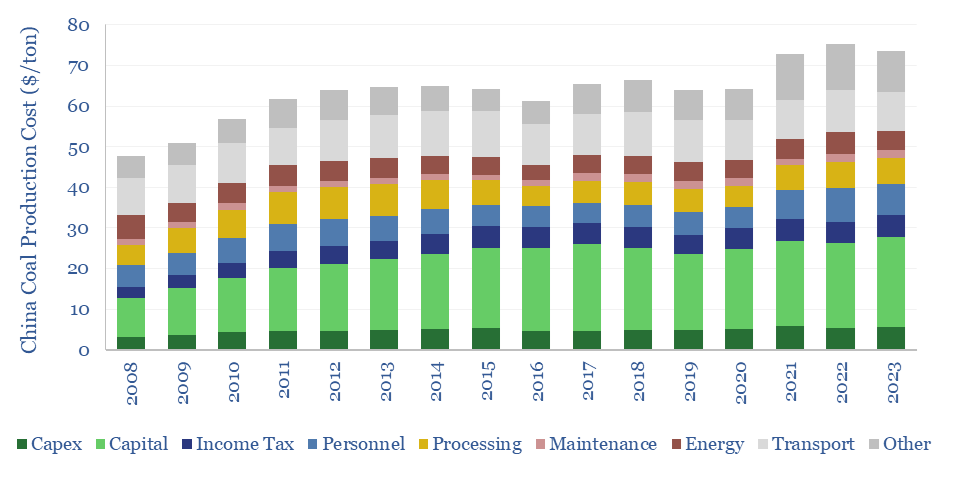
China coal production costs?
Download
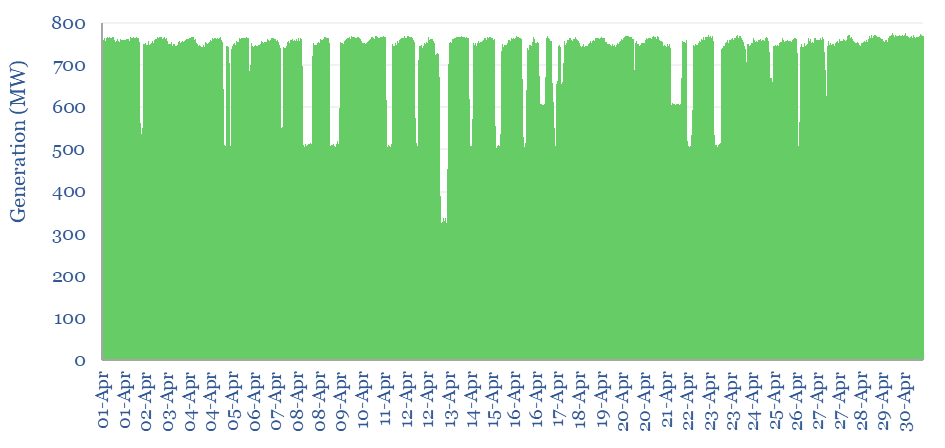
Coal power generation: minute-by-minute flexibility?
Download
European gas and power model: natural gas supply-demand?
Download
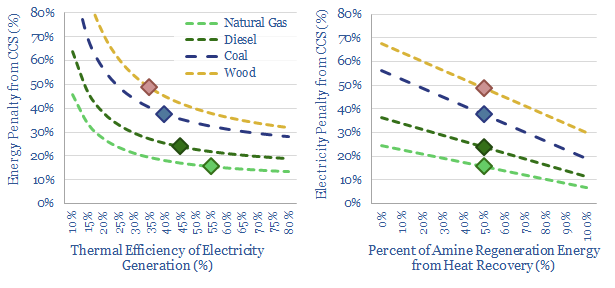
Post-combustion CCS: what energy penalties?
Download
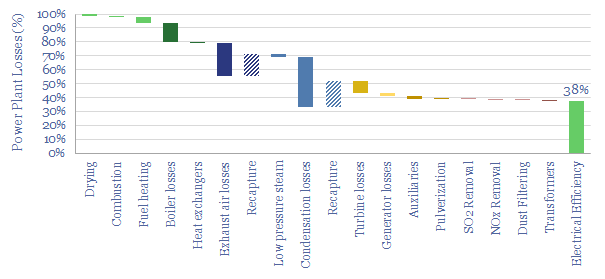
Thermal power plant: loss attribution?
Download
Electrostatic precipitator: costs of particulate removal?
Download
Selective catalytic reduction: costs of NOx removal?
Download
Air quality: sulphur, NOx and particulate emissions?
Download
Flue gas desulfurization: costs of SO2 scrubbers?
Download
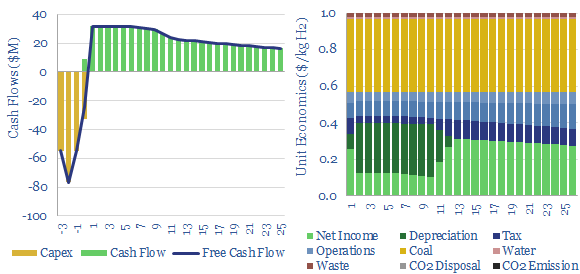
Costs of hydrogen from coal gasification?
Download
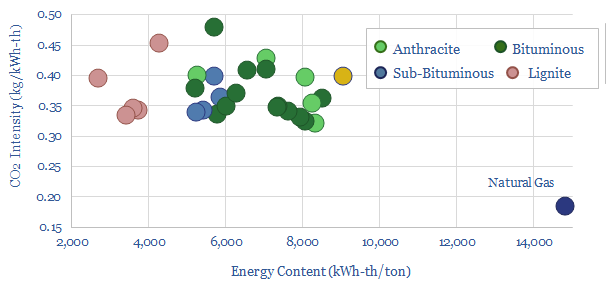
Coal grades: what CO2 intensity?
Download
Bio-coke: energy economics?
Download
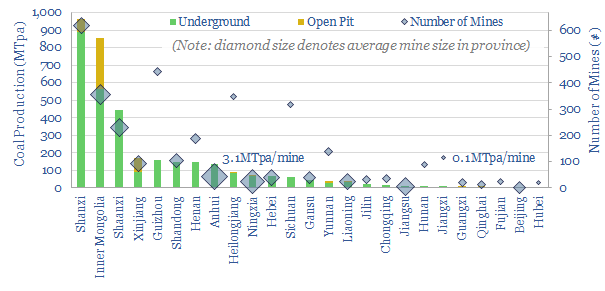
All the coal in China: our top ten charts?
Download
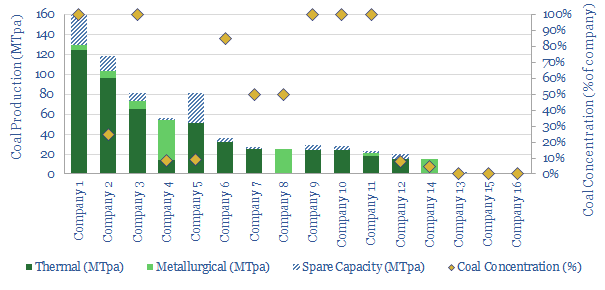
Coal miners: a screen of Western companies?
Download
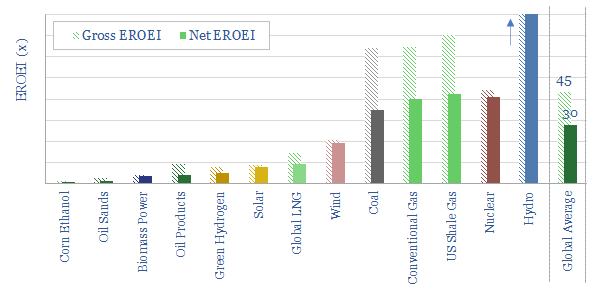
Energy return on energy invested?
Download
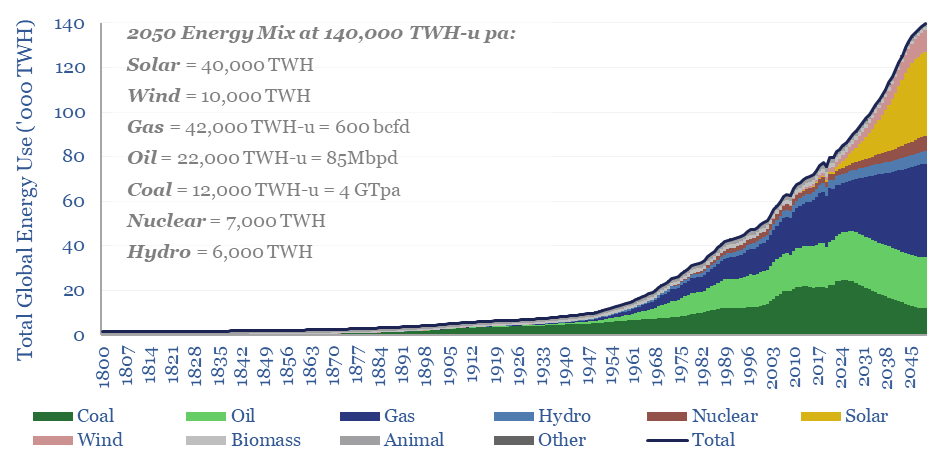
Global energy market model for the energy transition?
Download
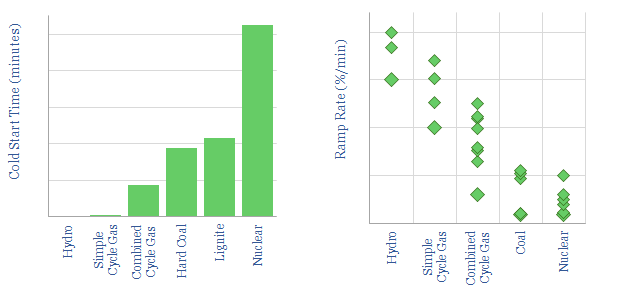
Power plants: cold starts and ramp rates?
Download
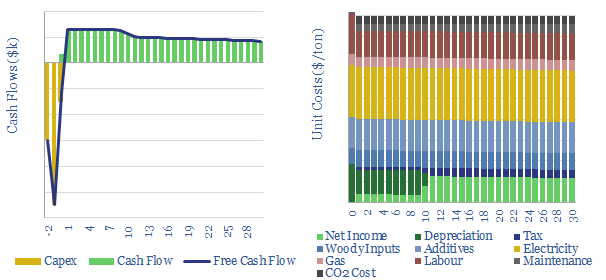
Coal mining: the economics?
Download
US CCS: market sizing?
Download
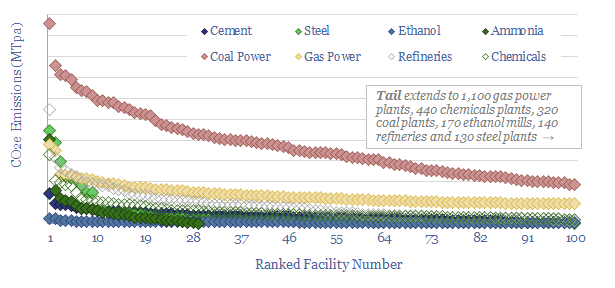
US CO2 emissions by industrial facility size?
Download
China: can the factory of the world decarbonize?
Download
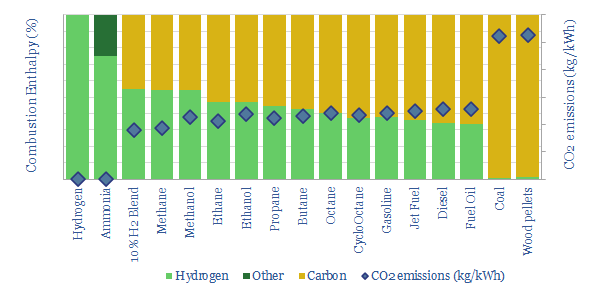
Energy economics: energy content of combustion fuels?
Download
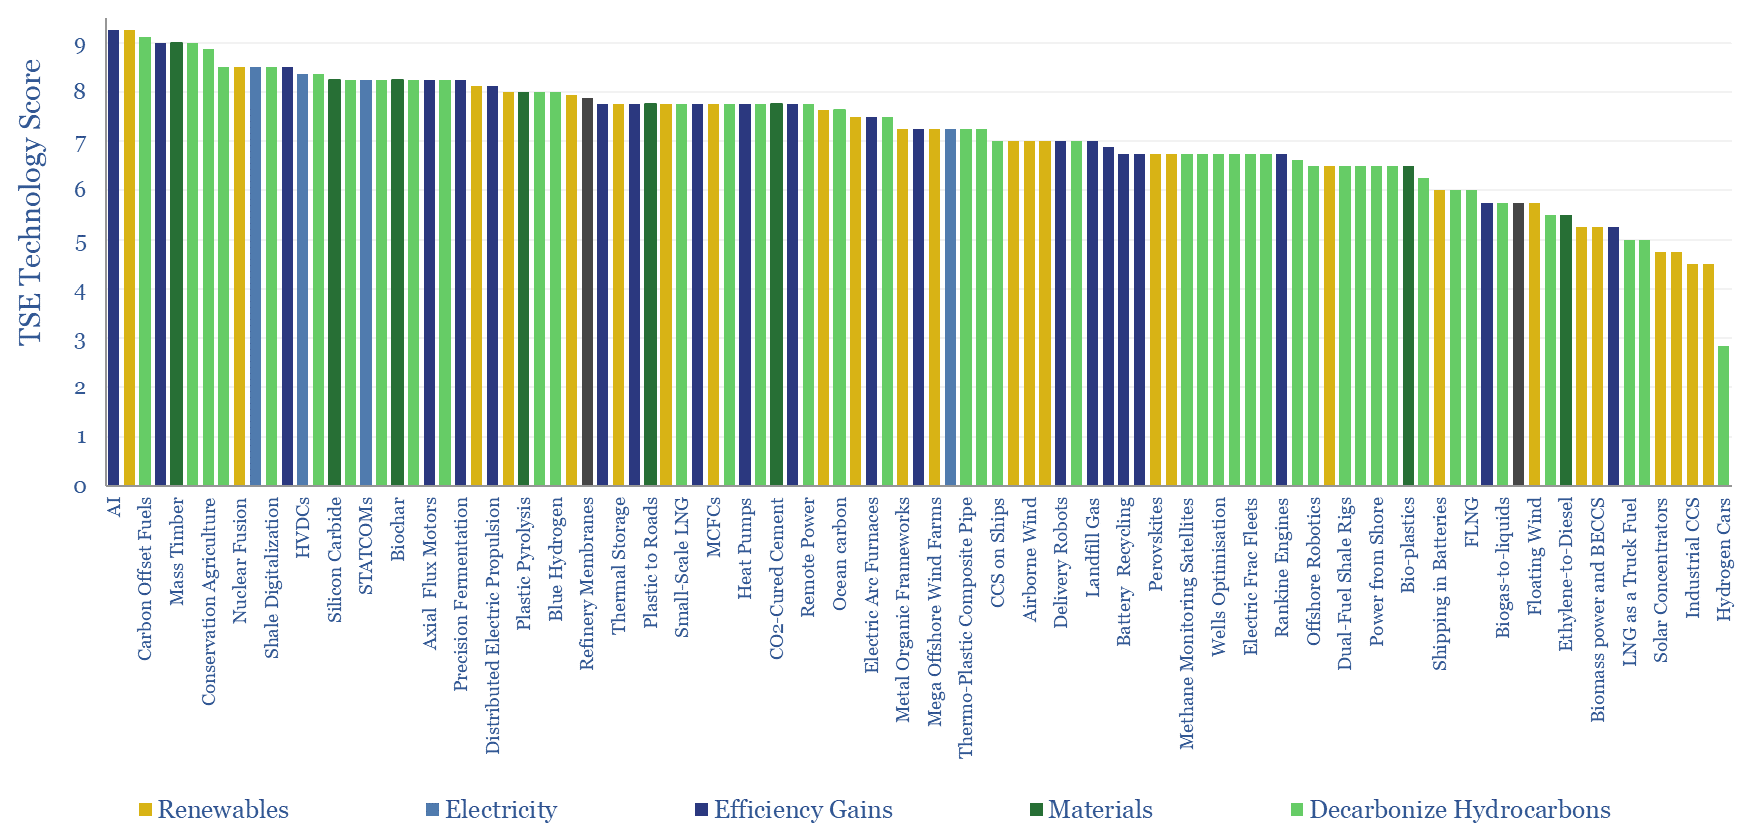
Energy Transition Technologies?
Download
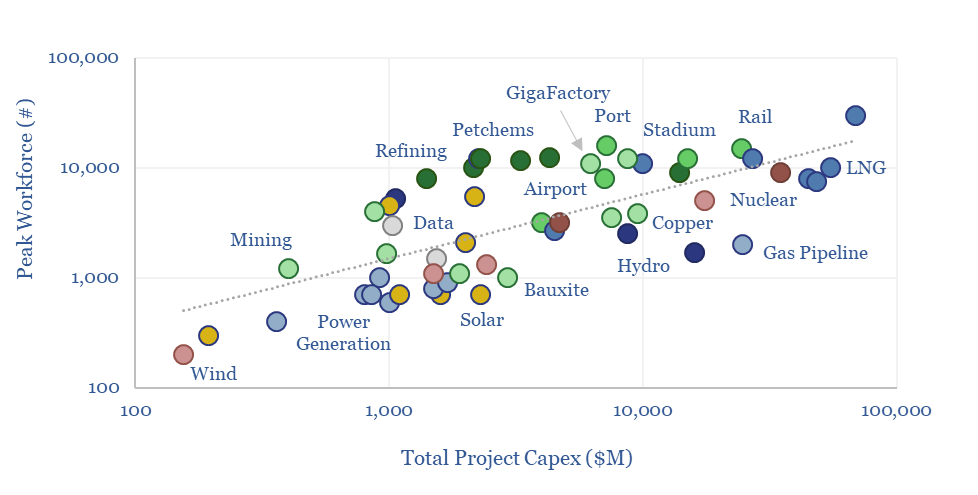
Energy infrastructure: labor intensity?
Download
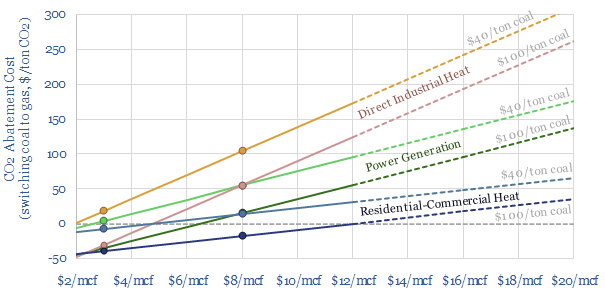
Coal-to-gas switching: what CO2 abatement cost?
Download
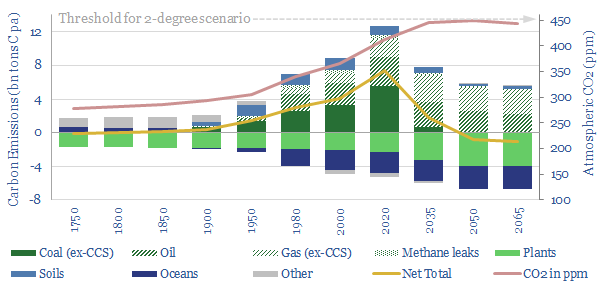
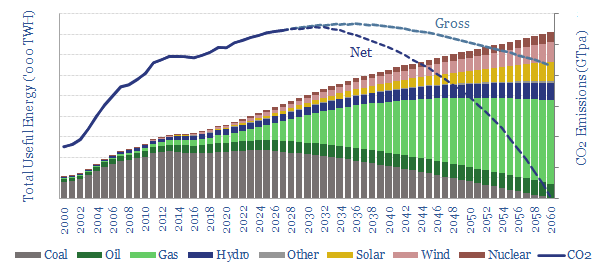
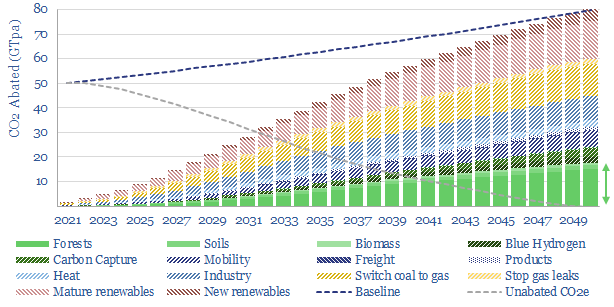
The route to net zero: an energy-climate model for 2-degrees
Download
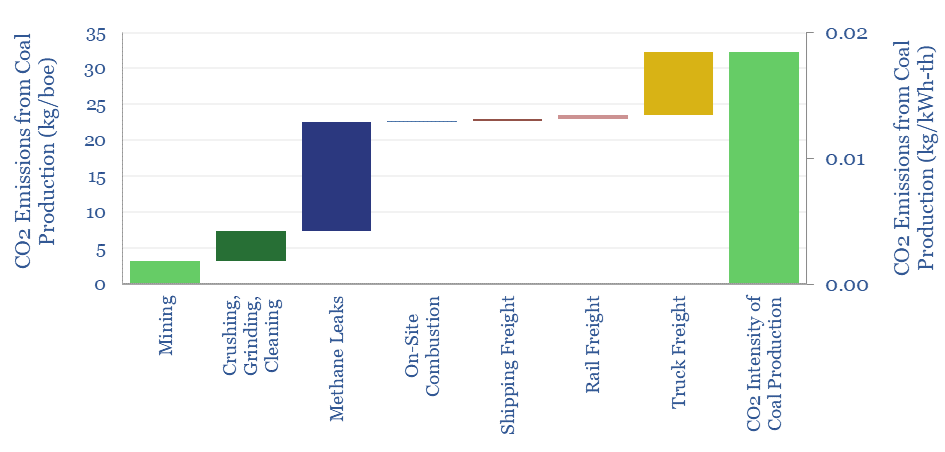
CO2 intensity of coal production?
Download
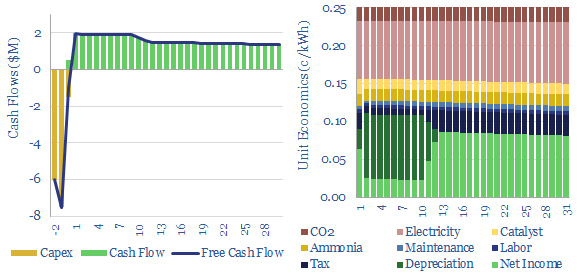
Molten Carbonate Fuel Cells: CCS plus Power? The Economics?
Download
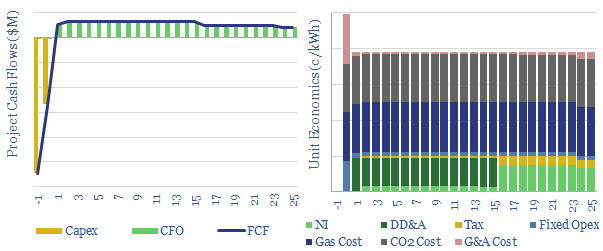
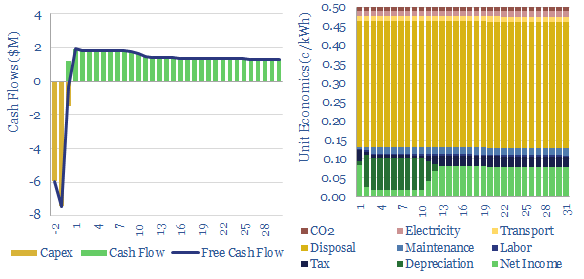
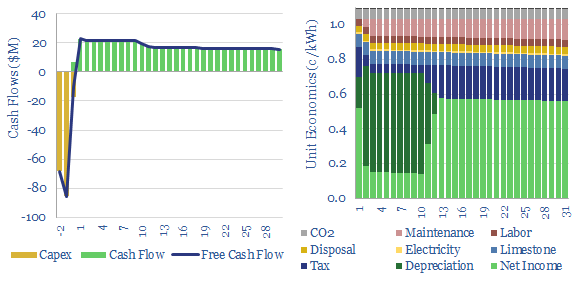
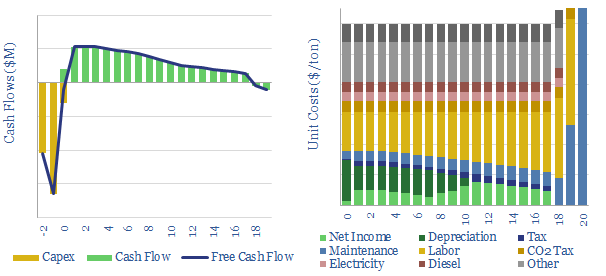
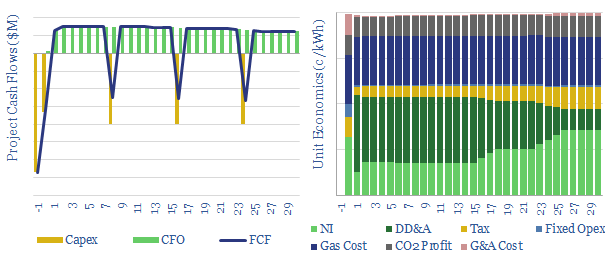
Coal-to-Power Project Economics
Download
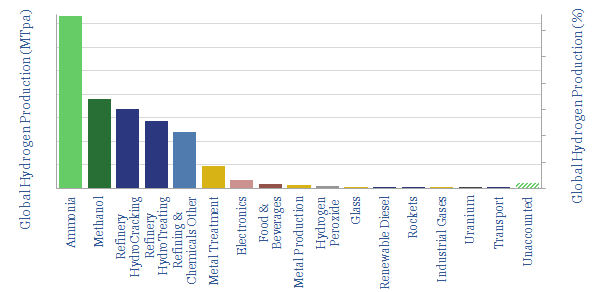
Global hydrogen: market breakdown?
Download
Global CO2 emissions breakdown?
Download
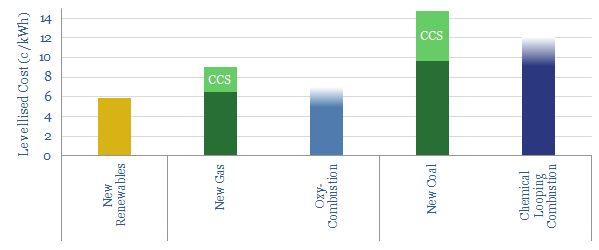
Major technologies to decarbonise power?
Download
De-carbonising carbon?
Download
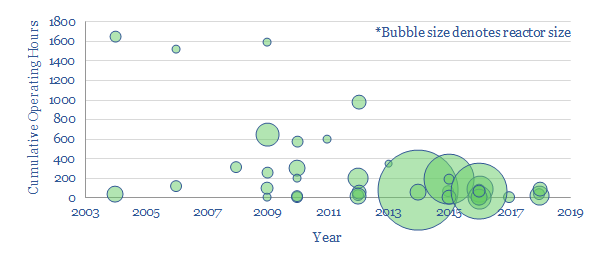
Chemical Looping Progress?
Download
Carbon Capture and Storage (CCS)
Vehicles: energy transition conclusions?
Download
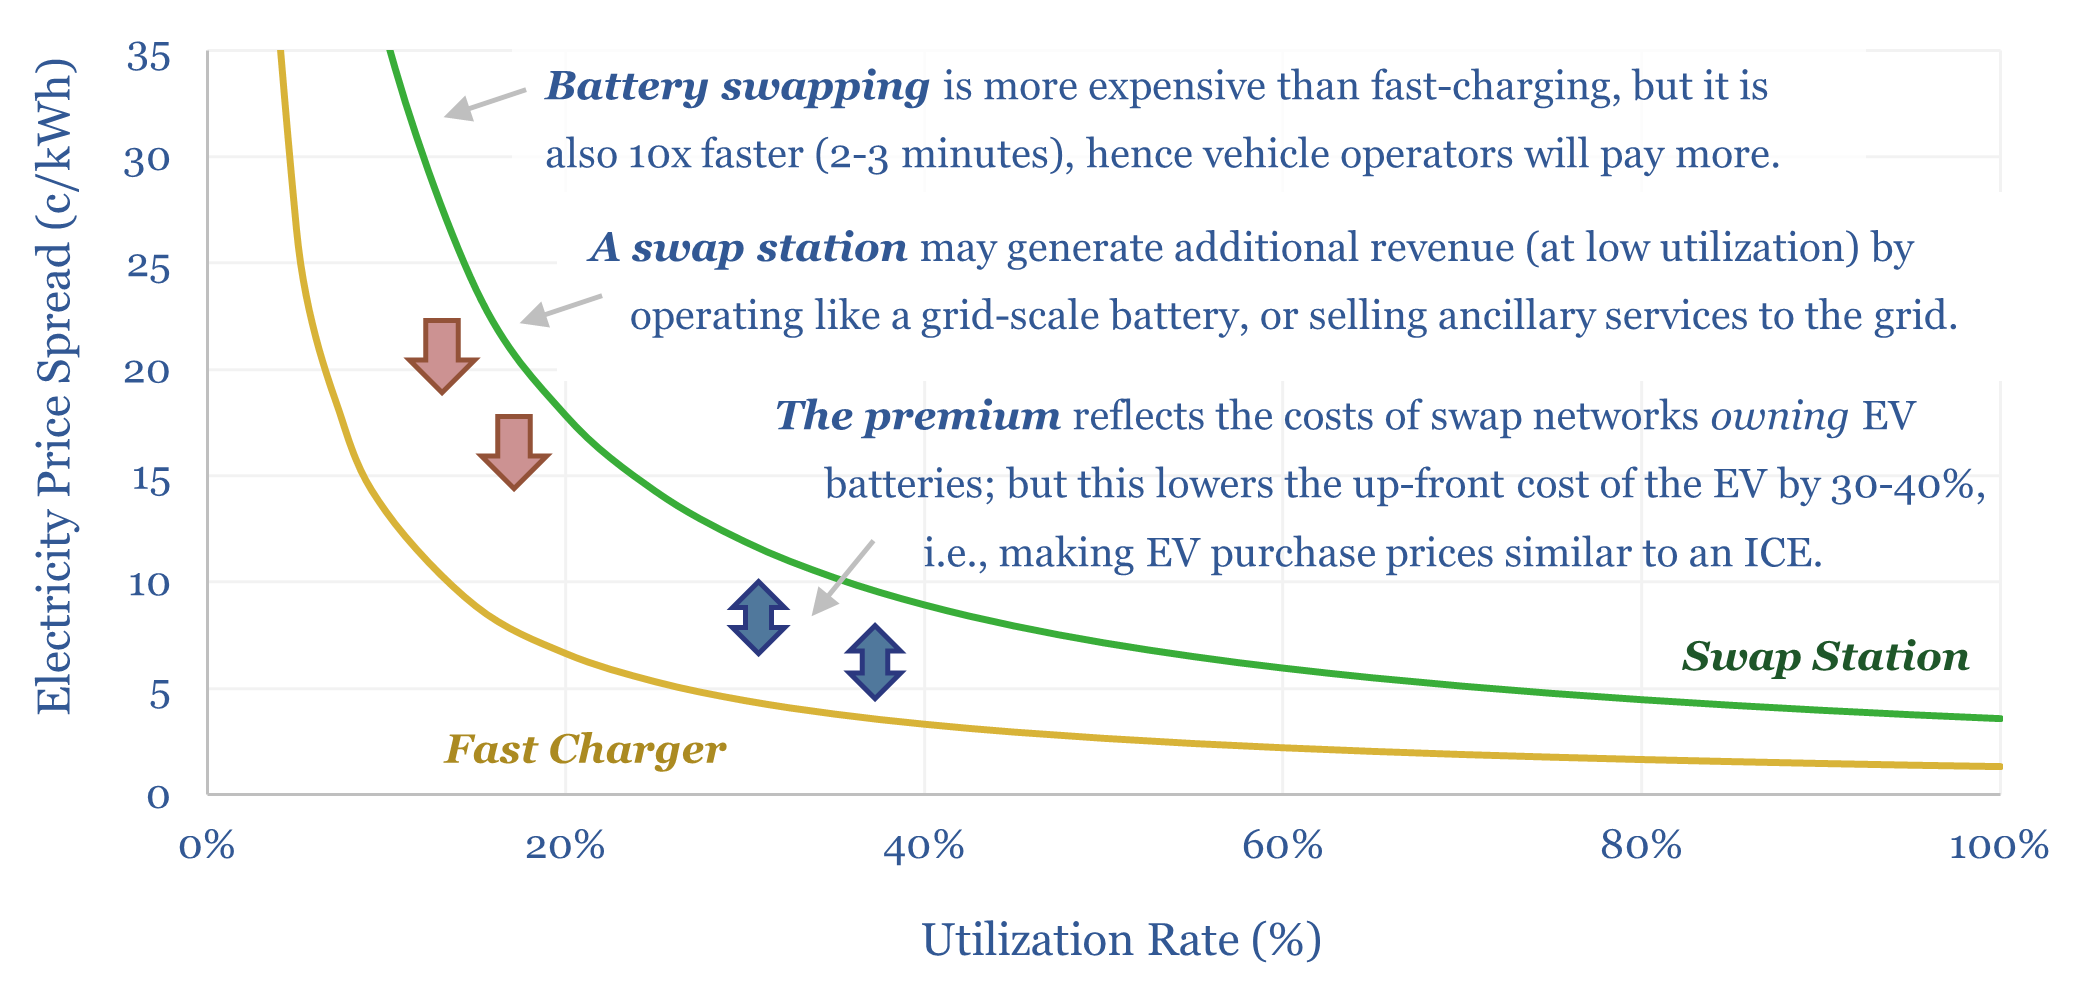
Battery swapping: off to the races?
Download
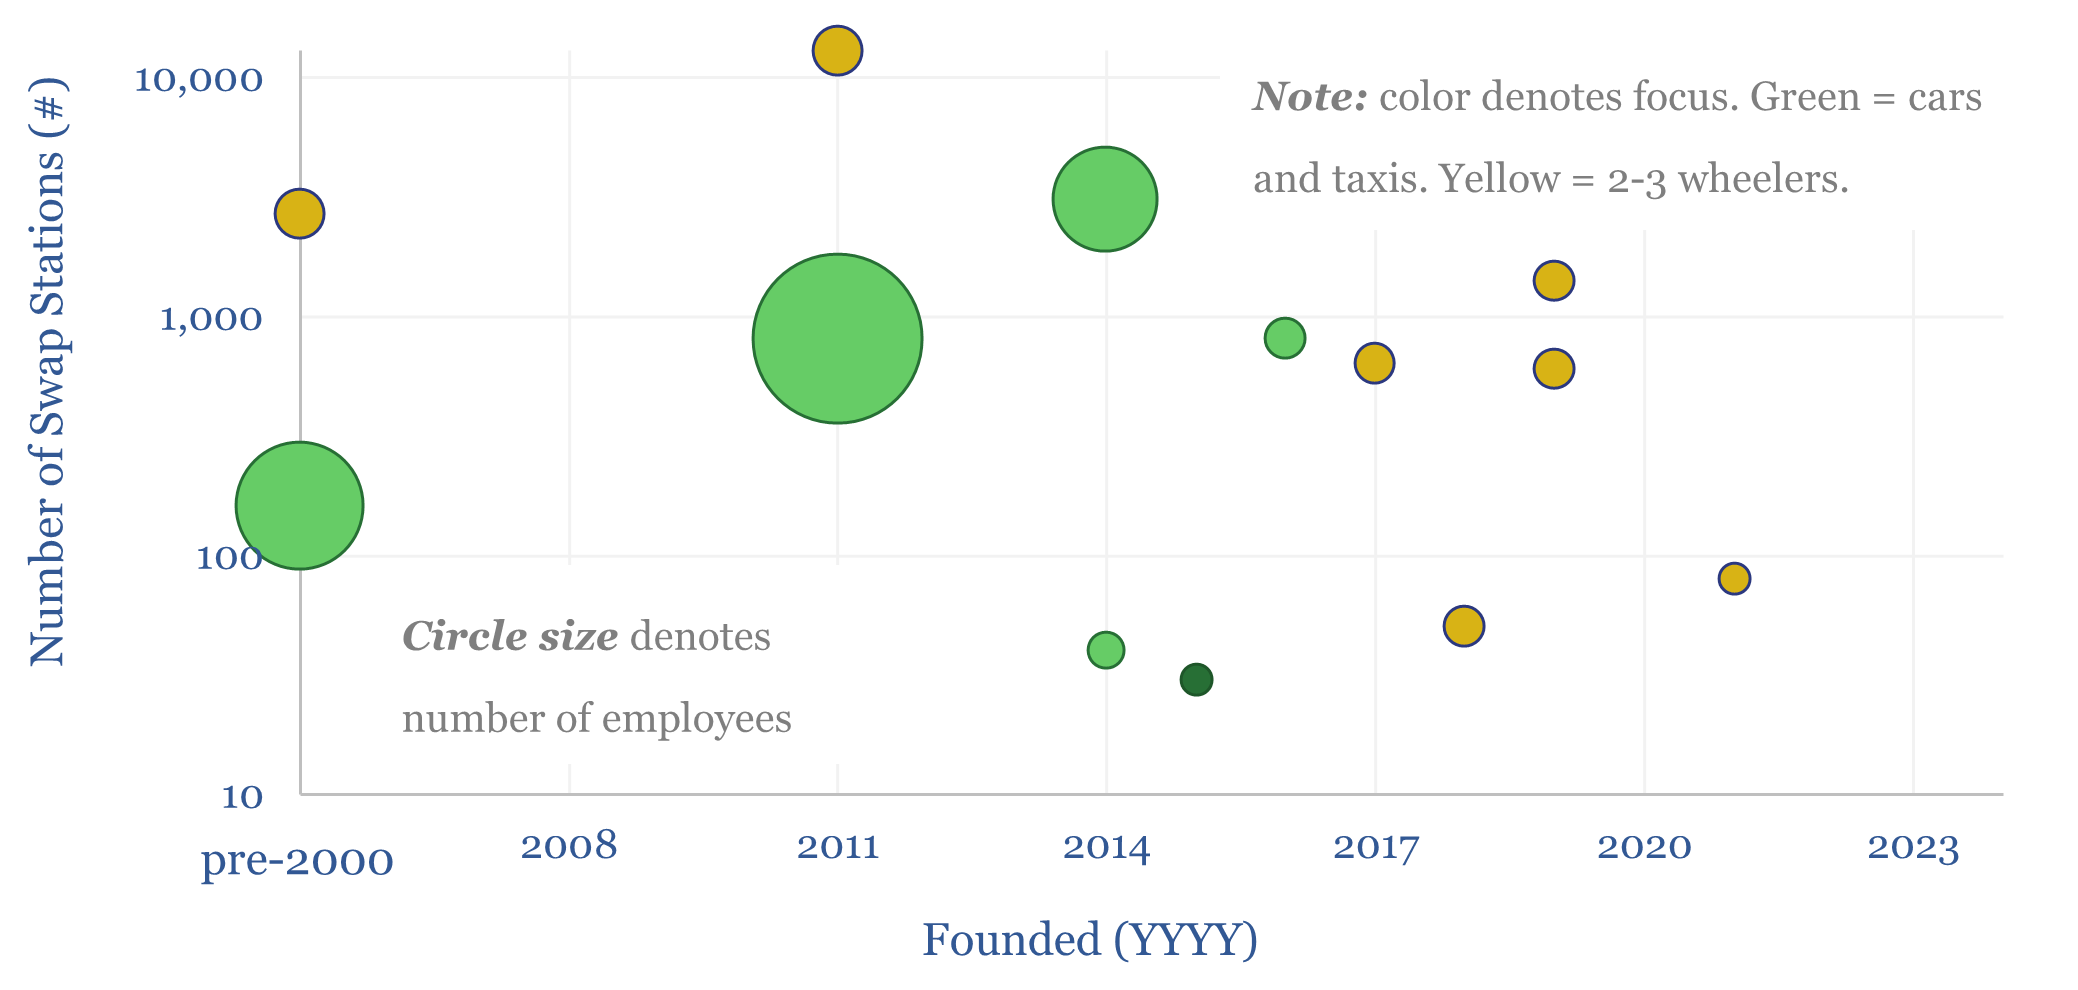
Battery swapping: leading companies?
Download
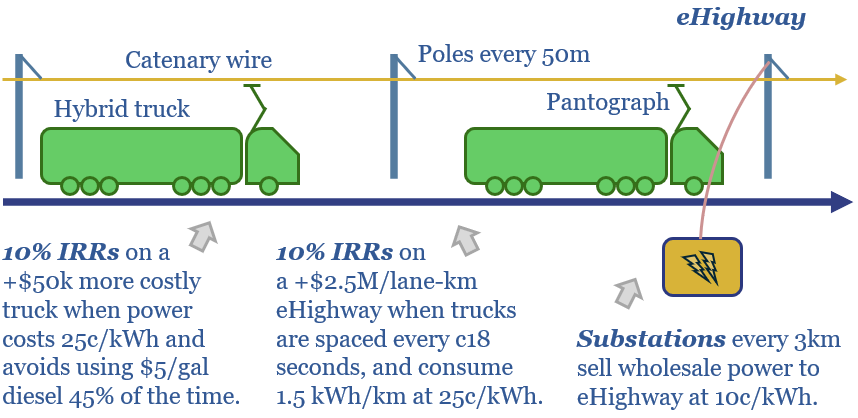
eHighways: trucking by wire?
Download
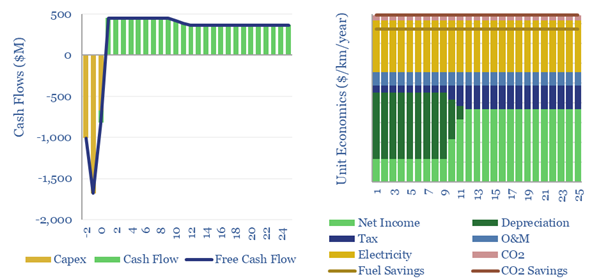
eHighway economics: costs of electrifying heavy trucks?
Download
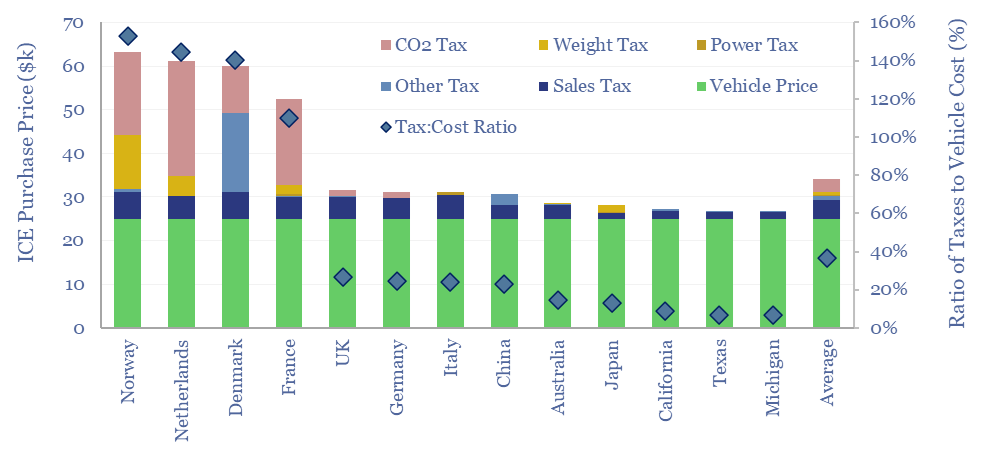
EV incentives: vehicle taxes by country?
Download
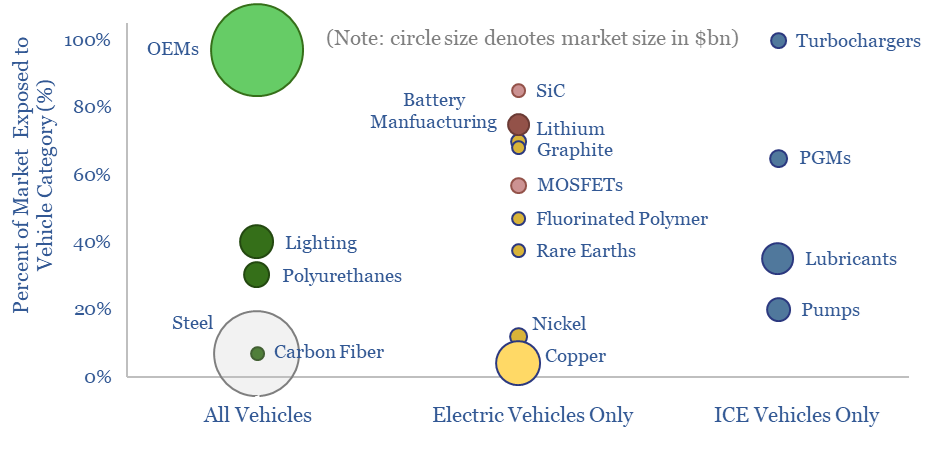
Mapping vehicle value chains?
Download
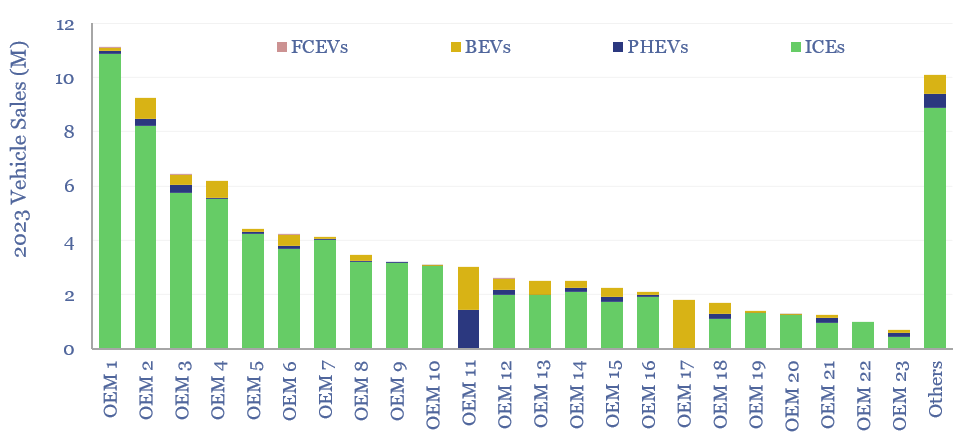
Global vehicle sales by manufacturer?
Download
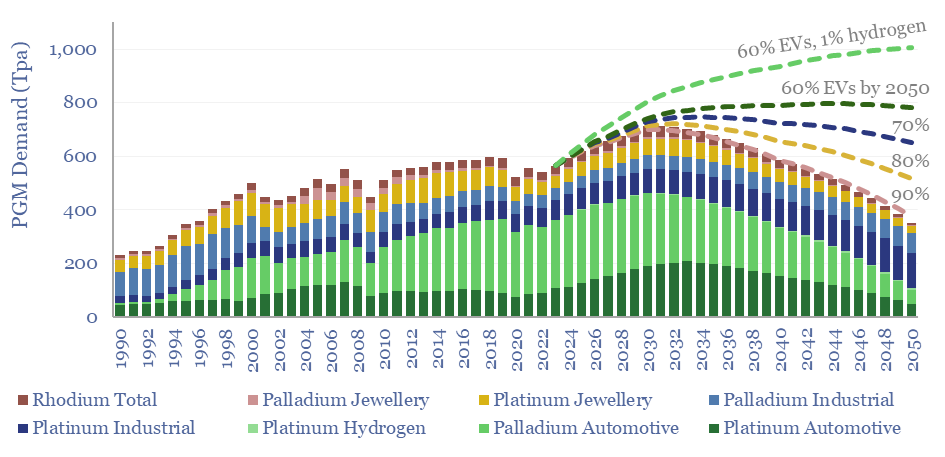
Going platinum: PGMs in energy transition?
Download
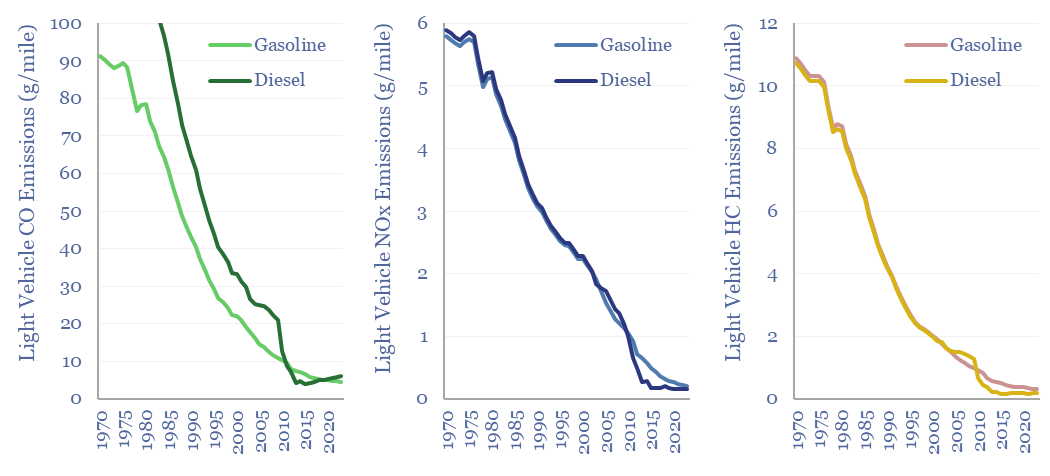
Vehicle emissions of CO, NOx and HCs?
Download
Electric vehicles: the road to cost parity?
Download
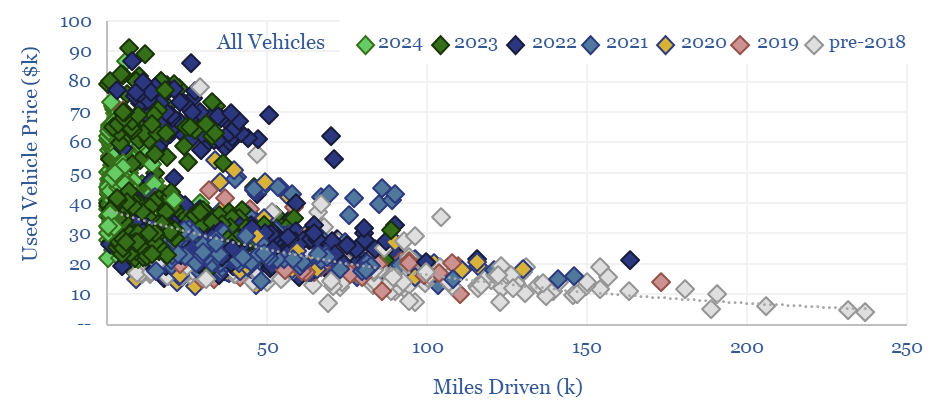
Vehicle depreciation rates: EVs versus ICEs?
Download
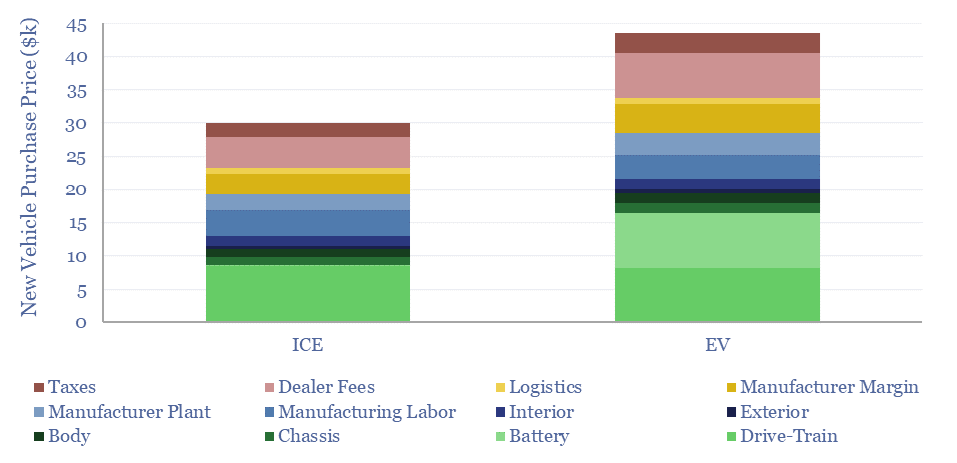
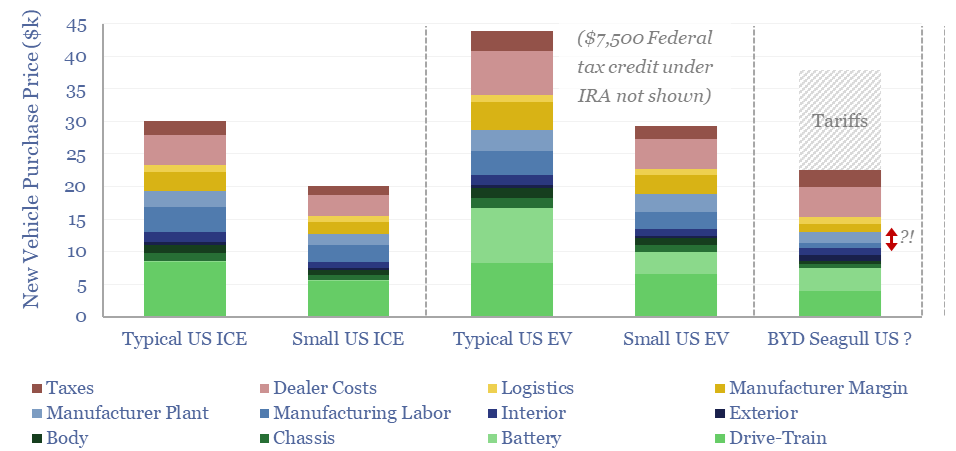
Electric vehicle cost breakdown by component?
Download
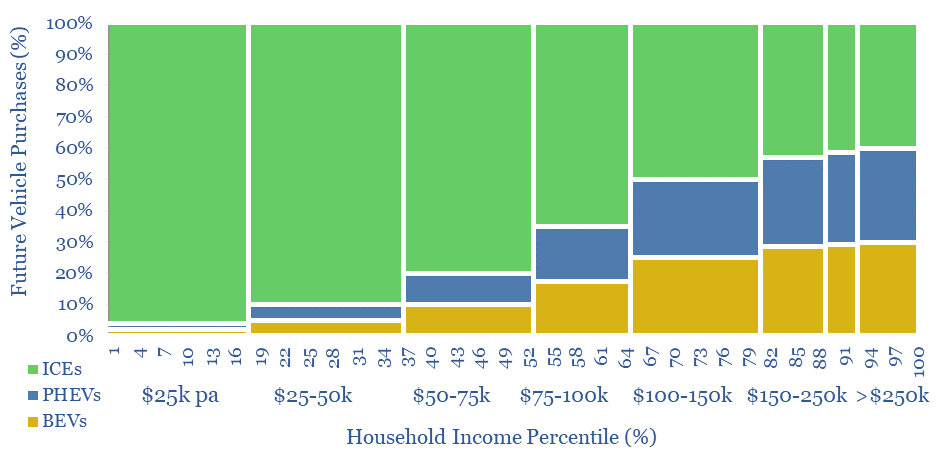
Electric vehicles: saturation point?
Download
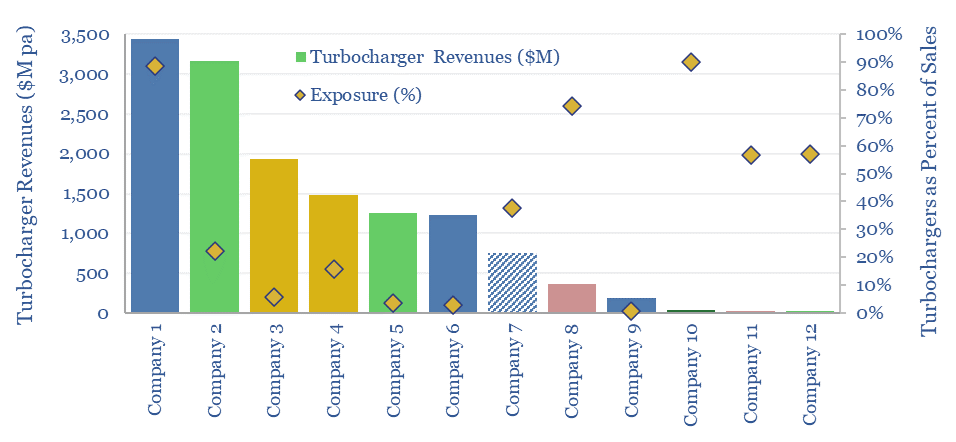
Turbochargers: leading companies?
Download
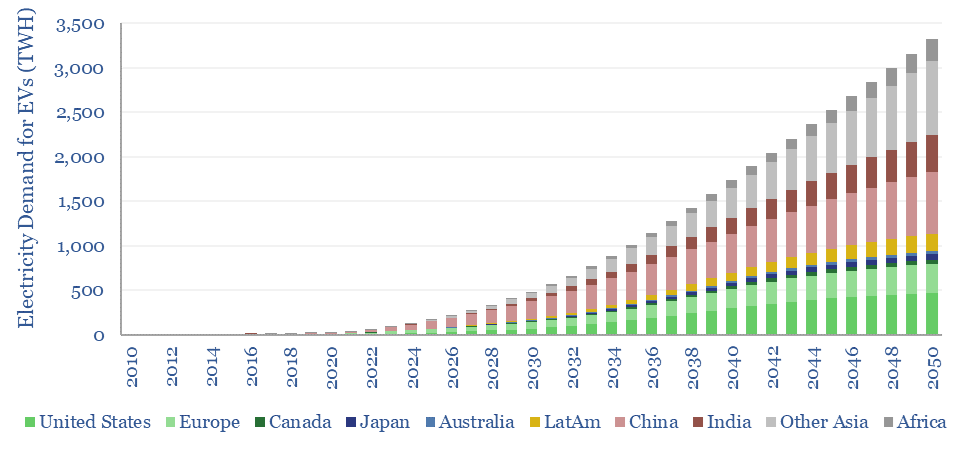
Electricity demand for electric vehicles?
Download
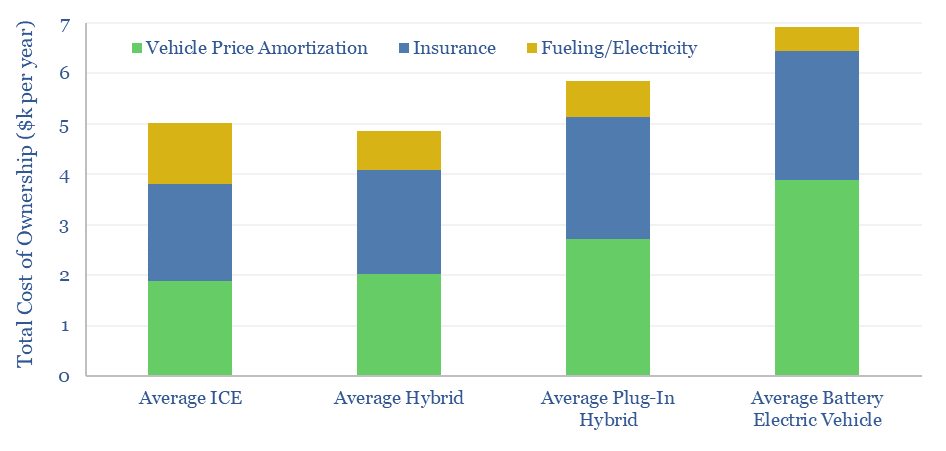
Electric vehicles: total cost of ownership?
Download
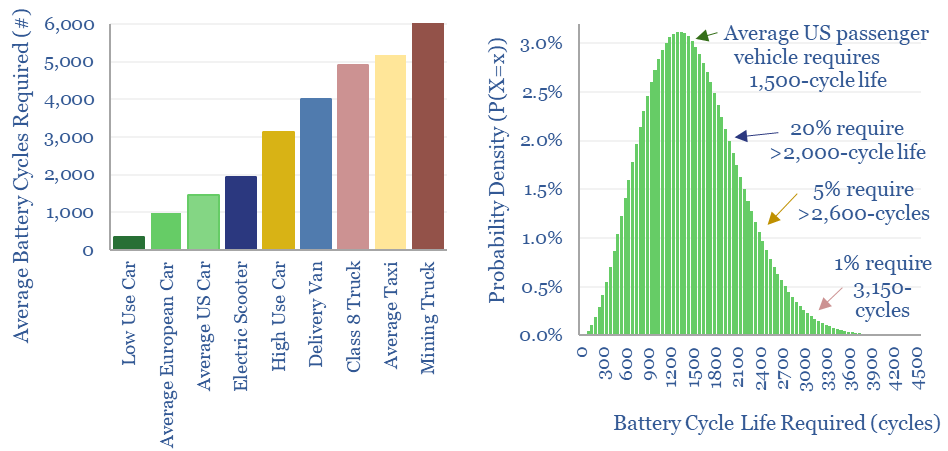
Electric vehicle: battery life?
Download
Electric vehicles: breaking the ICE?
Download
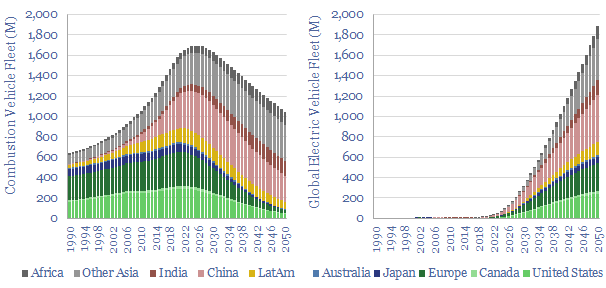
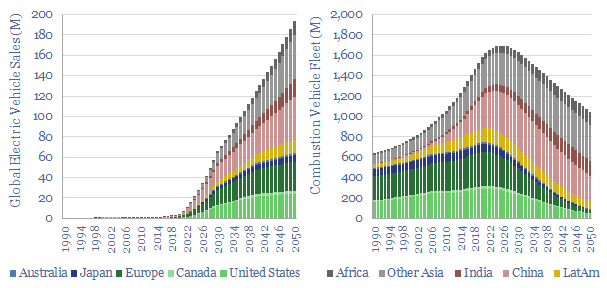
Global vehicle fleet: vehicle sales and electrification by region?
Download
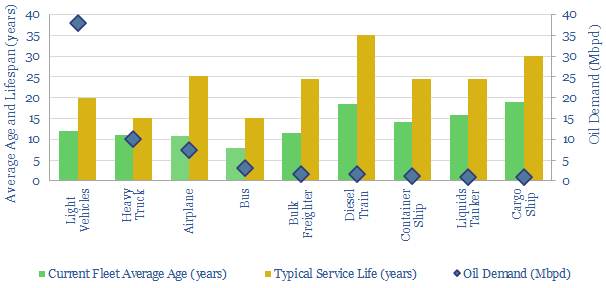
Vehicle fleets: service life and retirement age by vehicle type?
Download
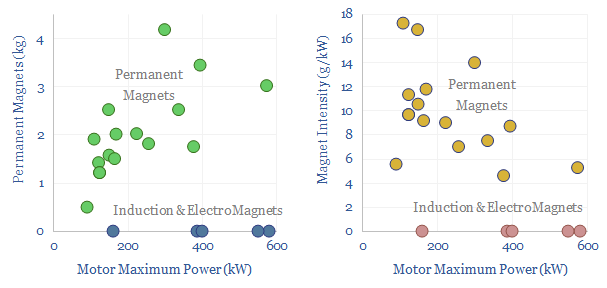
Electric vehicles: motors and magnets?
Download
Bulk shipping: cost breakdown?
Download
Commercial aviation: fuel economy of planes?
Download
Offshore vessels: fuel consumption?
Download
Hillcrest: ZVS inverter breakthrough?
Download
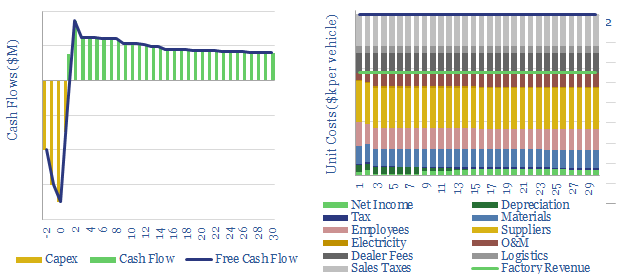
Auto manufacturing: the economics?
Download
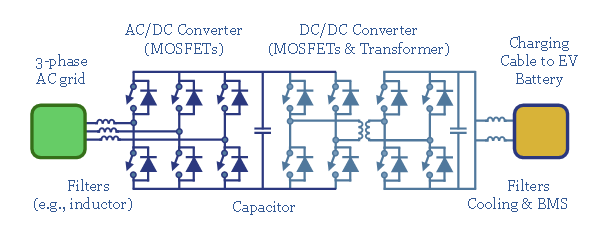
EV fast charging: opening the electric floodgates?
Download
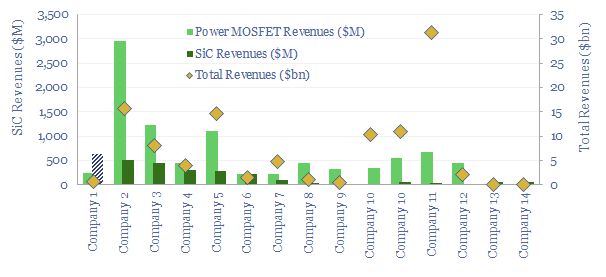
Power-MOSFETs: leading companies?
Download
Electric vehicles: chargers of the light brigade?
Download
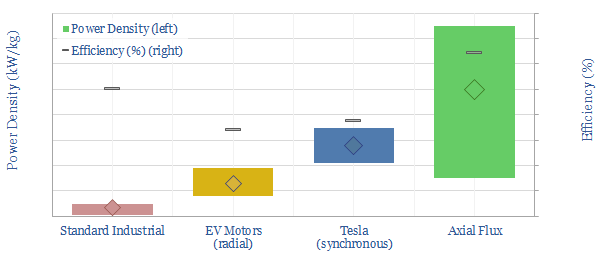
Electric motors: state of flux?
Download
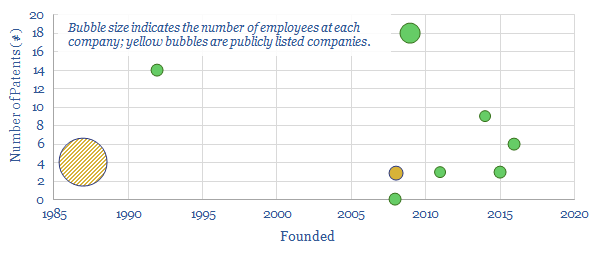
Axial flux motors: leading companies and products?
Download
Mine trucks: transport economics?
Download
LNG transport: shipping economics?
Download
Commercial aviation: air travel economics?
Download
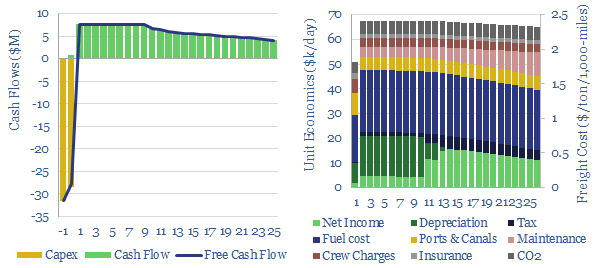
Container freight: shipping economics?
Download
ChargePoint: electric vehicle charging edge?
Download
Vehicle mass: what opportunities to improve fuel economy?
Download
Battery recycling: long division?
Download
Nio: EV-charging breakthrough?
Download
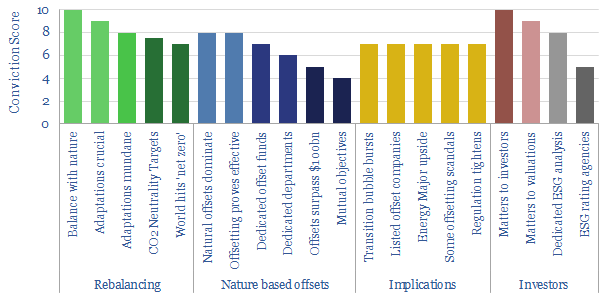
Nature Based Solutions
Nature based solutions to climate change?
Download
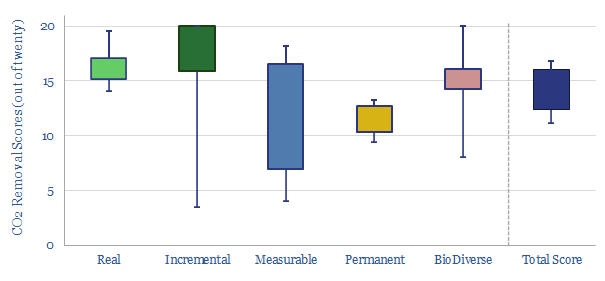
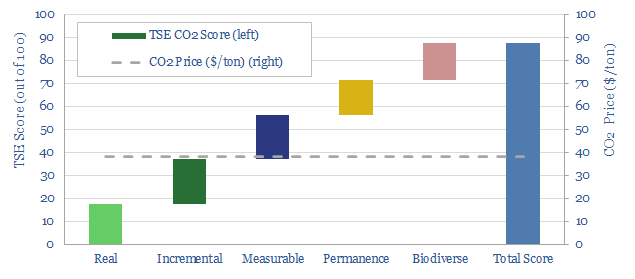
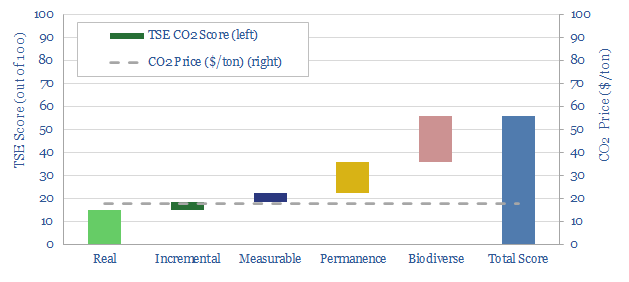
Nature-based CO2 removals: a summary?
Download
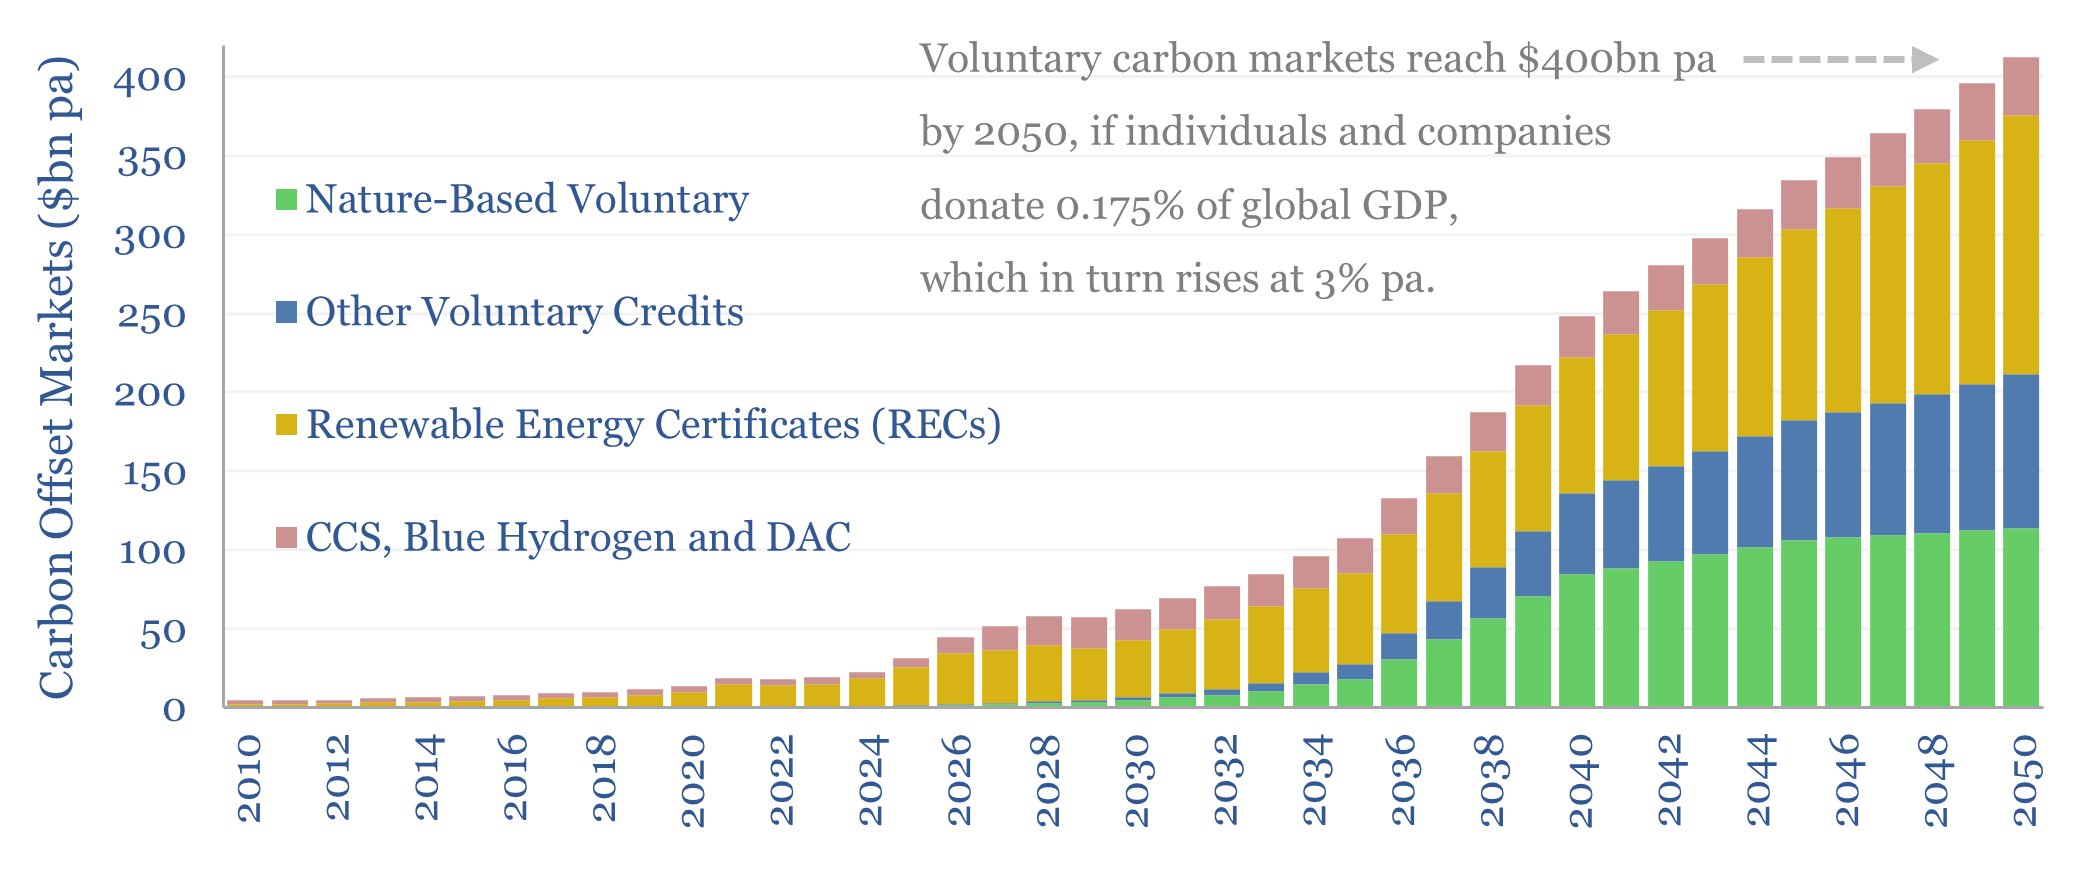
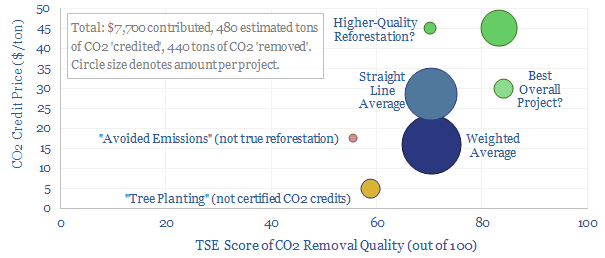
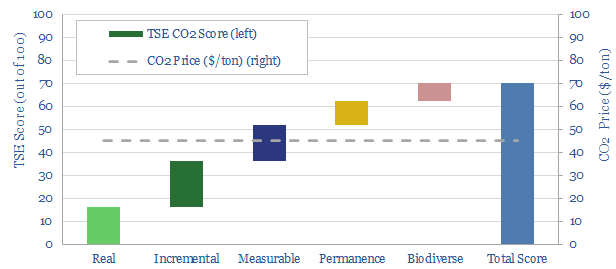
Carbon markets: charity case?
Download
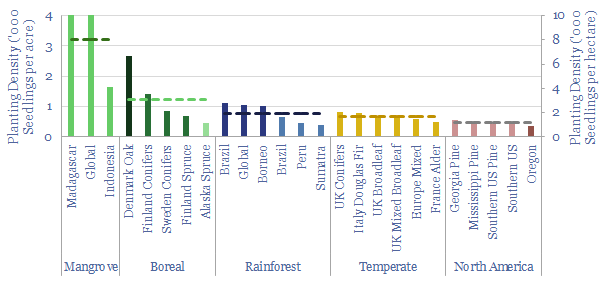
Reforestation: what planting density for seedlings?
Download
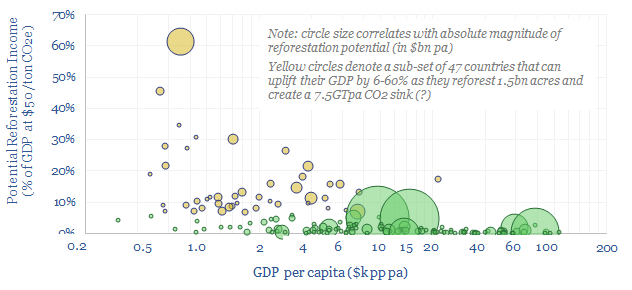
Growing economies: reforest and reinvest?
Download
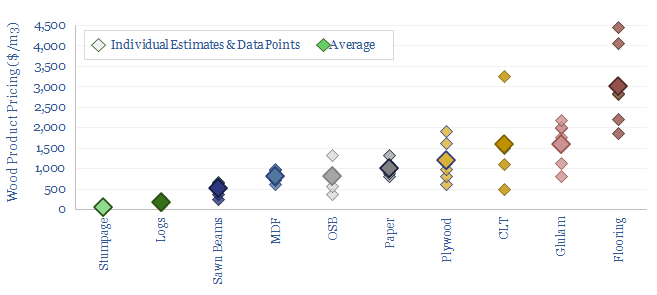
Wood products: typical pricing?
Download
CO2 removals: CO2OL Panama project?
Download
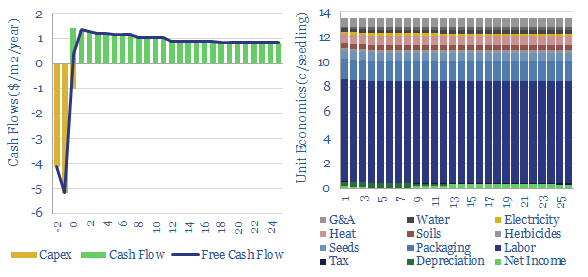
Tree seedlings: costs and economics?
Download
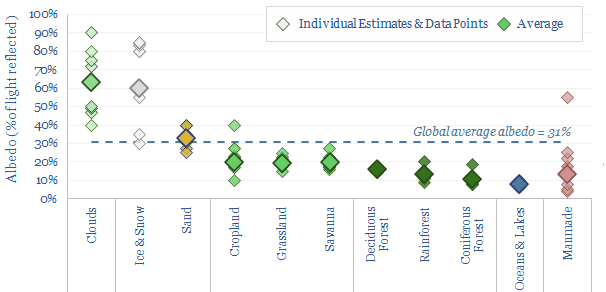
Albedo of different landscapes: a challenge for reforestation?
Download
Nature based solutions: CO2 removals in 2022?
Download
CO2 offsets: Pachama’s AI platform?
Download
Tigercat: forestry and timber innovations?
Download
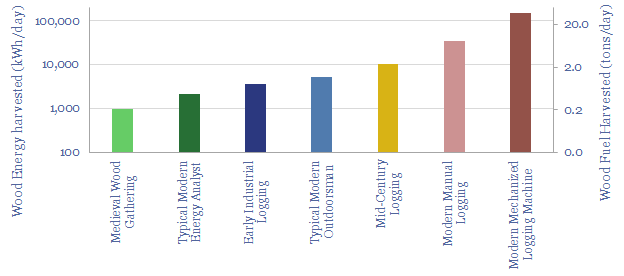
Energy history: how much wood can be cut in a day?
Download
CO2 removals: teak plantations, Nicaragua?
Download
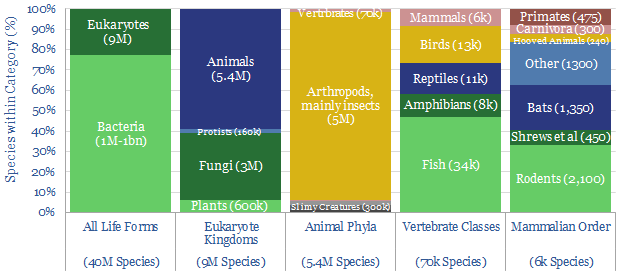
Biodiversity: a breakdown of species and carbon stocks?
Download
Carbon offsets: cost of CO2 removal per tree planted?
Download
CO2 Removals: BaumInvest Mixed Reforestation, Costa Rica?
Download
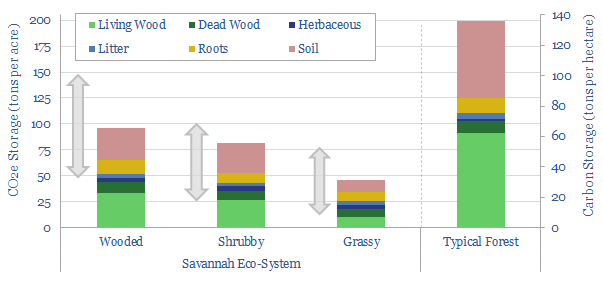
Savanna carbon: great plains?
Download
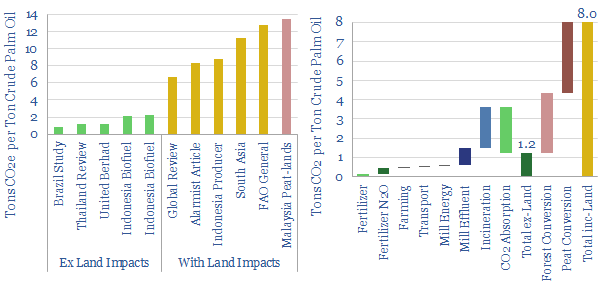
Palm oil: what CO2 intensity?
Download
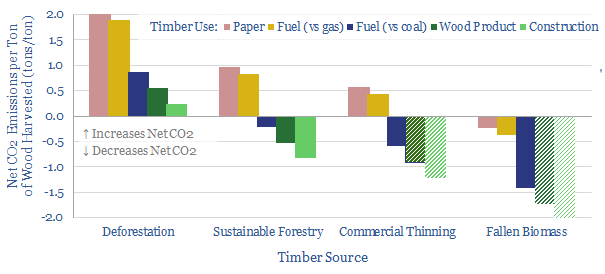
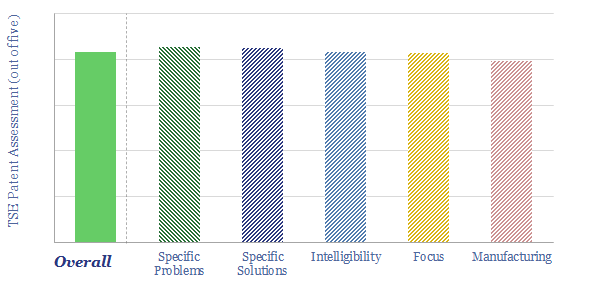
Wood use: what CO2 credentials?
Download
CO2 intensity of wood: context by context?
Download
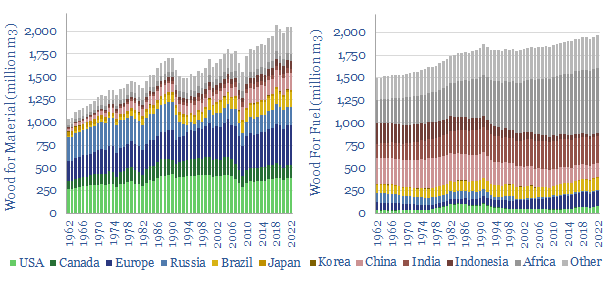
Global wood production: supply by country by year?
Download
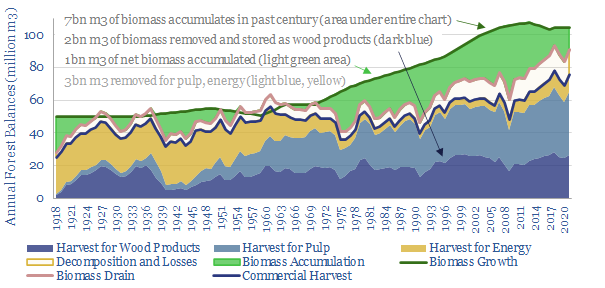
Finnish forests: a two billion ton CO2 case-study?
Download
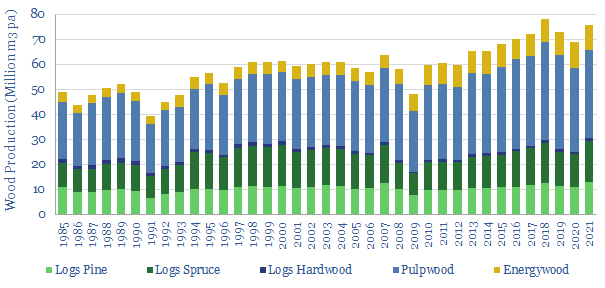
Finnish forests: trees, yields, costs, value?
Download
Reforestation: costs of CO2 removals?
Download
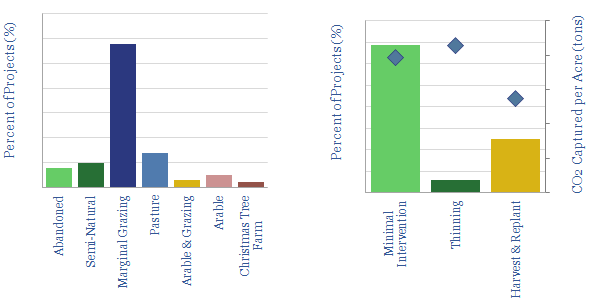
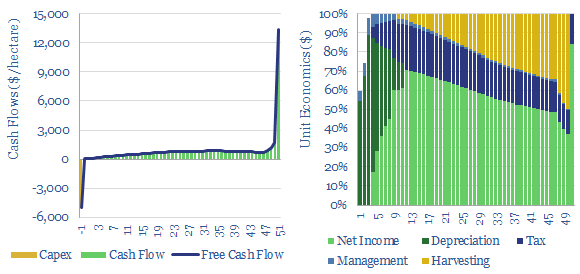
UK reforestation projects: 25 case studies?
Download
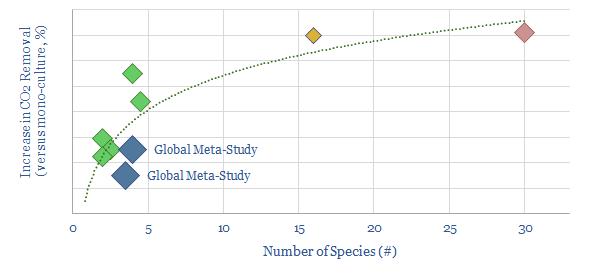
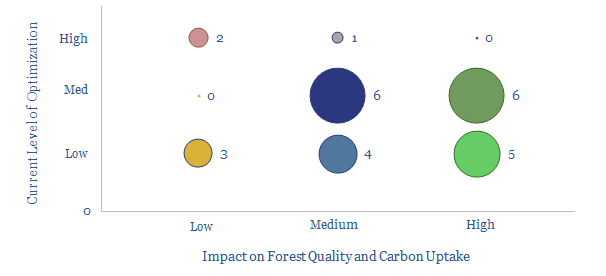
Biodiversity: impacts on forest CO2?
Download
Carbon neutral investing: hedge funds, forest funds?
Download
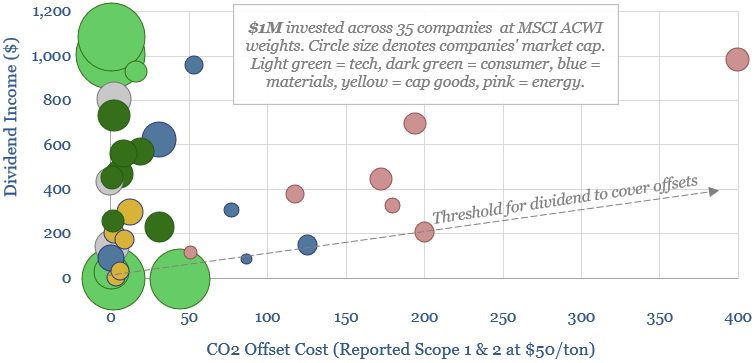
Carbon-offset equities’ Scope 1&2 CO2 emissions?
Download
Nature based CO2 removals: theory of evolution?
Download
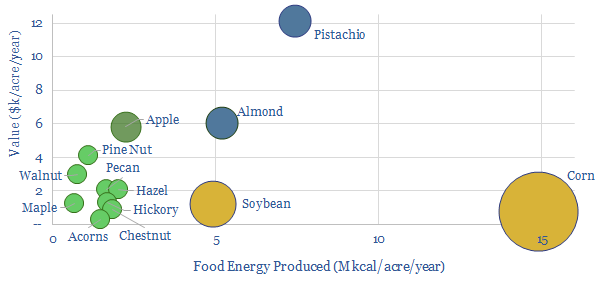
Tree crops: financial and agricultural yields?
Download
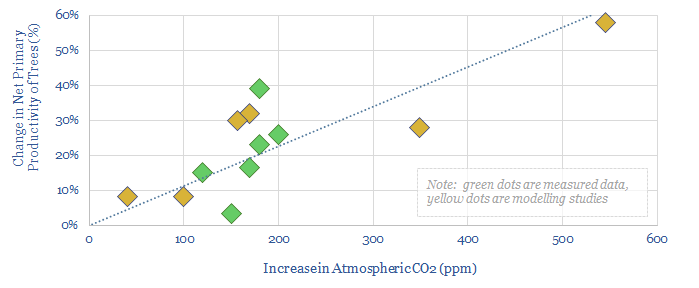
Photo opp: reforestation, CO2 fertilization and global temperatures?
Download
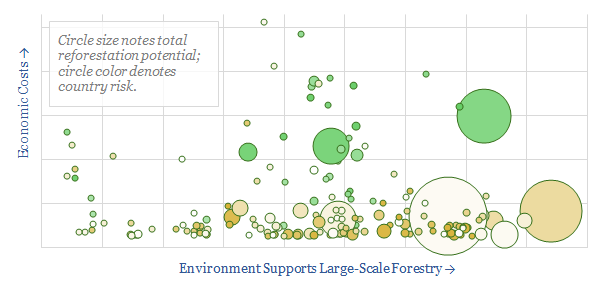
Global reforestation potential by country?
Download
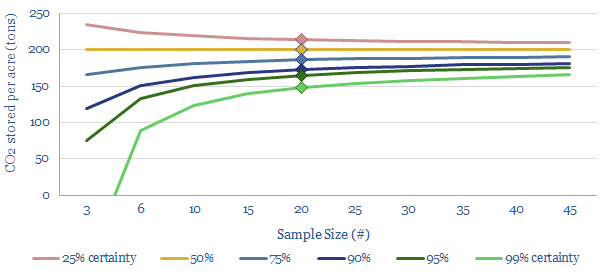
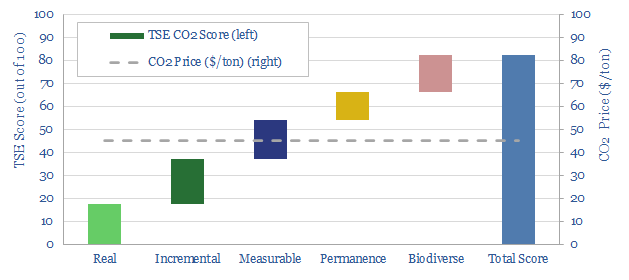
Carbon stocks: measuring the forest from the trees?
Download
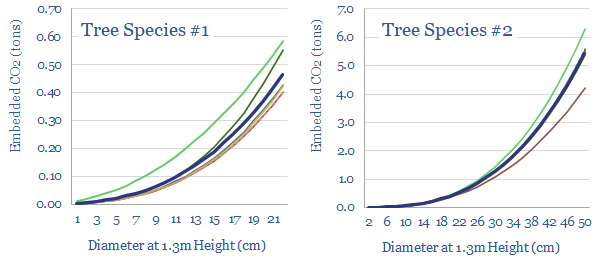
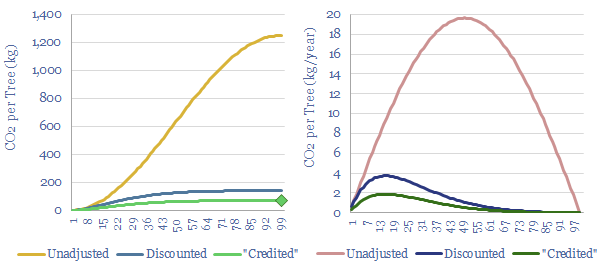
Allometry: how much CO2 in a tree or forest?
Download
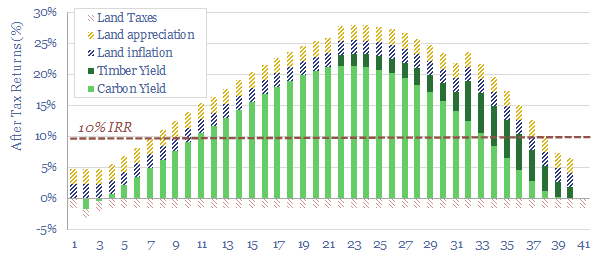
Reforestation: a real-life roadmap?
Download
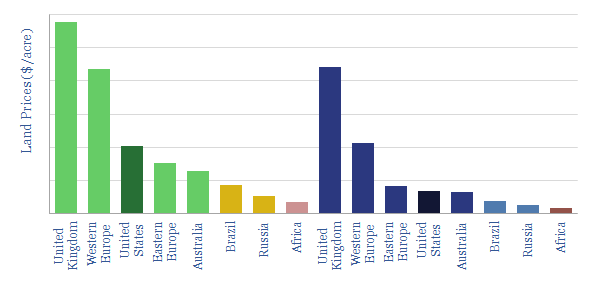
Land prices: an overview for renewables and reforestation?
Download
Carbon offset funds: the future of ESG?
Download
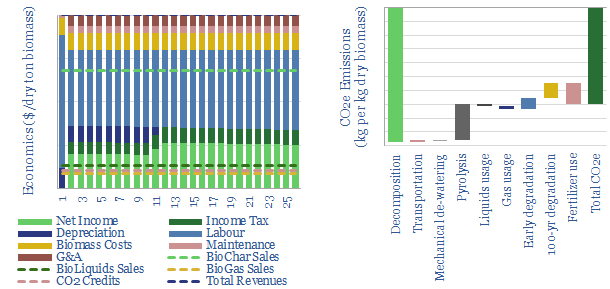
Biochar: burnt offerings?
Download
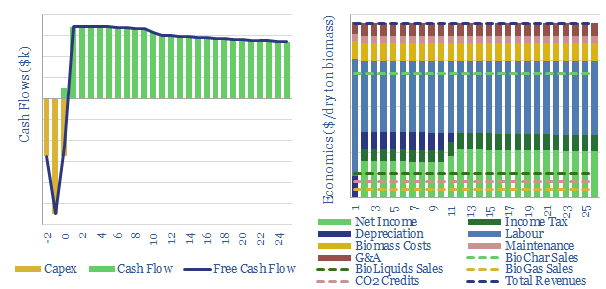
Biomass to biochar: the economics?
Download