What is the Scope 1&2 CO2 intensity of natural gas value chains? In this data-file, we have constructed a simple model to estimate the CO2 emissions of commercialising natural gas, as a function of eight input variables: such as production techniques, methane leakage, sour gas processing, LNG liquefaction, LNG tanker distances and pipeline distances.
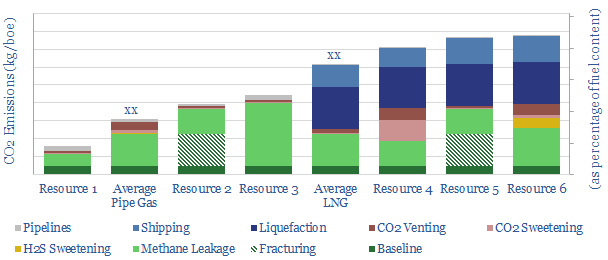
Scope 1 & 2 CO2 intensity of natural gas averages c25kg/boe for conventional piped gas, and c50kg/boe for LNG. In mcf terms, this is equivalent to around 4 kg/mcf for piped gas and around 8 kg/mcf for LNG value chains. Precise numbers vary project by project.
Scope 3 CO2 intensity adds on top of Scope 1 & 2 CO2 intensity, in order to yield a full-cycle CO2 intensity factor. Scope 3 CO2 is best estimated at 56 kg/mcf, based on bond enthalpies.
Energy return on energy invested is c20x across piped gas resources and c10x across LNG resources, compared with c7-10x for oil. This supports the rationale for oil-to-gas switching, as commercialising gas will likely emit 0-80% lower CO2 per boe; plus 15-20% lower combustion emissions.
Different resources are compared using our methodology. The lowest CO2 profile is seen for well-managed piped gas (e.g., Norway to Europe). Actual data on US LNG facilities and methane intensities have been added.
Further TSE research assesses decarbonization options such as minimizing methane leaks, and reducing the CO2 intensity of gas and LNG, including via CCS, blue hydrogen and nature-based CO2 removals.
Download the model and you can quickly compute the CO2 intensity of natural gas, including the emissions profiles of other resources.