Materials
-
Energy economics: an overview?
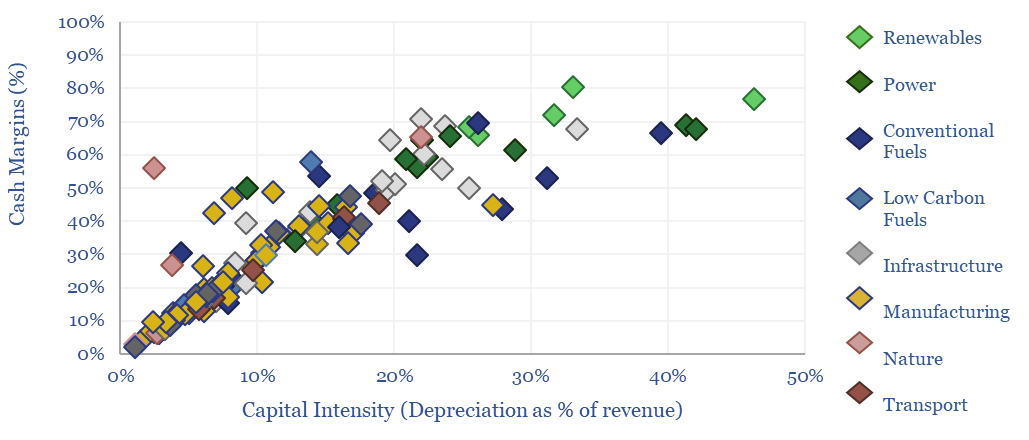
This data-file provides an overview of energy economics, across 175 different economic models constructed by Thunder Said Energy, in order to put numbers in context. This helps to compare marginal costs, capex costs, energy intensity, interest rate sensitivity, and other key parameters that matter in the energy transition.
-
Commodity prices: metals, materials and chemicals?
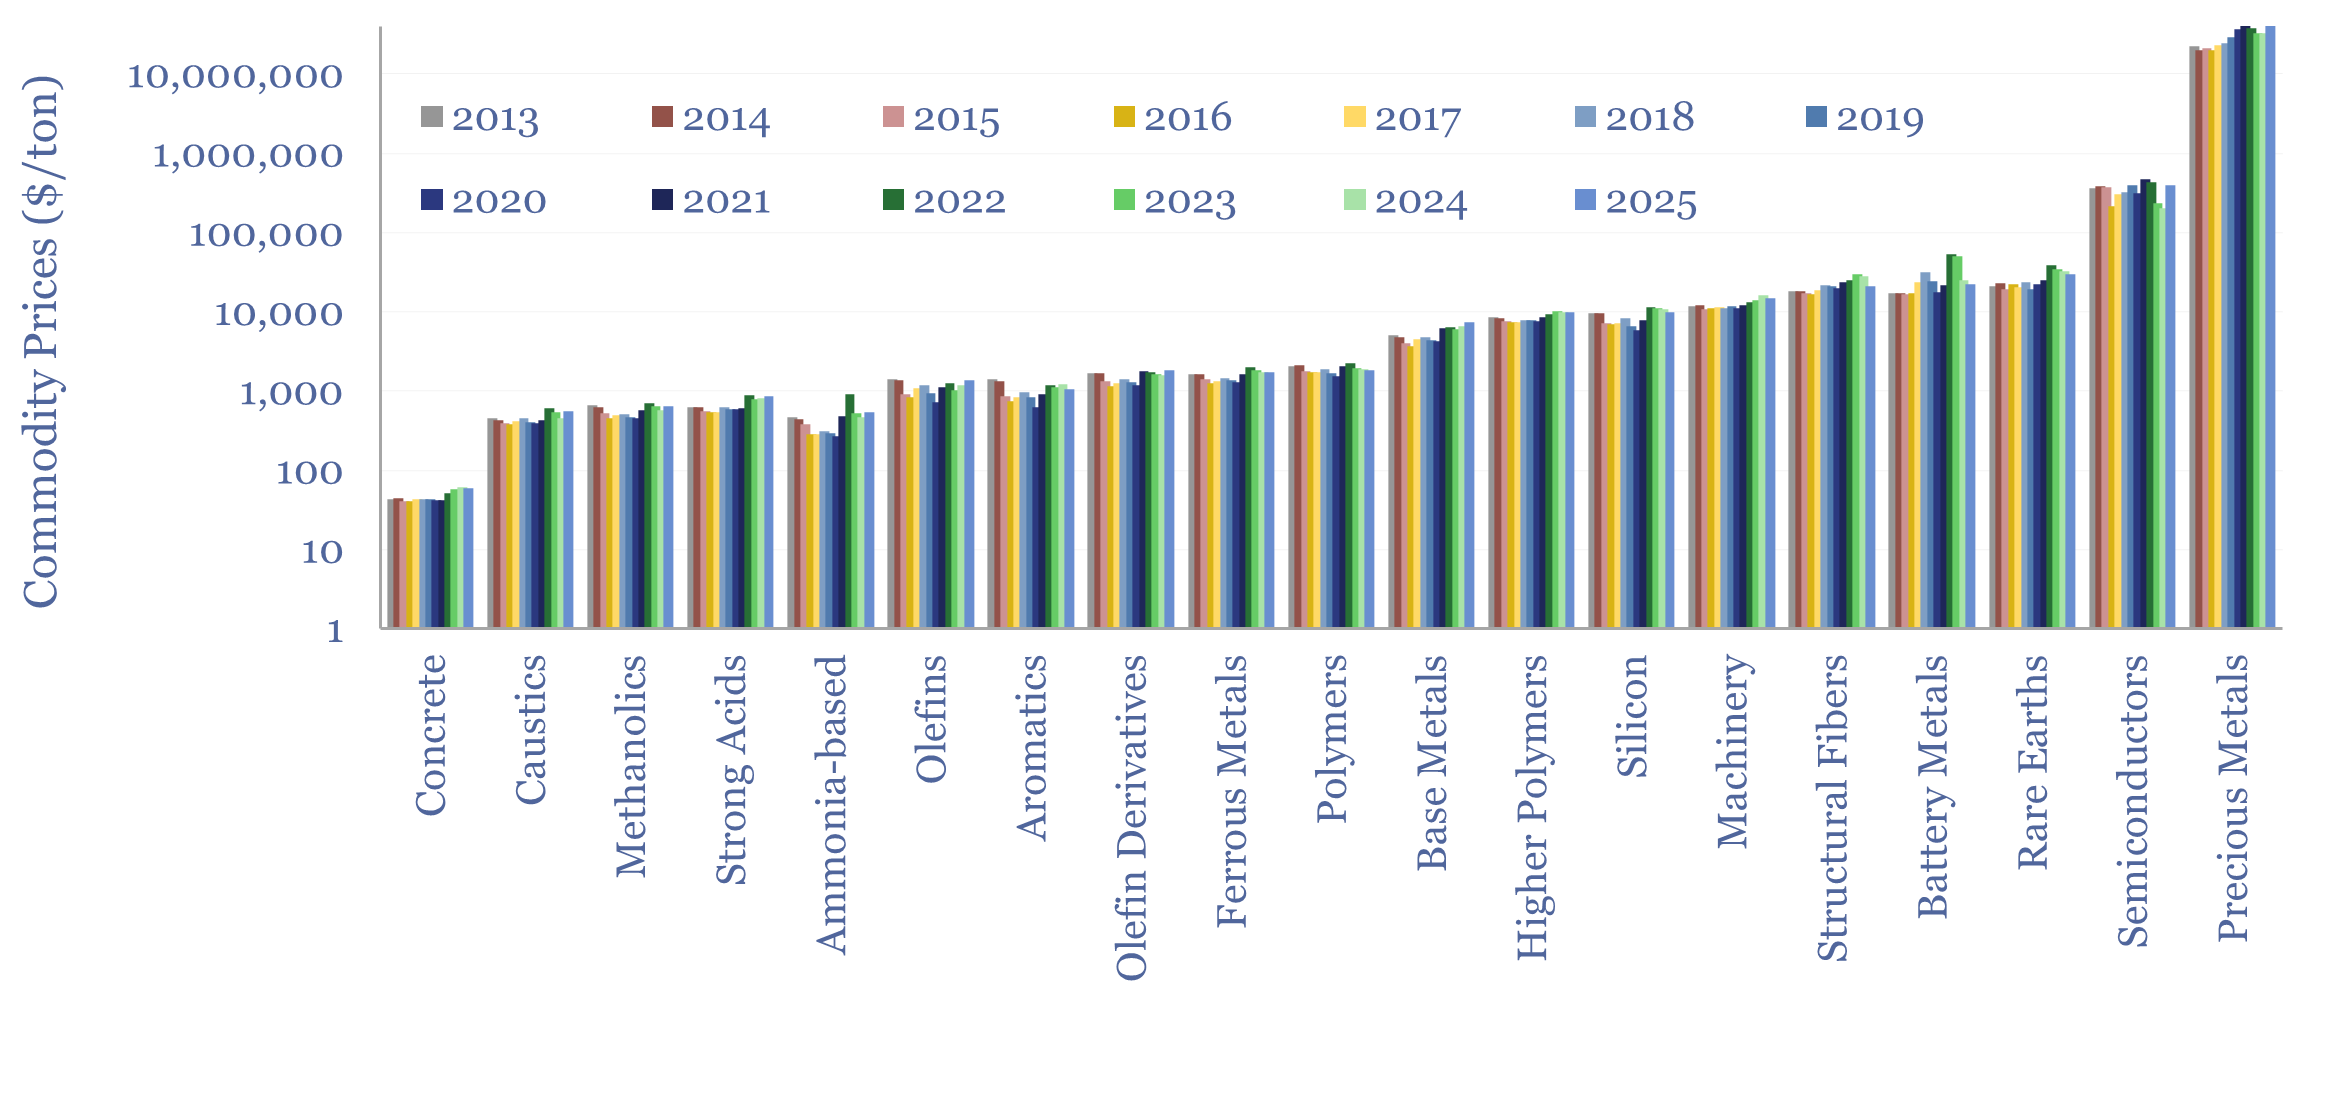
Annual commodity prices are tabulated in this database for 70 material commodities, as a useful reference file; covering steel prices, other metal prices, chemicals prices, polymer prices, with data going back to 2012, all compared in $/ton. We have updated the data-file for 2025 data in April-2026.
-
AI for materials development: case studies?
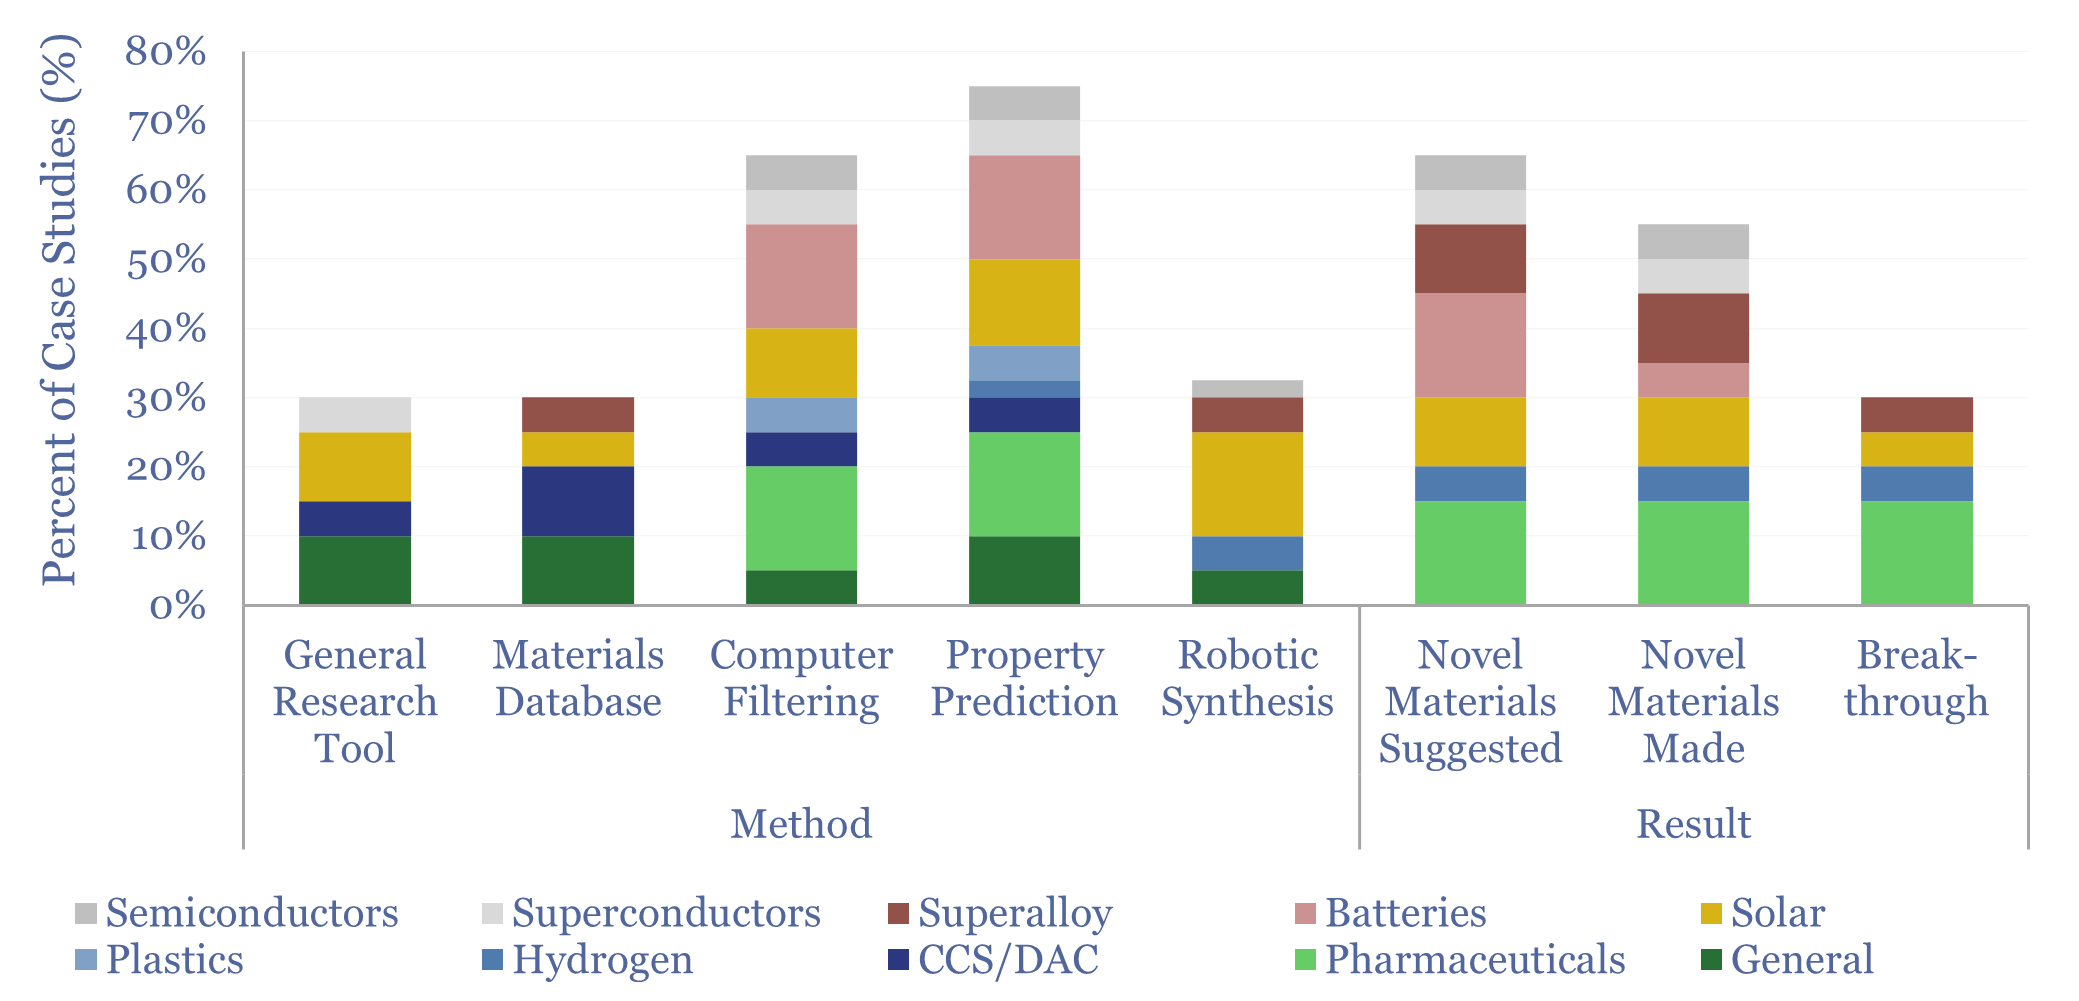
How is AI affecting materials development? This Excel data-file tabulates 20 recent case studies, across pharmaceuticals, solar, batteries, CCS, plastics, semiconductors, superalloys and superconductors. We conclude AI is a step-change for improved materials development, it is happening now and it is commercially relevant.
-
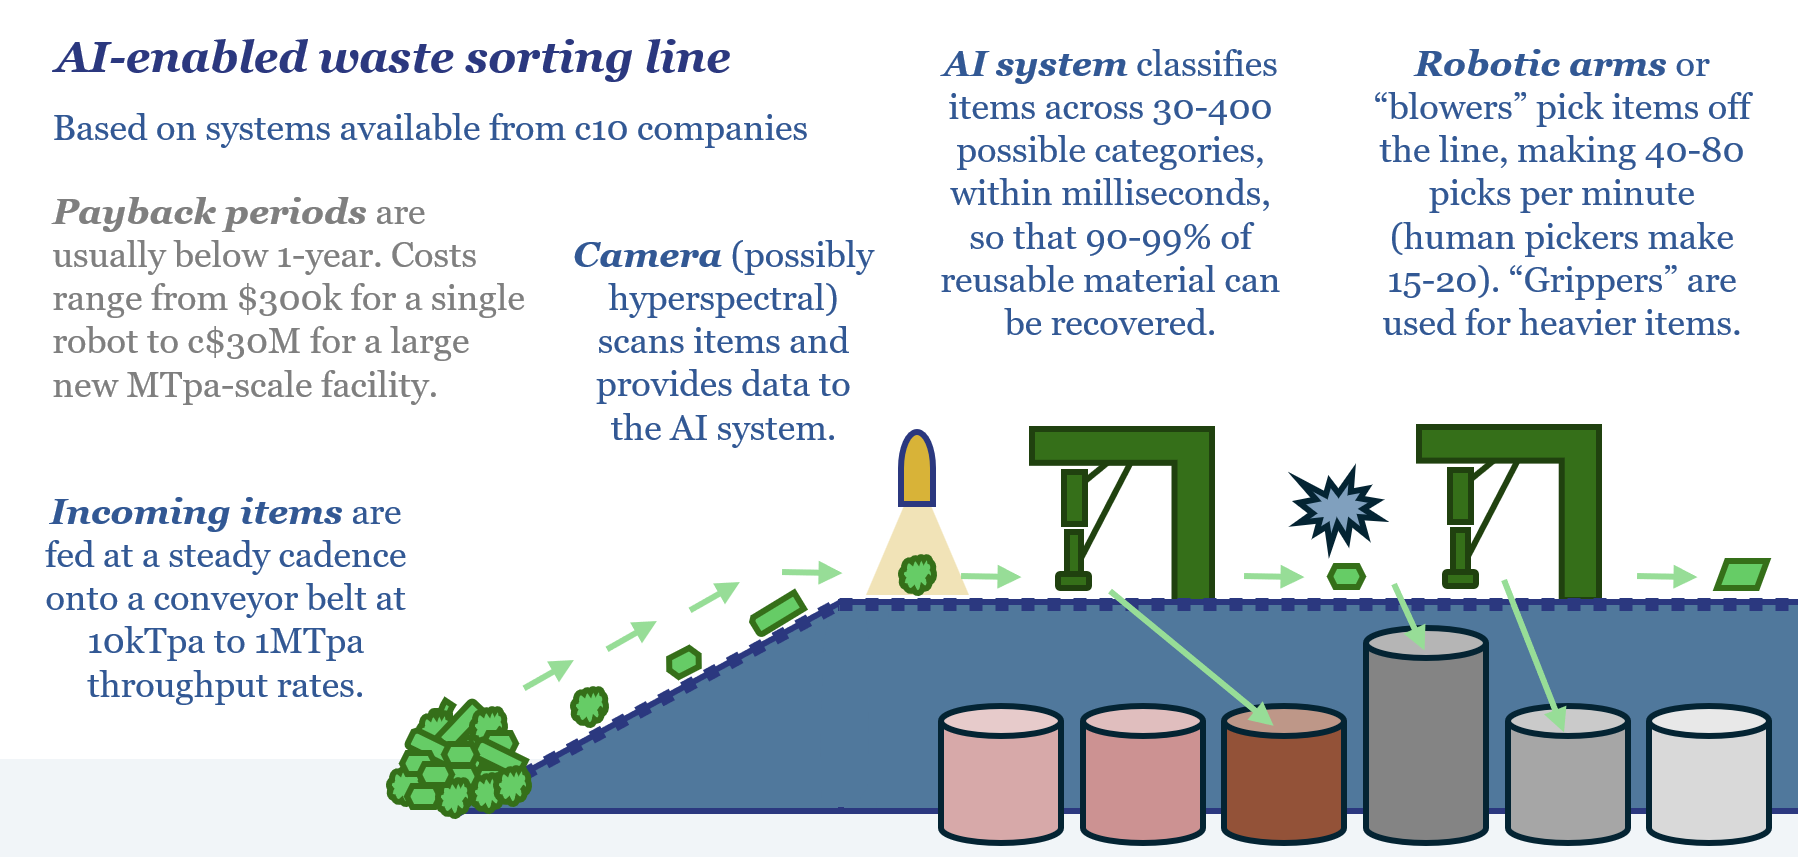
Circular economy: is AI a game changer?

10 companies have recently launched AI-enabled robotics to recover value from the world’s 2.3GTpa of solid waste. Picking rates are 4x faster than humans. c1-year paybacks are quoted. Hence today’s 17-page report explores the implications for gas, power, metals, materials and oil markets, amidst a step-change in the circular economy.
-
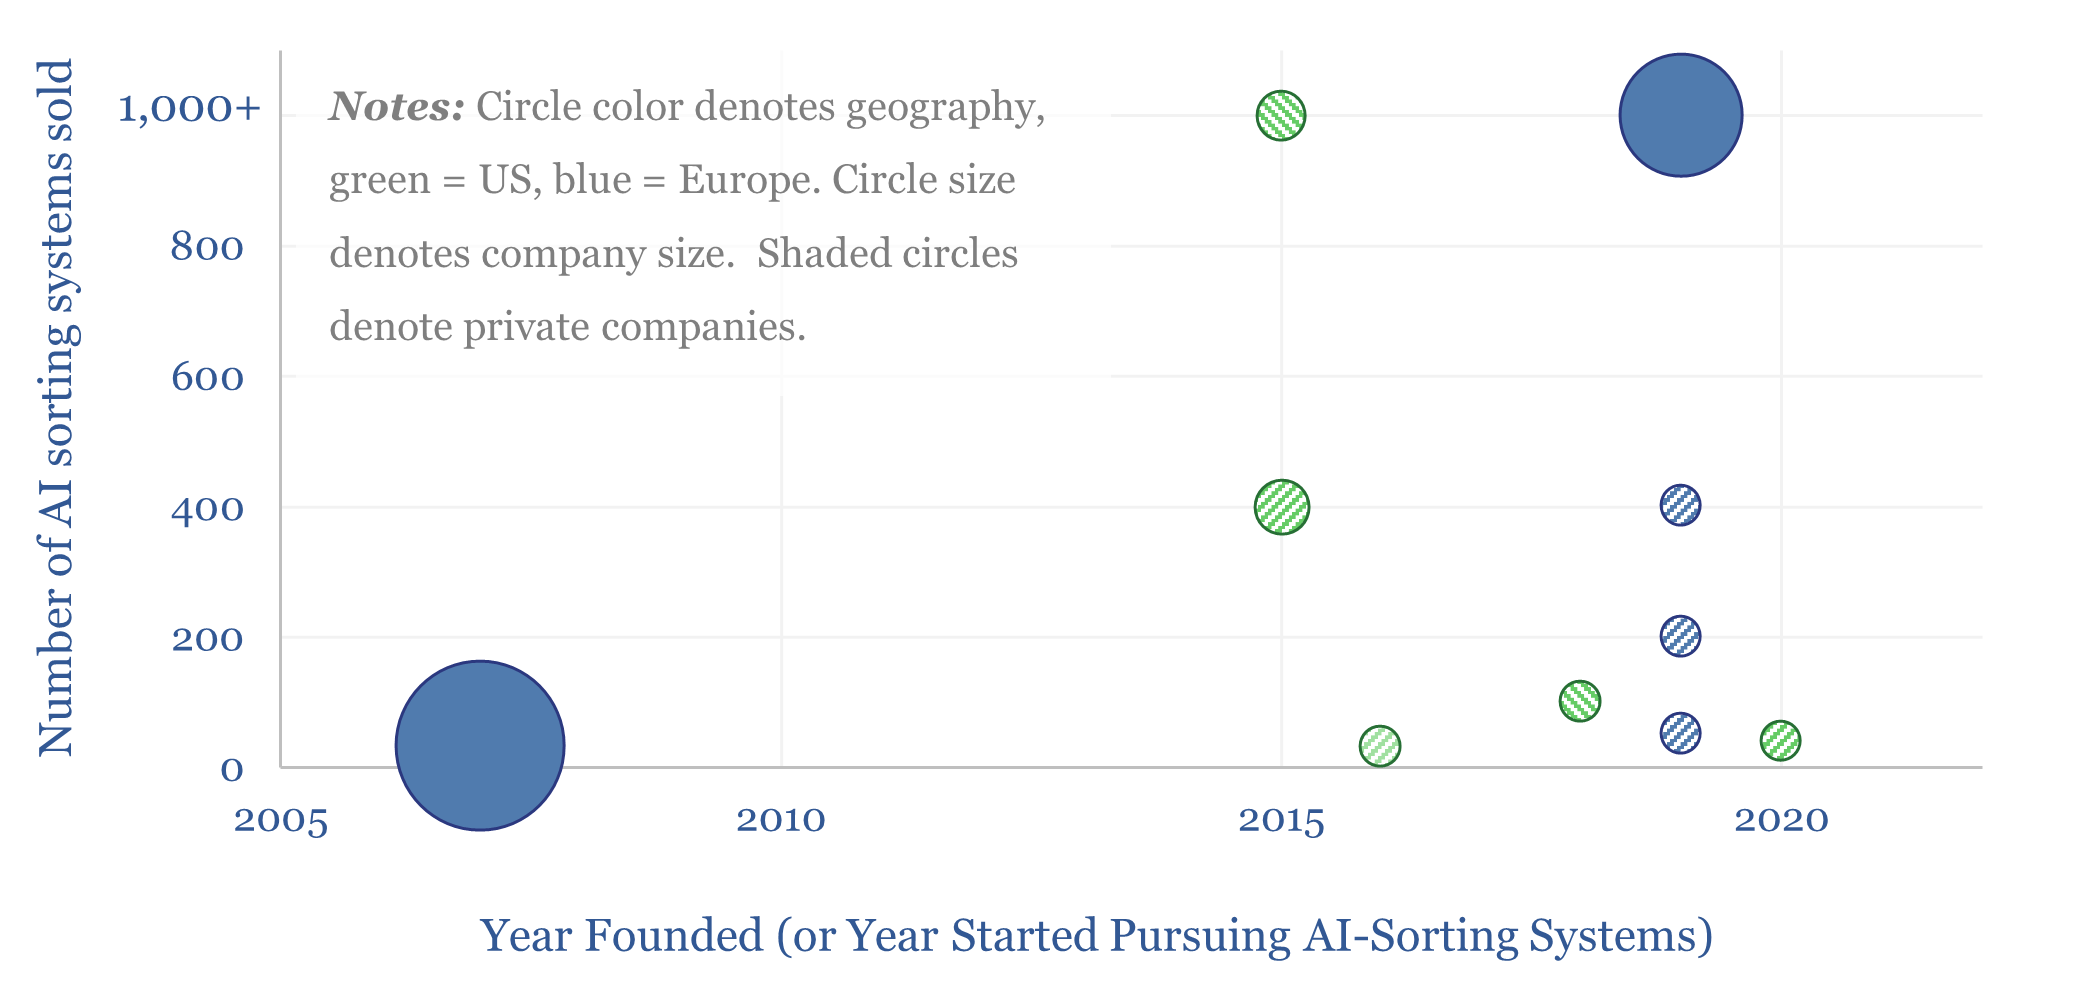
Circular economy: companies using AI for waste-sorting?

This data-file is a screen of companies using AI for waste-sorting, in order to separate out valuable recyclable materials, from the world’s 2.3 GTpa of solid municipal waste. Ten companies, mostly founded in the past decade, are now at an inflection point and seem to be scaling up rapidly.
-
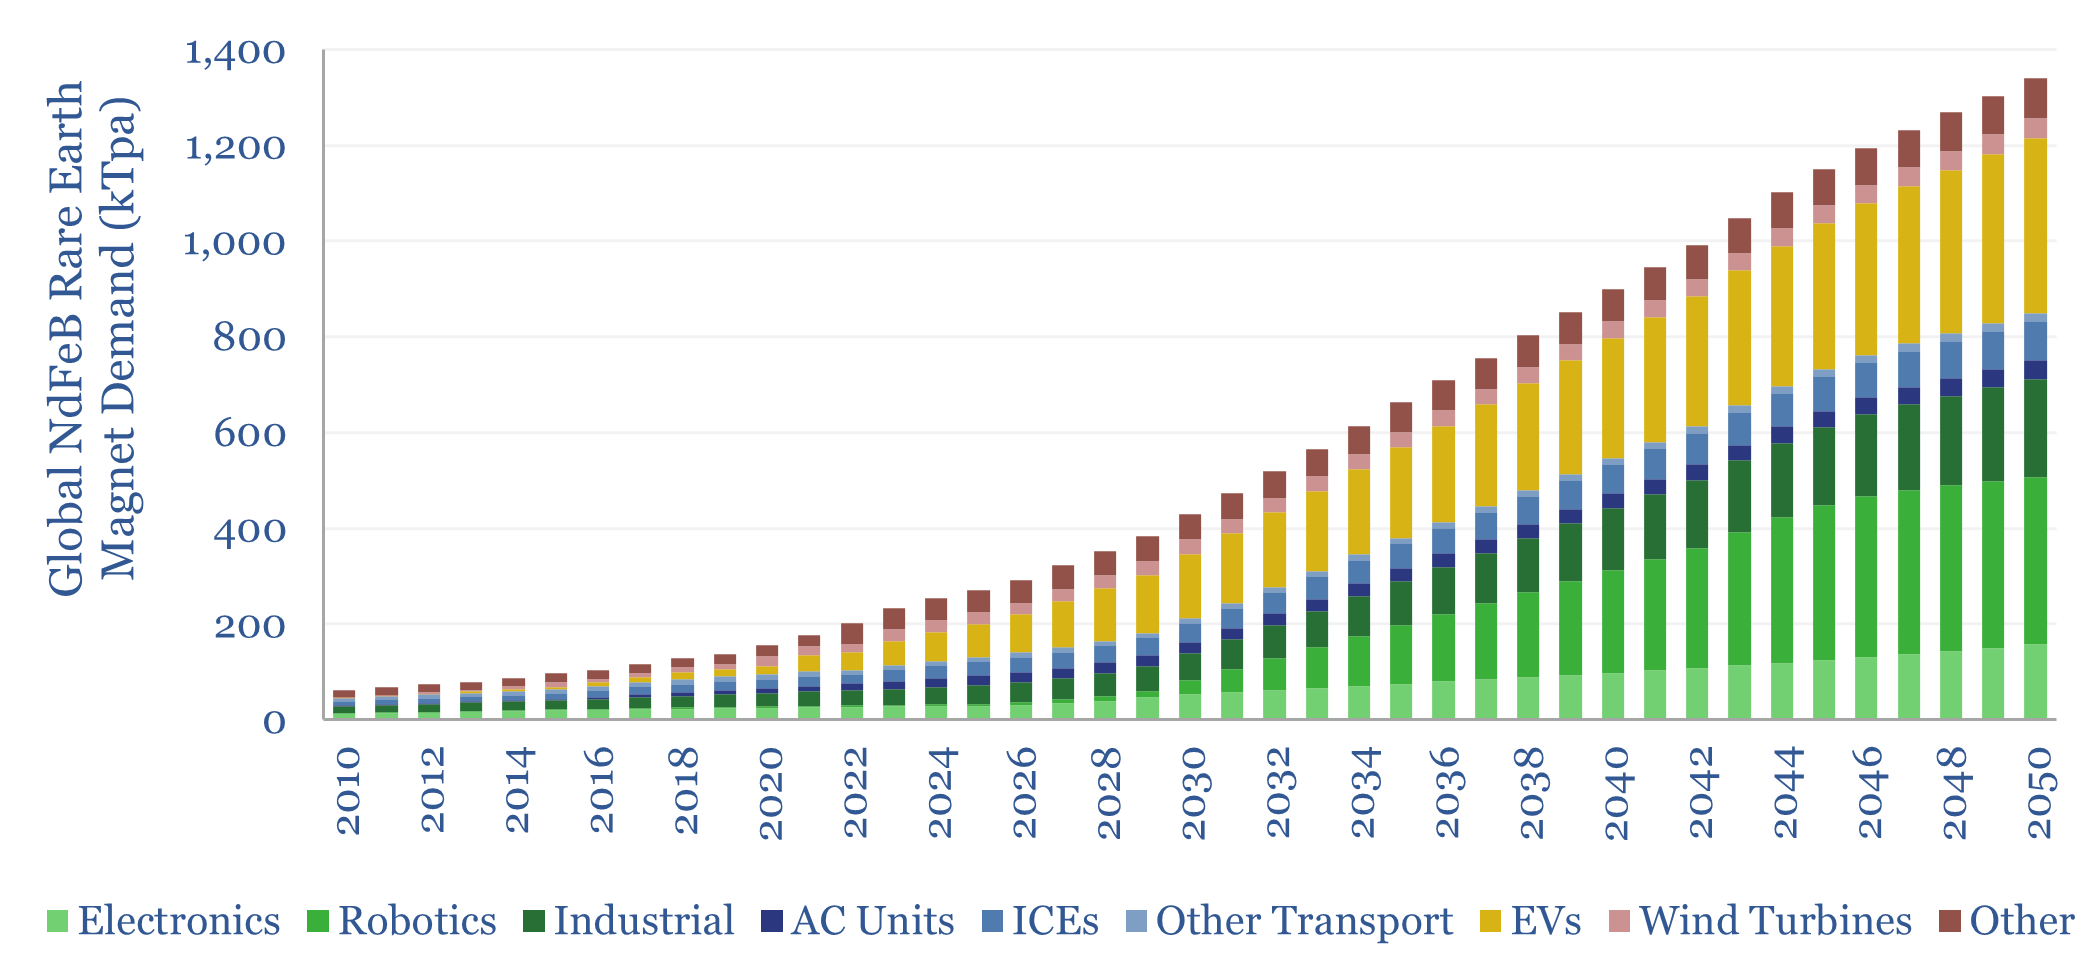
Rare Earth magnets: building attraction?

Will Rare Earth magnets shift from being commoditized and mostly Chinese-made, to a higher-value market, sustaining a moat for leading Western companies? Especially as demand inflects in the AI era? Our answers in this 14-page report are based on a site visit to Europe’s first large-scale Rare Earth magnet plant, and subsequent economic modeling.
-
Helium production: the economics?

This economic model captures the production costs of helium, which is cryogenically extracted from low concentrations in natural gas. $200/mcf helium prices can support 10% IRRs on a resource with 2% helium content. $400-1,000/mcf spot prices can unlock 50-100% IRRs and trigger a capex boom. Economics can be stress-tested in this data-file.
-
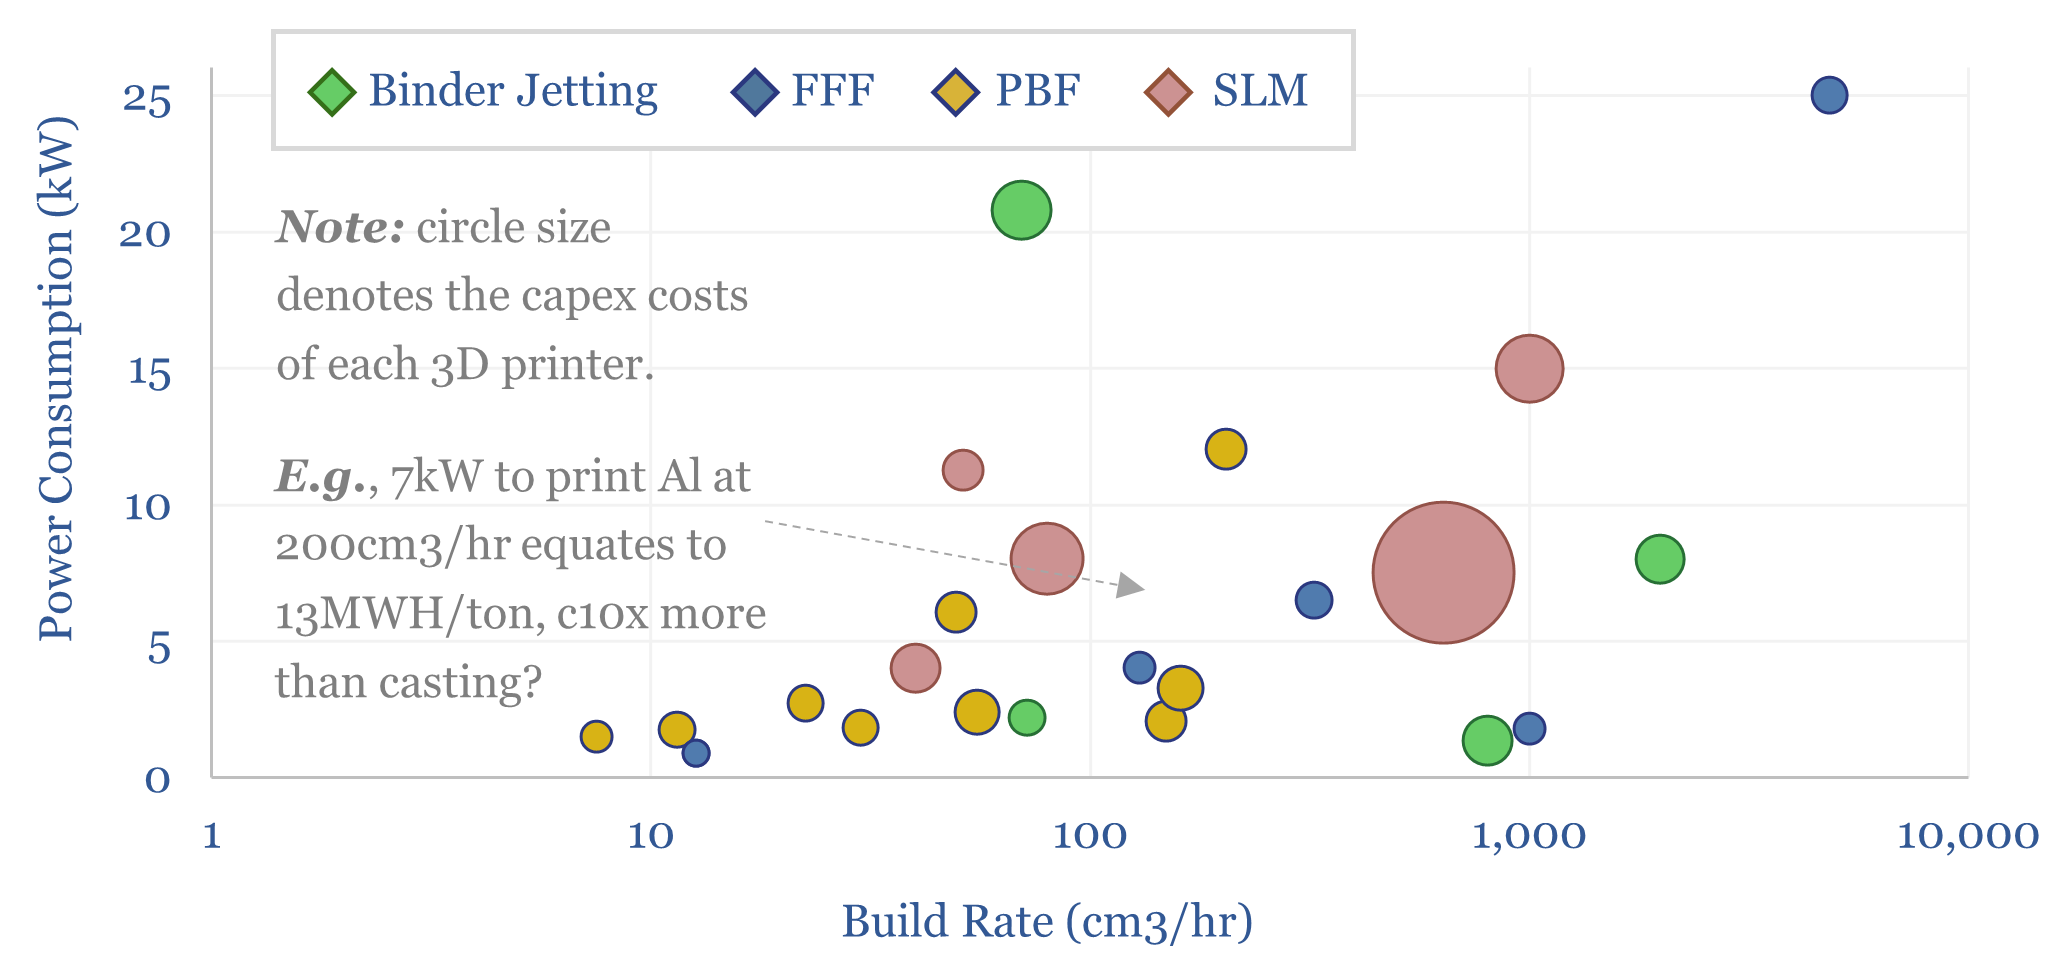
Additive manufacturing: fine print?

Can additive manufacturing overcome bottlenecks in gas turbine components, aerospace-related capital goods, and custom products that are unlocked by AI? This 16-page report re-evaluates the outlook for 3D printing, its economics, energy use, and company implications.
-
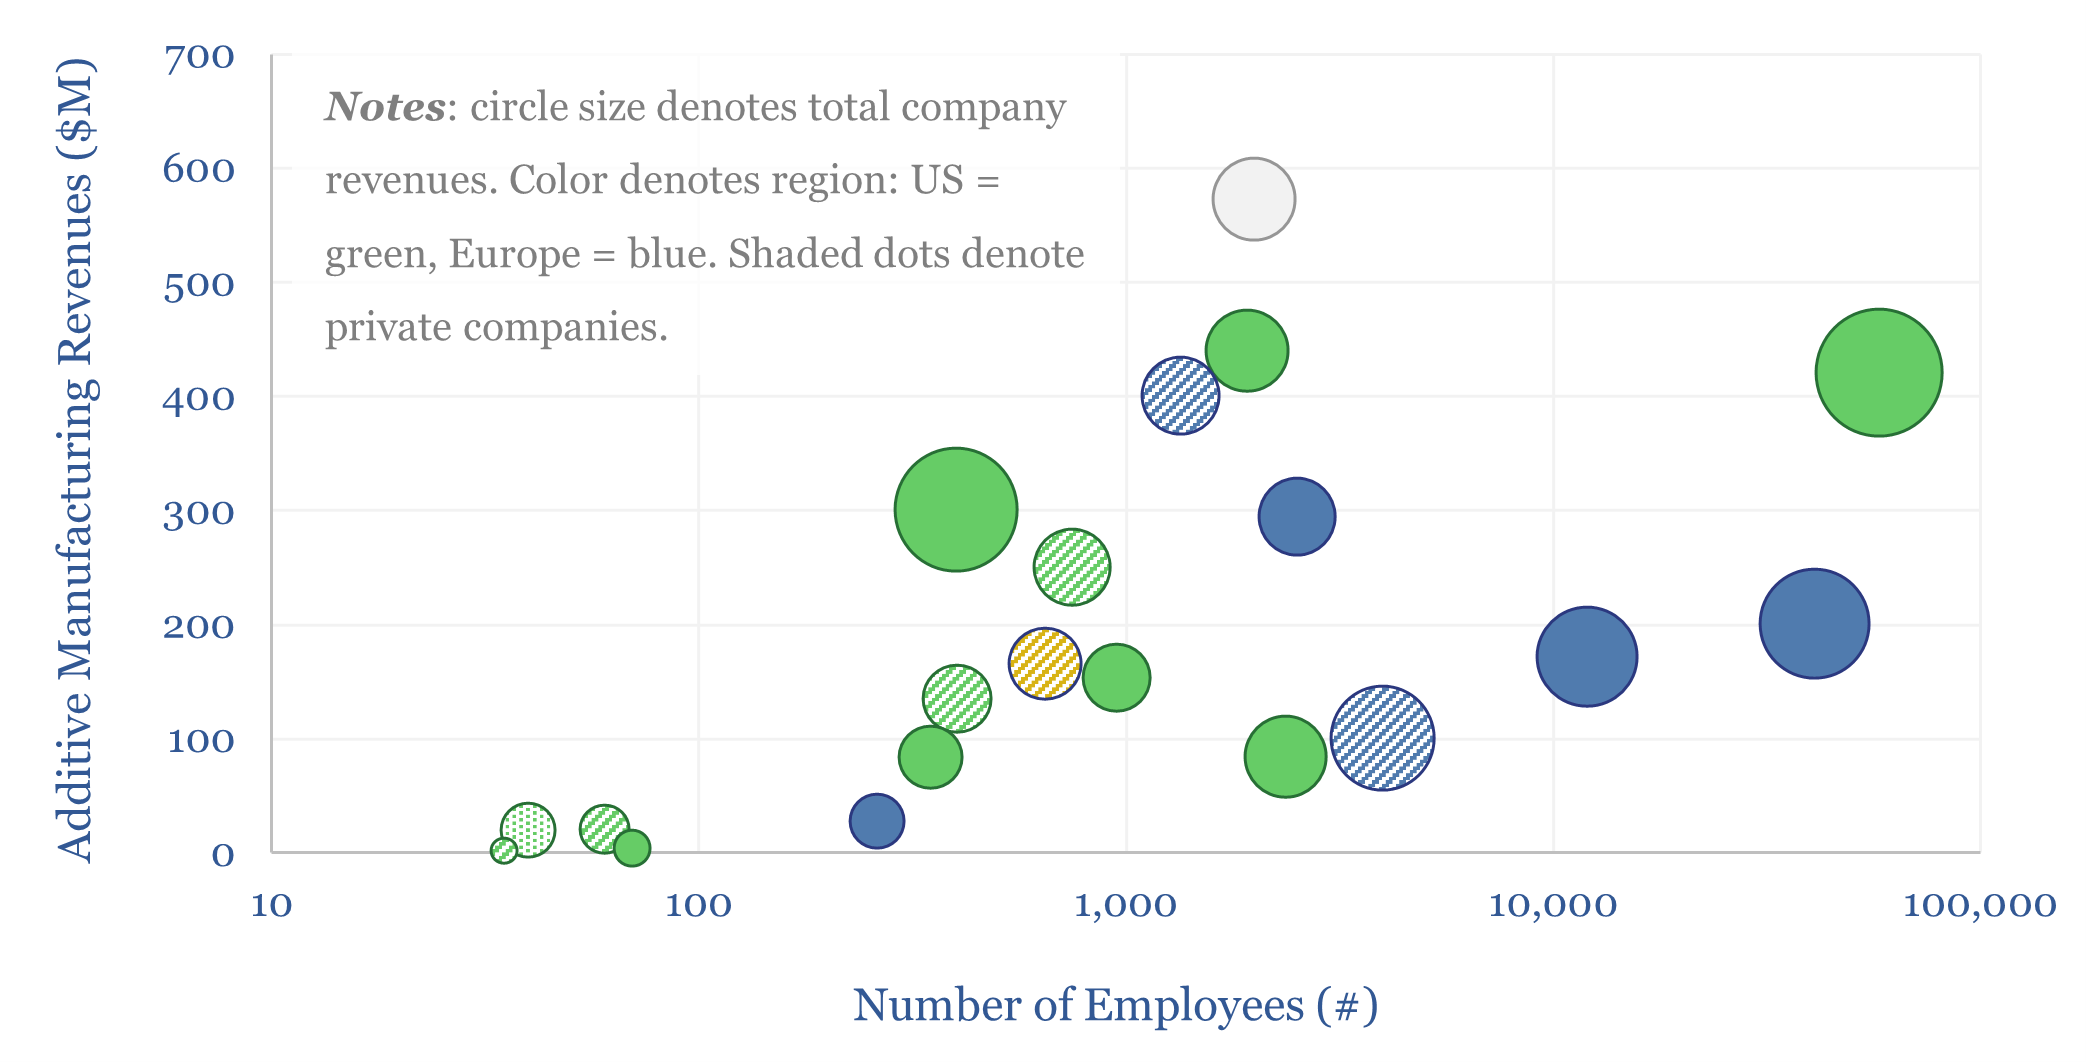
Additive manufacturing: technology leaders?

Additive manufacturing companies are screened in this data-file, across 20 technology leaders. We have also tabulated 25 case studies, where AM reduces weight by 40%, cost by 50%, and lead-time by 60%. The industry remains highly competitive. But could it be turning a corner? Especially for metal components in capital goods and aerospace?
-
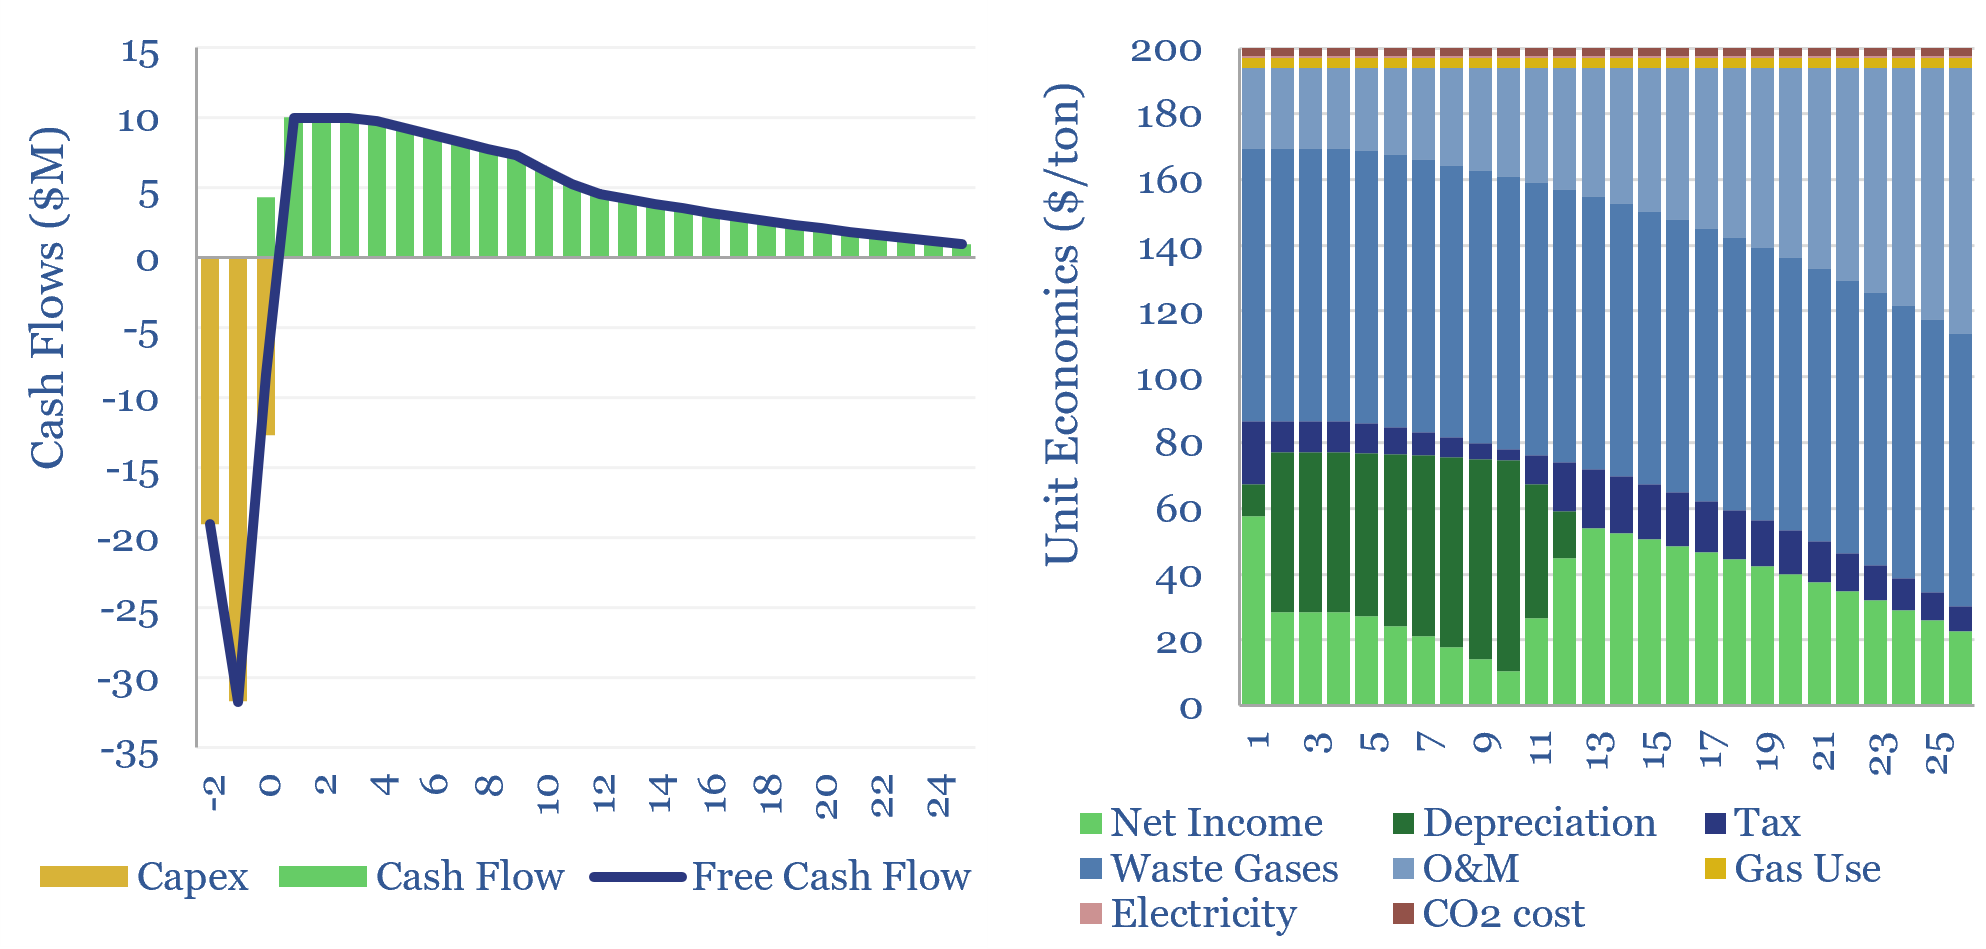
Investment casting: the economics?

Investment casting is fast and scalable, especially when producing hundreds-thousands of metal parts. $5/kg unlocks a 10% IRR on a 70% utilized metal-casting plant with $2,000/Tpa of capex, producing a typical 10kg aluminium product. This data-file captures the costs of investment-cast products, which can be stress-tested.

Content by Category
- Batteries (96)
- Biofuels (44)
- Carbon Intensity (48)
- CCS (64)
- CO2 Removals (9)
- Coal (44)
- Commentary (65)
- Company Diligence (105)
- Data Models (927)
- Decarbonization (162)
- Demand (131)
- Digital (89)
- Downstream (47)
- Economic Model (222)
- Energy Efficiency (76)
- Hydrogen (63)
- Industry Data (310)
- LNG (56)
- Materials (86)
- Metals (89)
- Midstream (45)
- Natural Gas (163)
- Nature (76)
- Nuclear (28)
- Oil (178)
- Patents (39)
- Plastics (44)
- Power Grids (156)
- Renewables (153)
- Screen (138)
- Semiconductors (35)
- Shale (58)
- Solar (72)
- Supply-Demand (53)
- Vehicles (94)
- Video (24)
- Wind (46)
- Written Research (409)