35bn tons of desalinated water are produced each year, absorbing 250 TWH of energy, or 0.4% of total global energy consumption. These numbers will likely rise, due to demographic trends, and due to climate change. Desalination costs average $1.0/m3.
These numbers have already doubled since 2005 and could rise sharply in the future: water use per capita remains 50-90% lower in the emerging world than in the United States, populations are growing and aquifers depleting. 1% of the world’s population currently lives off desalinated water. The UN expects this could rise to as much as 14% by 2025-30. So desalination will absorb a rising share of global energy demand and global electricity demand.
Reverse osmosis uses semi-permeable membranes and applied pressure to push water through a membrane while excluding salts. The membranes are generally aromatic polyamide thin-films or Nafion.
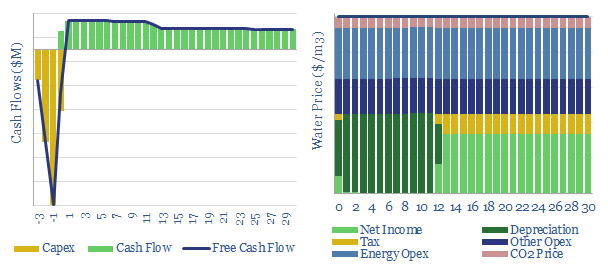
Hence, this model quantifies the energy economics of desalination via reverse osmosis, which requires 3.6kWh of energy per m3 of desalinated sea-water. A cost of $1.0/m3 is necessary for a passable IRR, which is equivalent to $1/ton of water.
The world’s largest desalination plant was built at Sorek, Israel in 2013, with an output of 624,000m3/day, and a sales price of $0.58/m3. Other useful datapoints are collated in the data-file.
Impacts can be stress-tested from varying energy prices, CO2 prices, capex costs, opex costs and energy efficiency. Our own base case estimates are derived from past projects and technical papers, in order to give a breakdown of desalination costs.
An angle that excites over desalination costs is the possibility for demand shifting, as electricity is a major cost line, and desalination pumps can be run flexibly to backstop renewables’ volatility.