Written Research
-
Additive manufacturing: fine print?
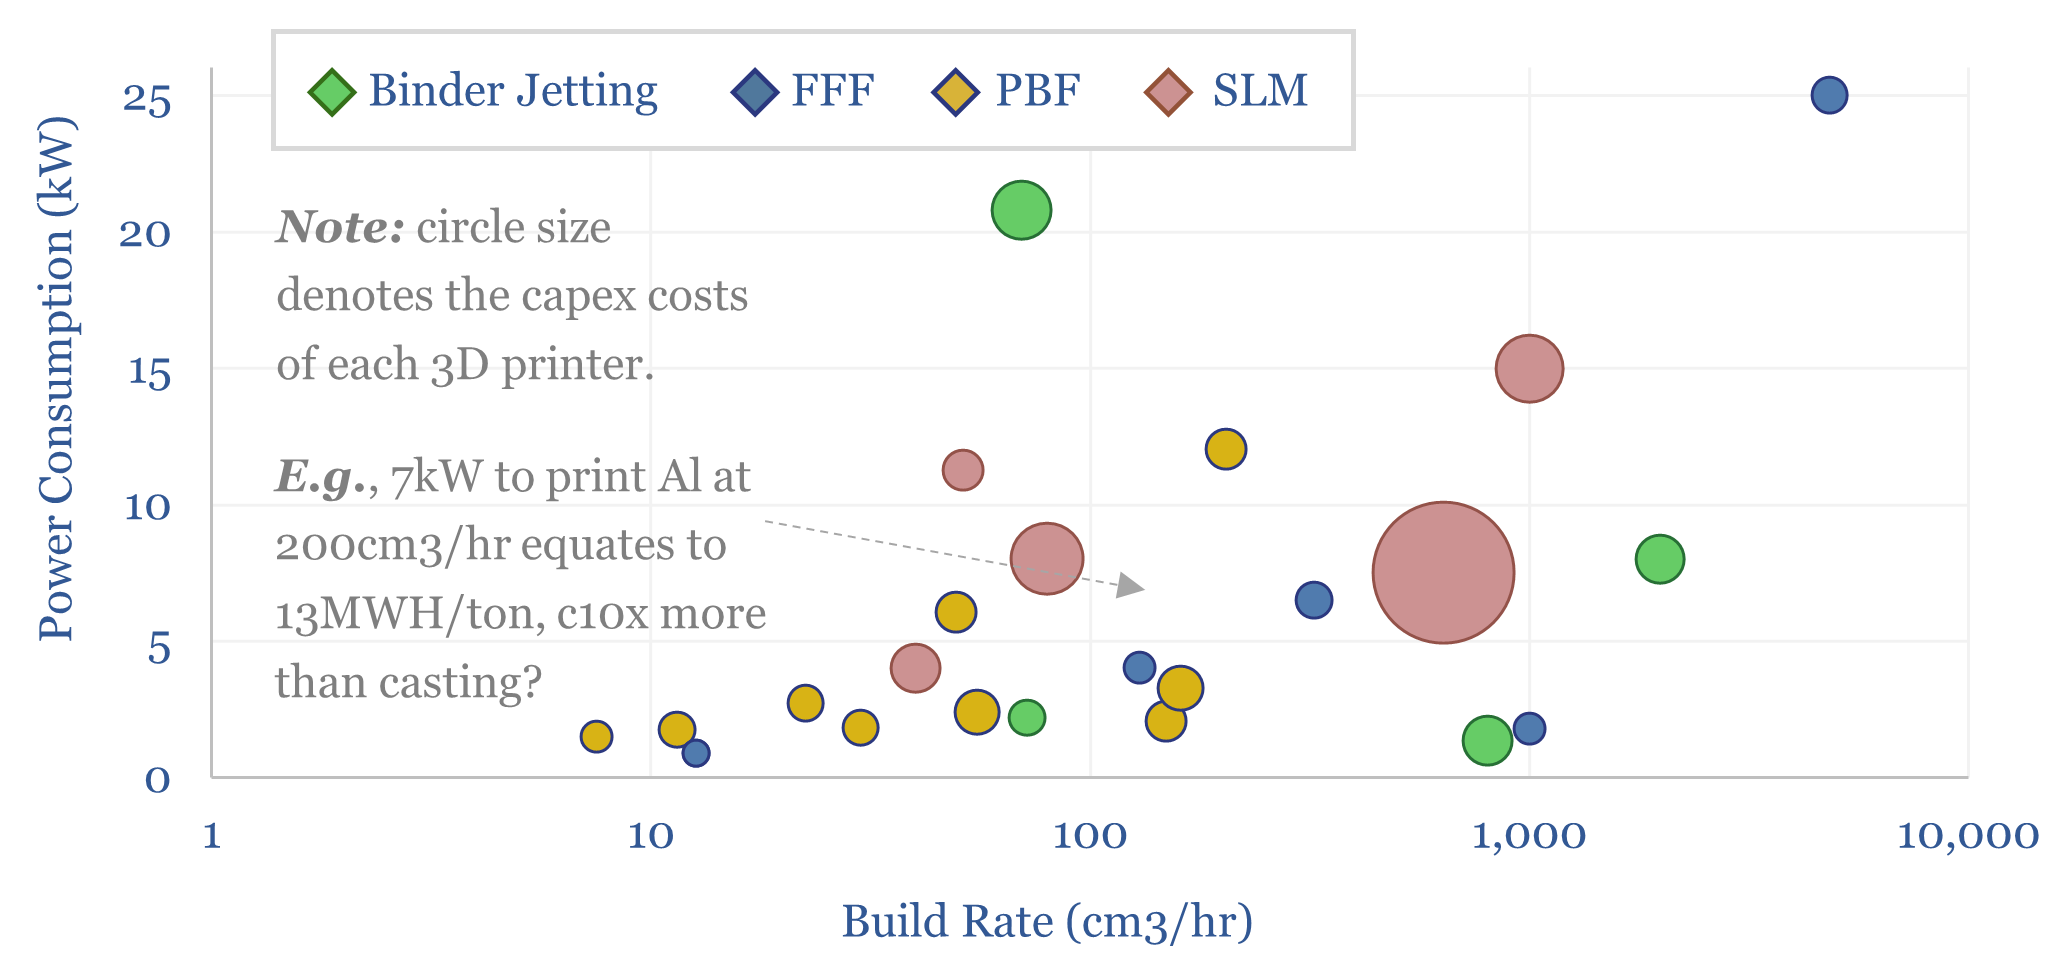
Can additive manufacturing overcome bottlenecks in gas turbine components, aerospace-related capital goods, and custom products that are unlocked by AI? This 16-page report re-evaluates the outlook for 3D printing, its economics, energy use, and company implications.
-
Peak loads: can batteries displace gas peakers?
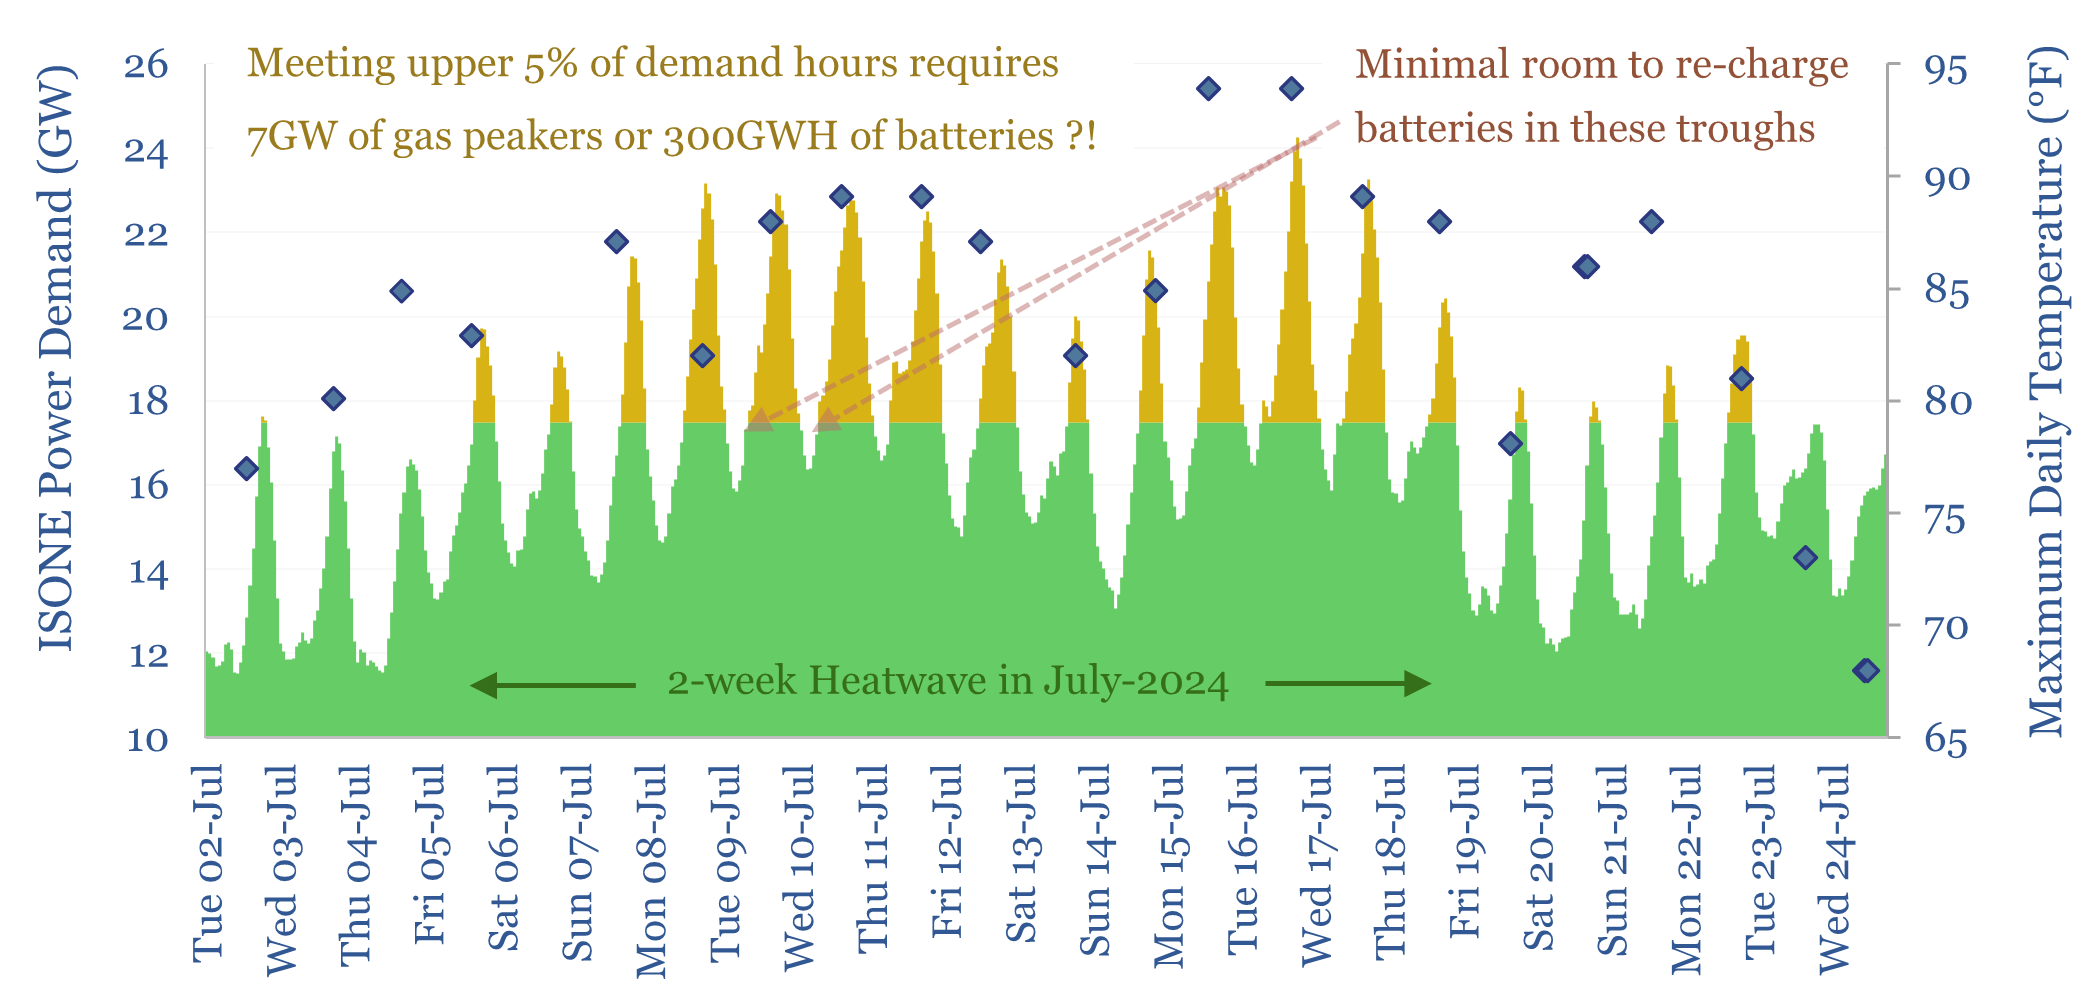
Peak loads in power grids are caused by heatwaves (in the US) and cold snaps (in Europe), which last 2-14 days. This 16-page report finds that very large batteries would be needed to ride through these episodes, costing 2-20x more than gas peakers. But the outlook differs interestingly between the US vs Europe.
-
Industrial robots: arm’s reach?
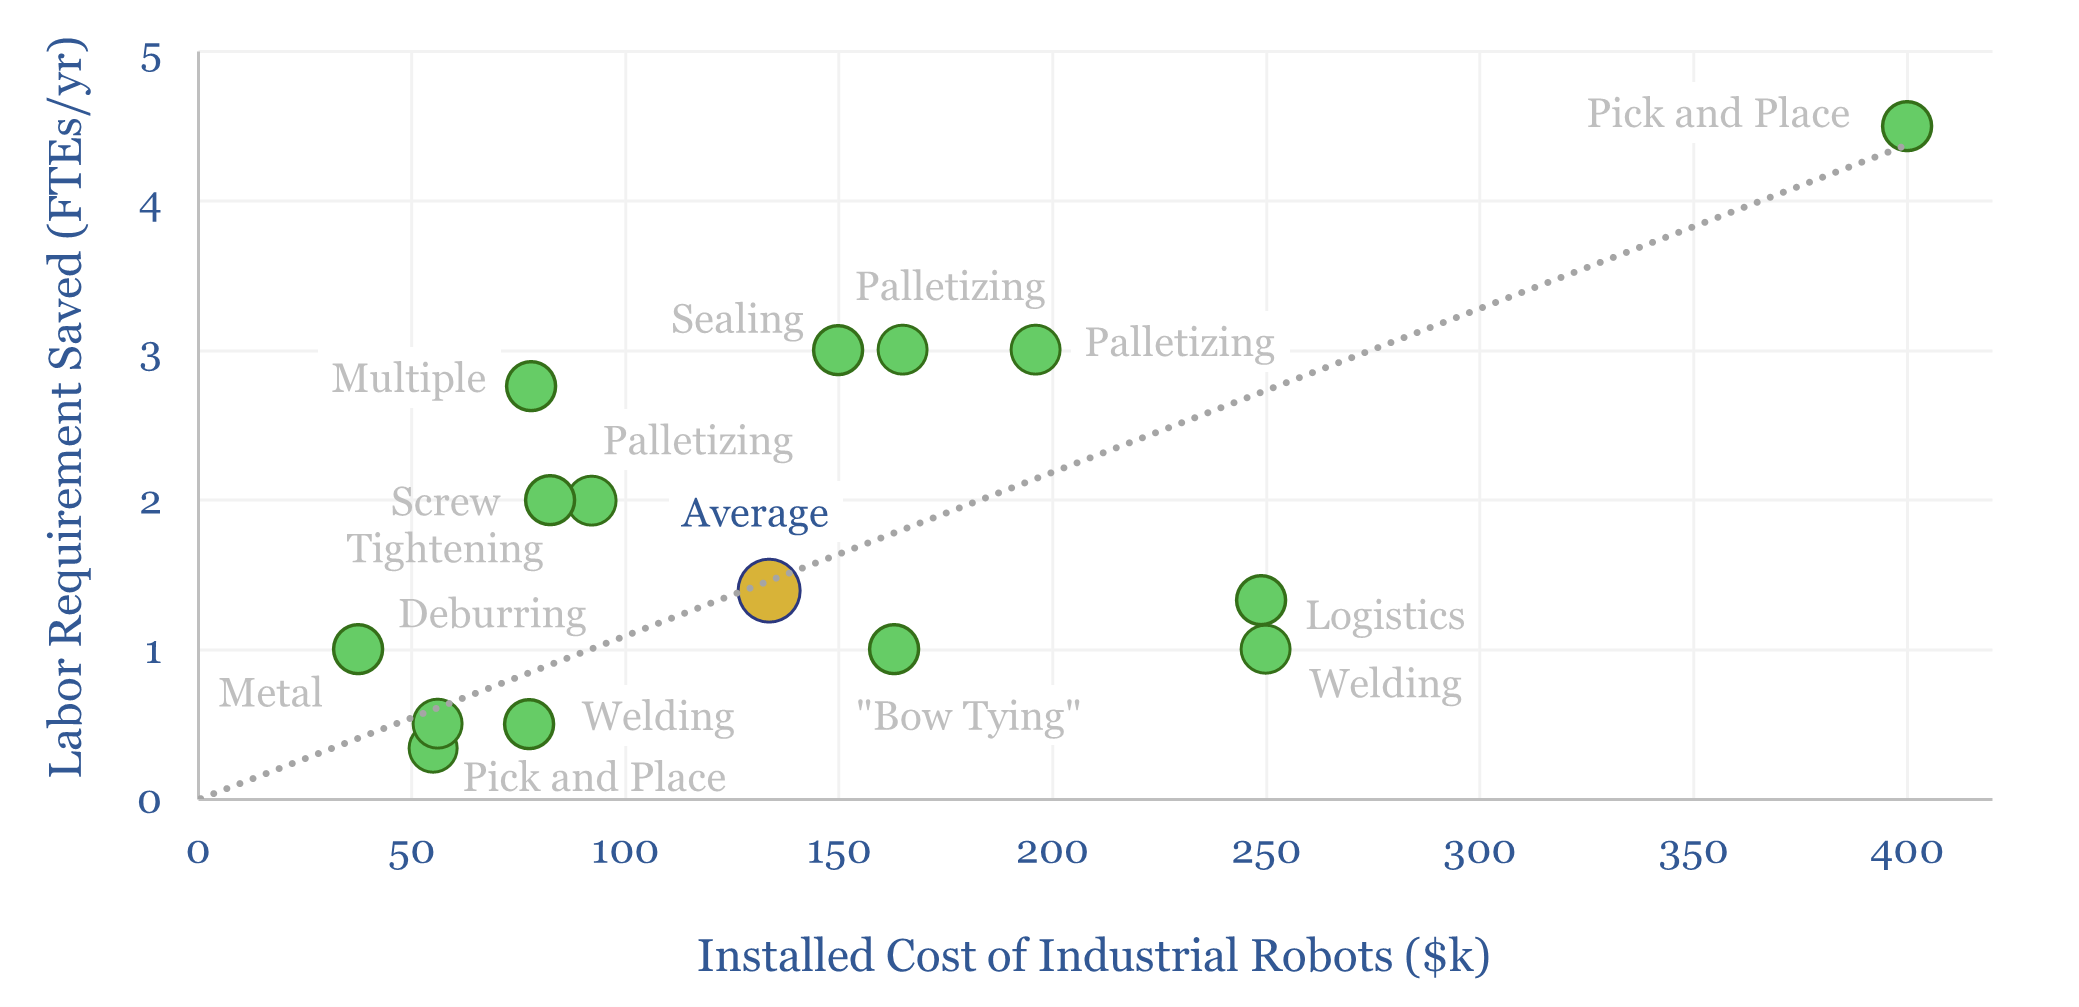
5 million industrial robots have now been deployed globally, in an $18bn pa market. But growth could inflect, with the rise of AI, and to solve labor bottlenecks, as strategic value chains are re-shored. Robotics effectively substitute labor inputs for electricity inputs. Hence today’s 18-page report compiles 25 case studies, explores the theme and who…
-
Power grid bottlenecks: flattening the curve?
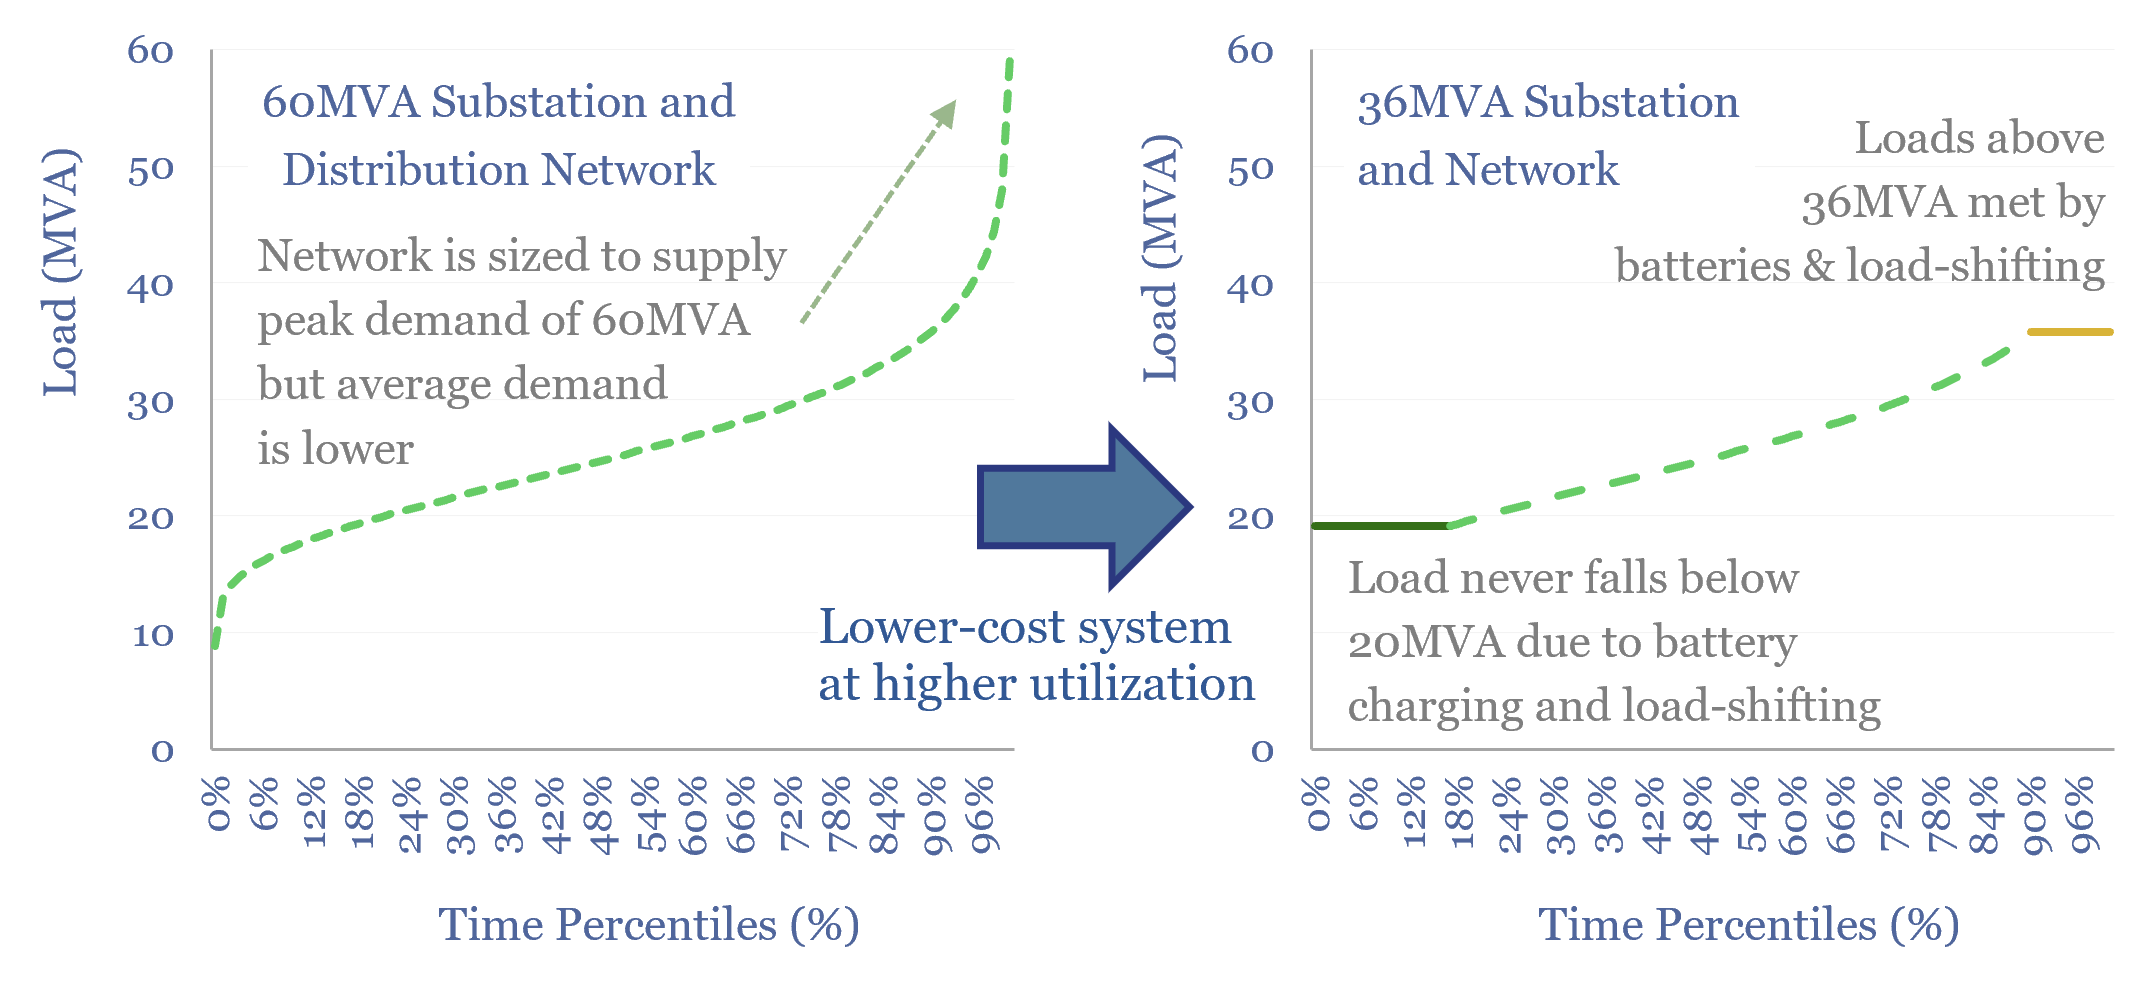
Will persistent grid bottlenecks de-rail electricity growth? This 18-page report explores using batteries and smart energy systems to reduce the need for new power lines. This option can be surprisingly economical, when back-tested on real-world load profiles. Hence we are upgrading our battery outlook.
-
Carbon markets: charity case?
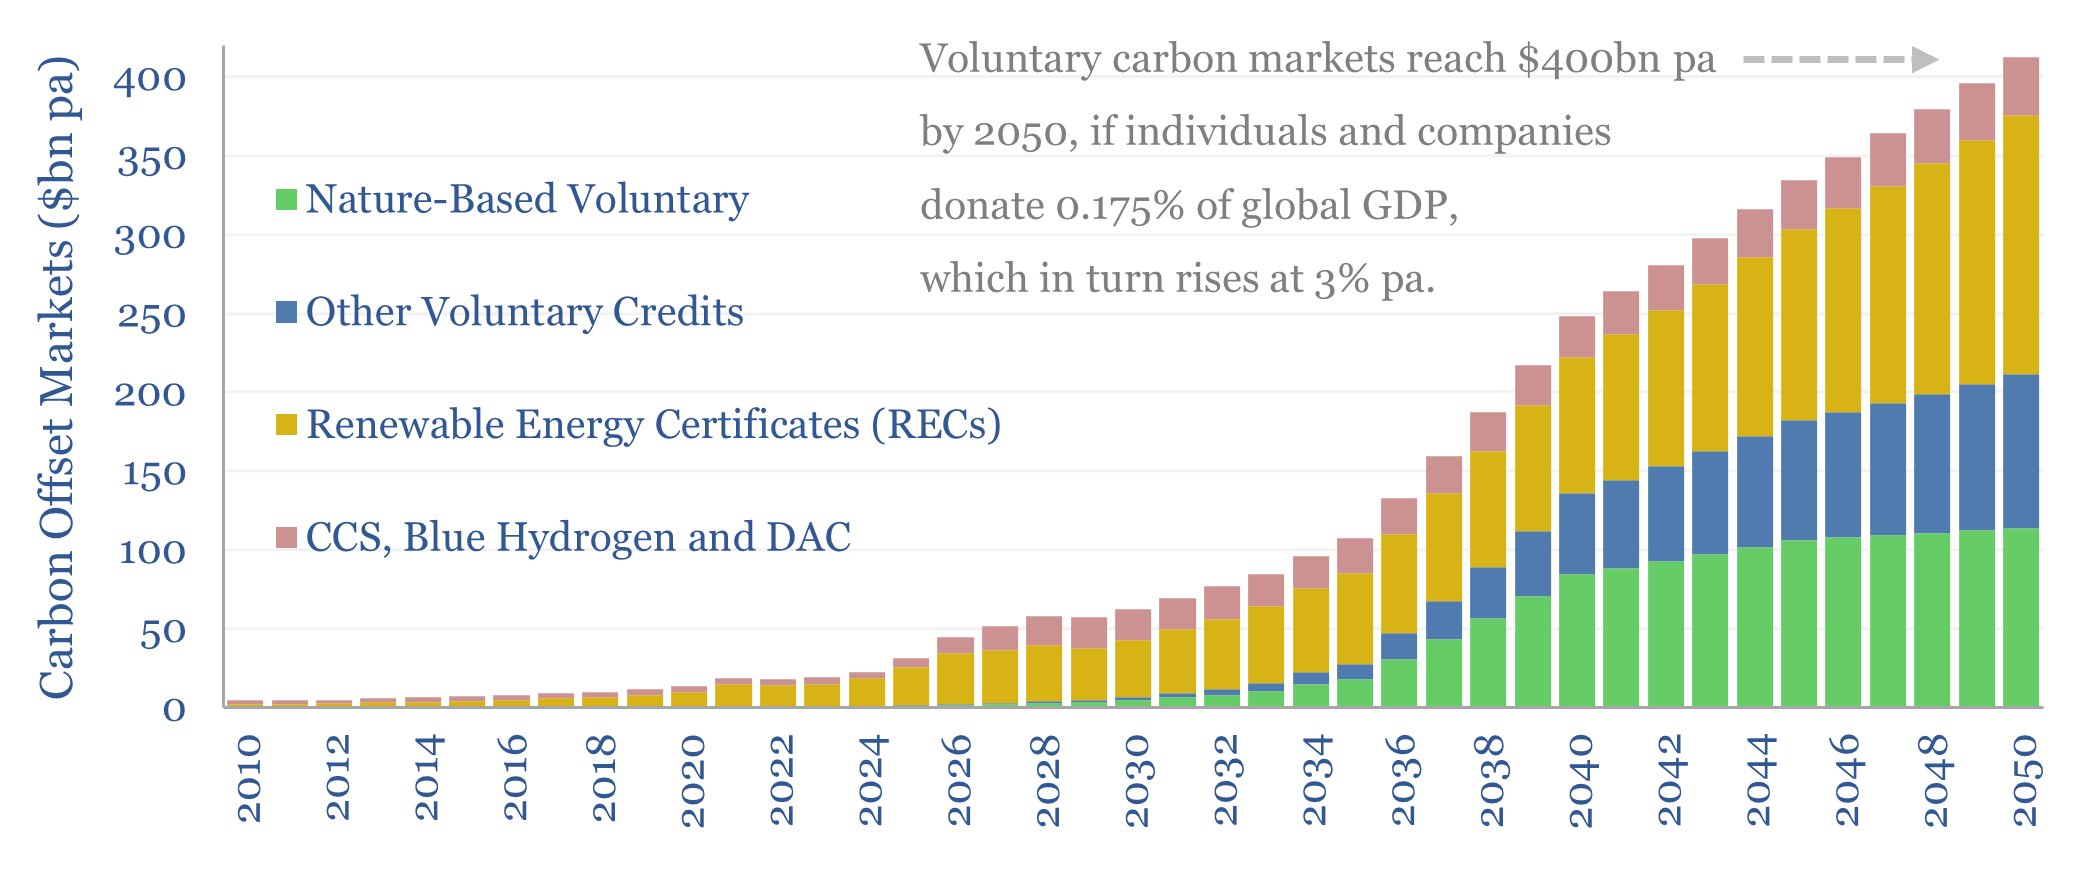
Carbon markets incentivize renewable energy, CCS, DAC, nature-based solutions and other CO2 offsets. In the past, we naïvely assumed these would grow as much as needed to reach Net Zero by 2050. This 14-page note revises our forecasts, by analogy to other forms of charitable giving. We see voluntary carbon markets reaching $400bn pa by…
-
Power plant cooling: adapting for water scarcity?
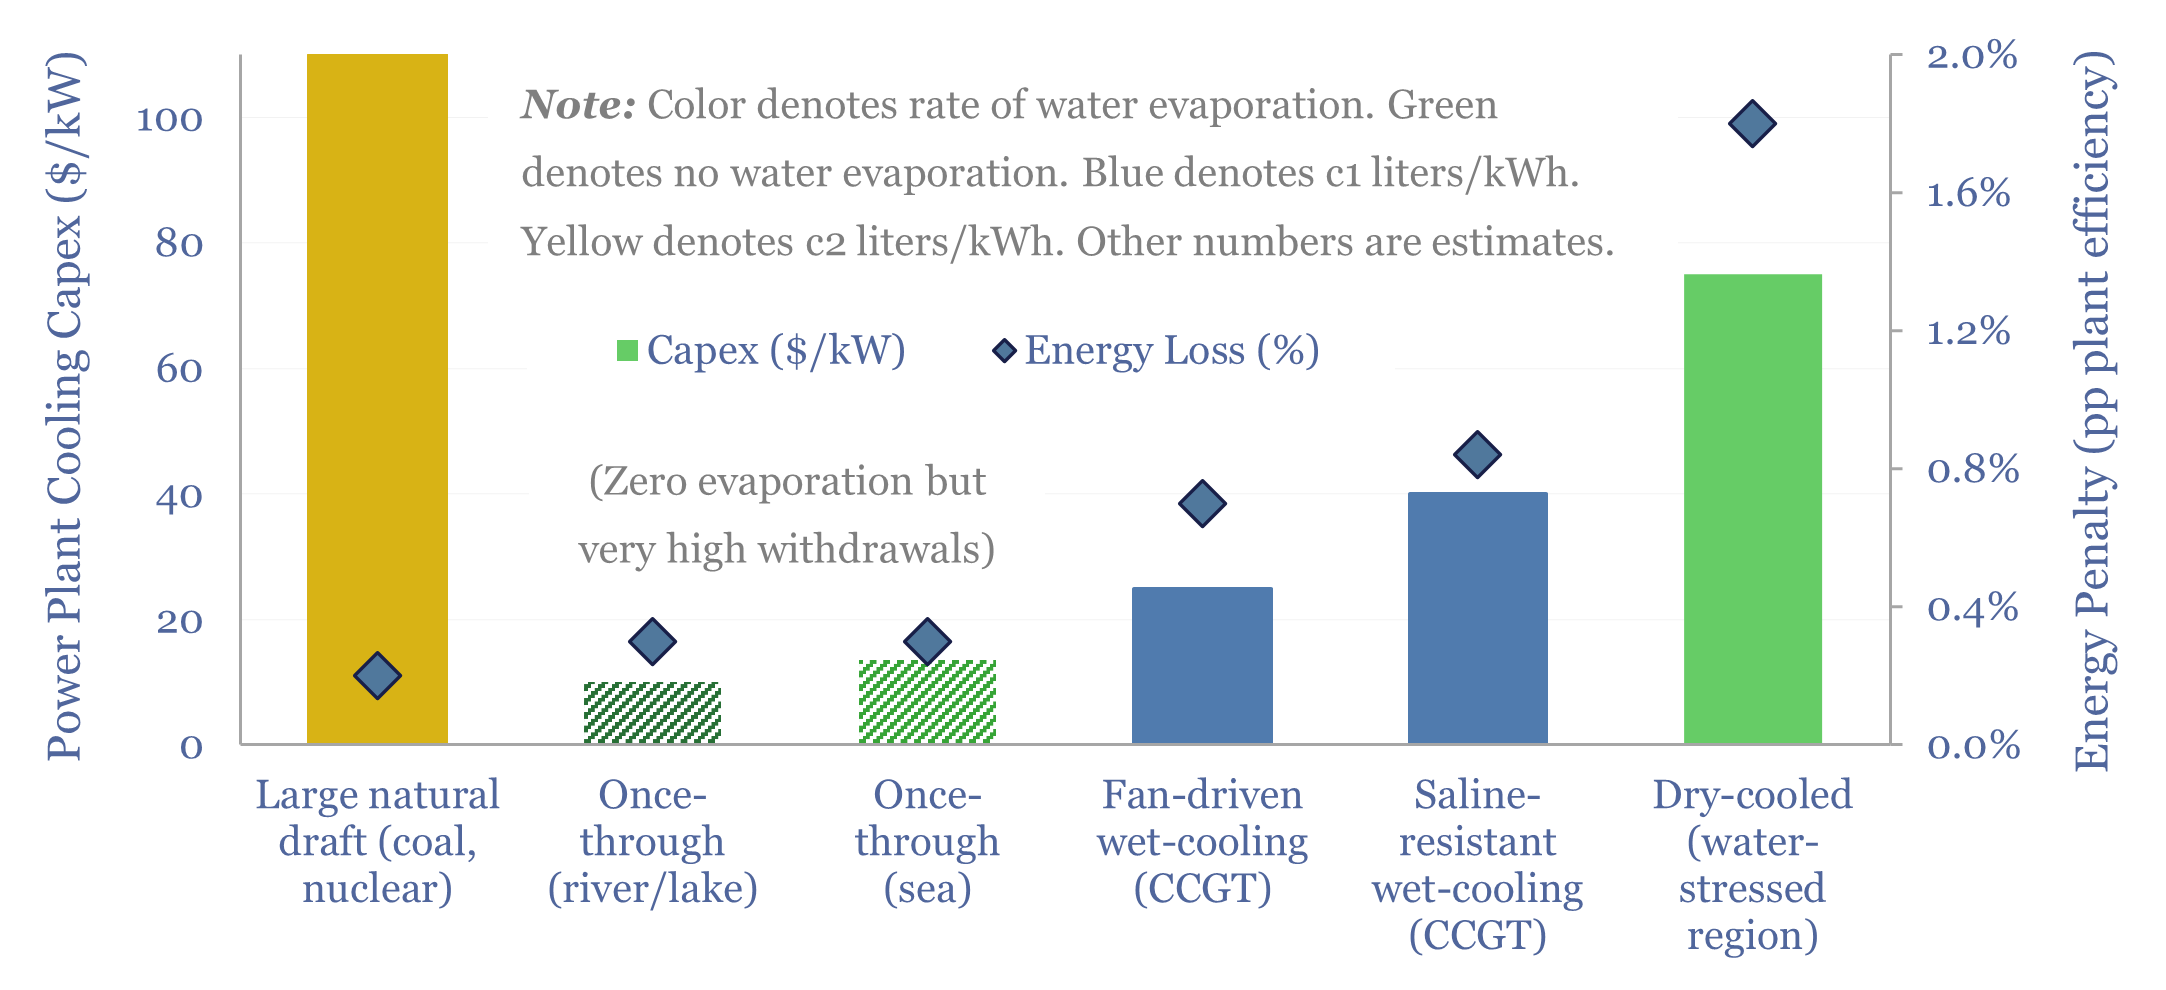
Water is needed to condense steam, downstream of the steam turbines, in nuclear, coal and CCGT power plants. But thermal power demands and fresh water scarcity are both structurally rising. Hence this 16-page report explores how the energy industry might adapt, trends in power plant cooling, and who benefits.
-
Wind energy: beyond good and evil?
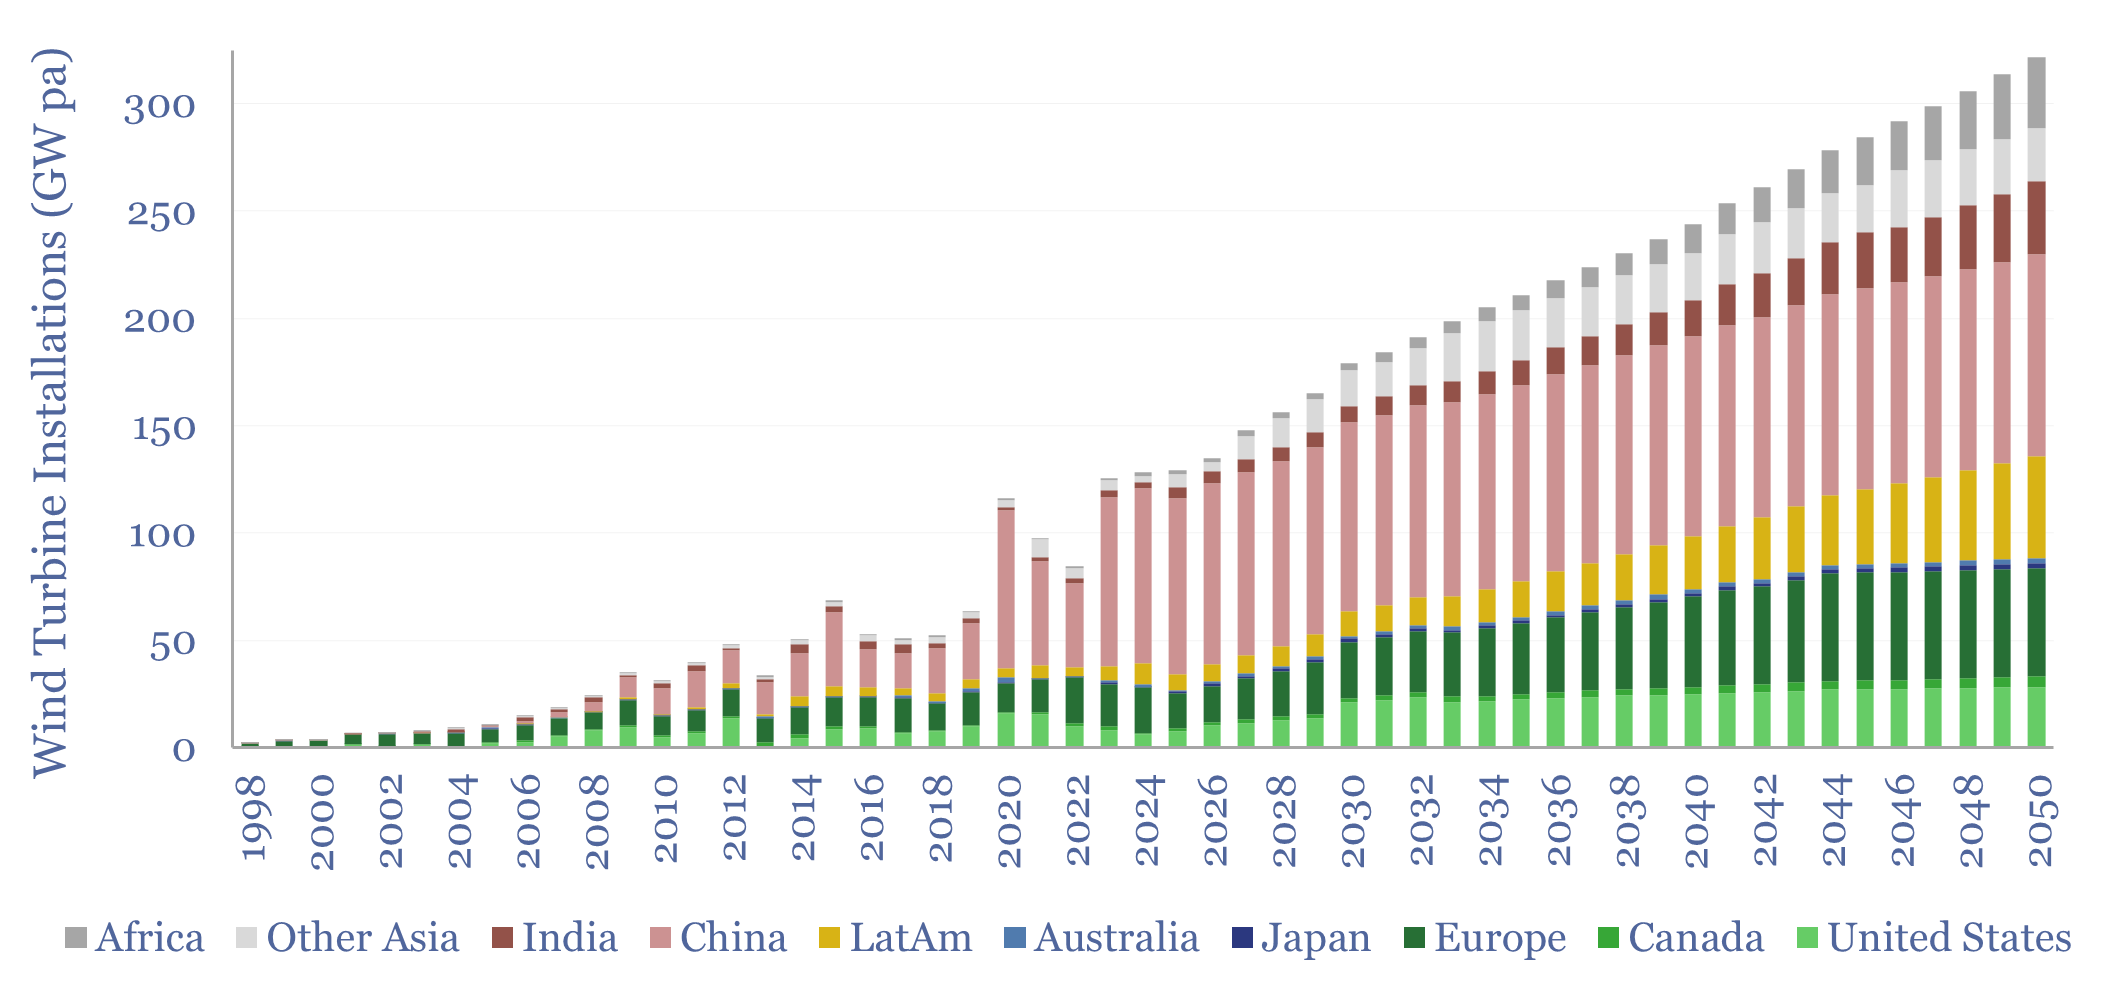
Wind economics are not good or bad in absolute terms. They depend on capacity factors, which average 26% globally, but can range from 10% to 60%. In the best locations, levelized costs are below 4c/kWh. Hence this 16-page note explores global wind capacity factors and updates our wind outlook by region throgh 2050.
-
European energy: the burial of the dead?
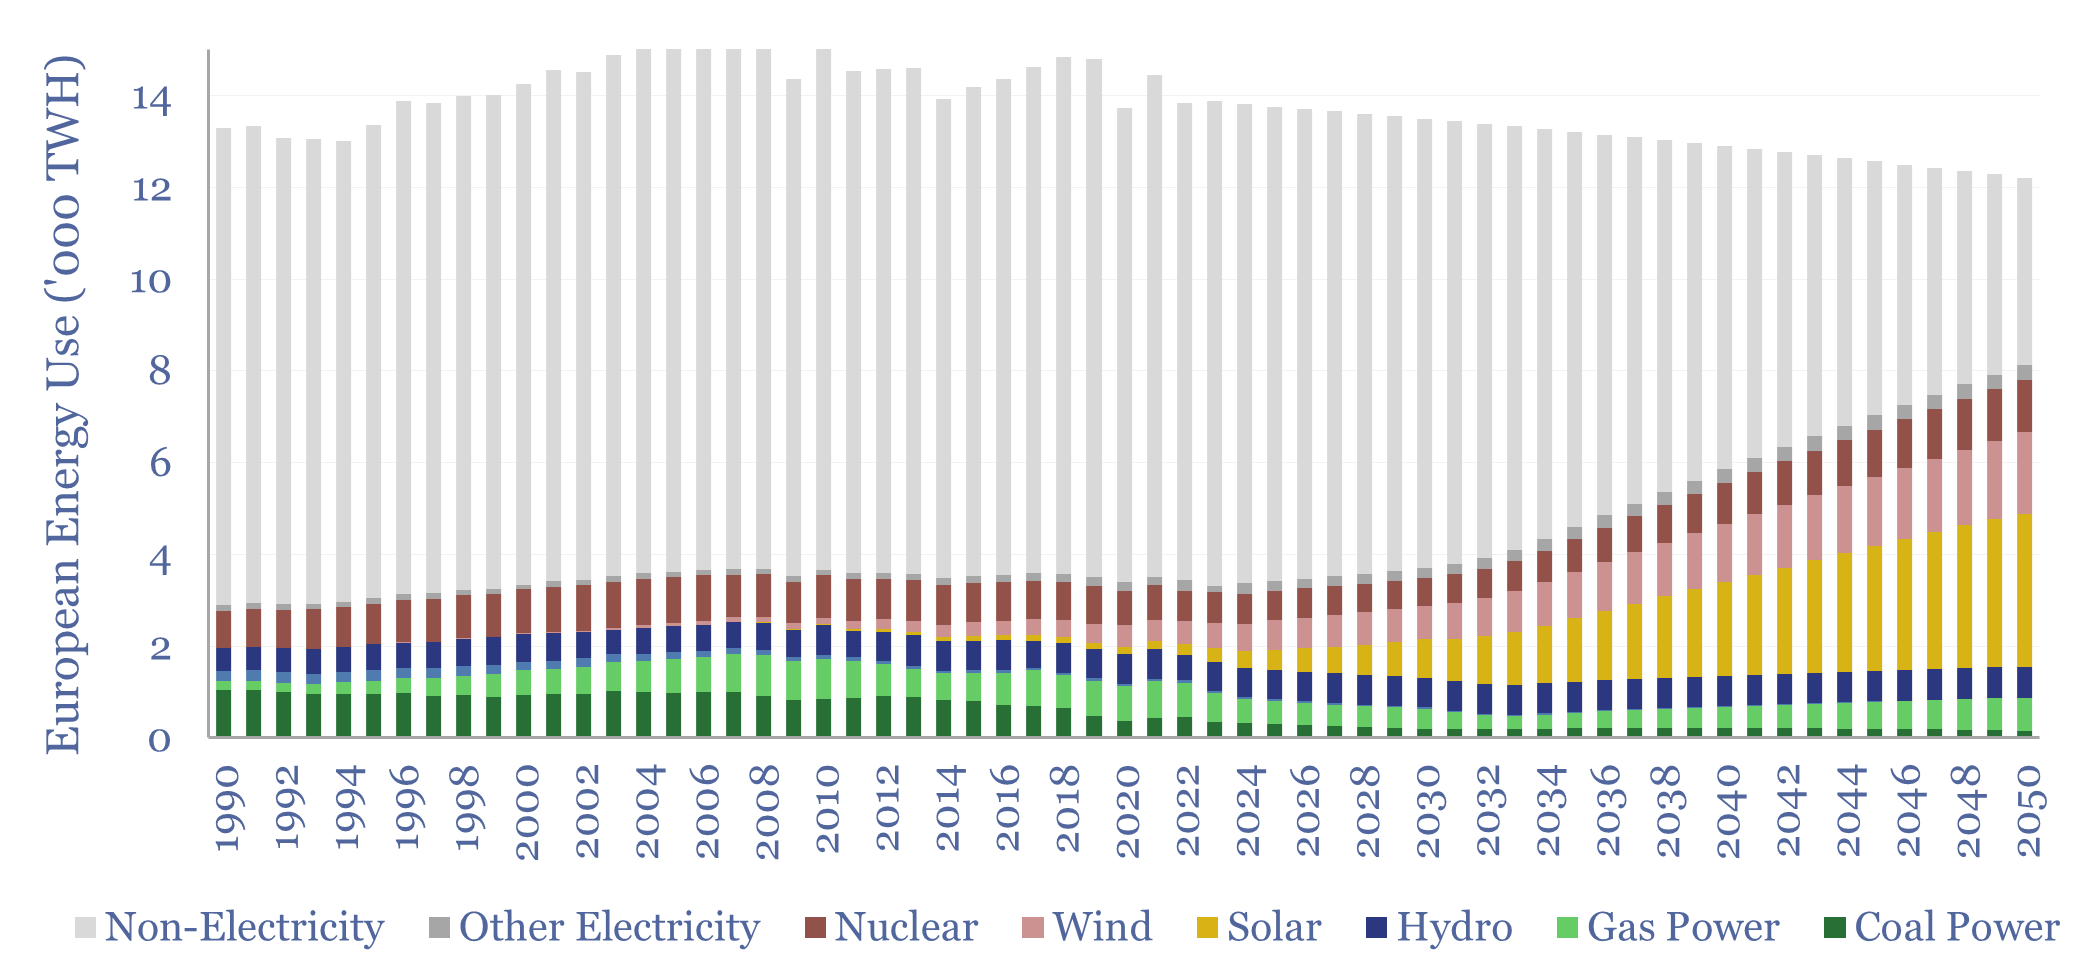
Europe’s energy ambitions are now intractable: It is just not feasible to satisfy former climate goals, new geopolitical realities, and also power future AI data centers. Hence this 18-page report evaluates Europe’s energy options; predicts how policies are going to change; and re-forecasts Europe’s gas and power balances, both to 2030 and to 2050.
-
Drone deployment: vertical take-off?
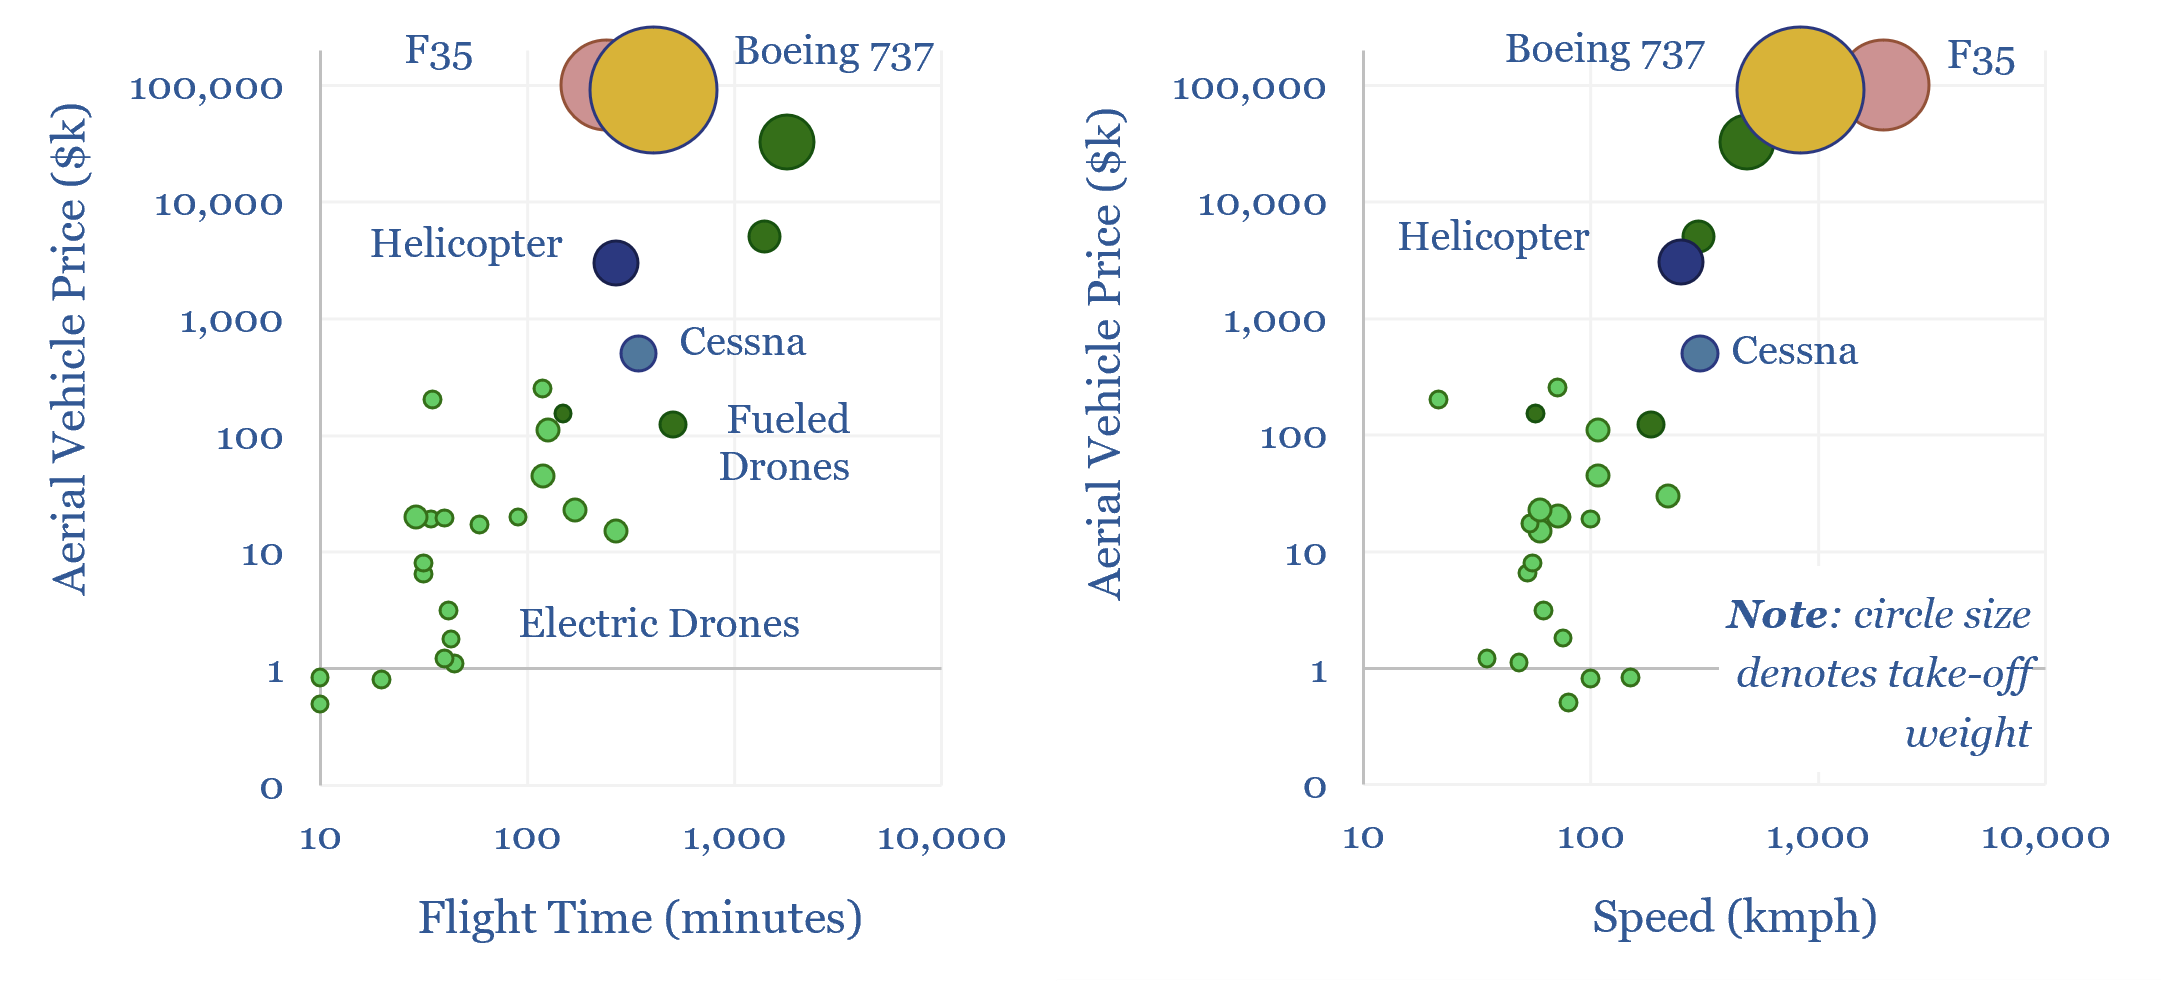
Drones cost just $1k-100k each. They may use 95-99% less energy than traditional vehicles. Their ascent is being helped by battery technology and AI. Hence this 14-page report reviews recent progress from 40 leading drone companies. What stood out most was a re-shaping of the defense industry, plus helpful deflation across power grids, renewables, agriculture,…
Content by Category
- Batteries (87)
- Biofuels (42)
- Carbon Intensity (49)
- CCS (63)
- CO2 Removals (9)
- Coal (38)
- Company Diligence (92)
- Data Models (822)
- Decarbonization (159)
- Demand (110)
- Digital (58)
- Downstream (44)
- Economic Model (200)
- Energy Efficiency (75)
- Hydrogen (63)
- Industry Data (275)
- LNG (48)
- Materials (81)
- Metals (74)
- Midstream (43)
- Natural Gas (146)
- Nature (76)
- Nuclear (23)
- Oil (162)
- Patents (38)
- Plastics (44)
- Power Grids (124)
- Renewables (149)
- Screen (112)
- Semiconductors (30)
- Shale (51)
- Solar (67)
- Supply-Demand (45)
- Vehicles (90)
- Wind (43)
- Written Research (347)

