Batteries
-
Energy storage: top conclusions into batteries?
Thunder Said Energy is a research firm focused on economic opportunities that can drive the energy transition. Our top ten conclusions into batteries and energy storage are summarized below, looking across all of our research.
-
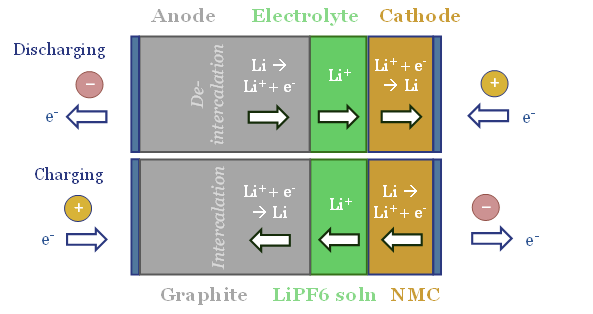
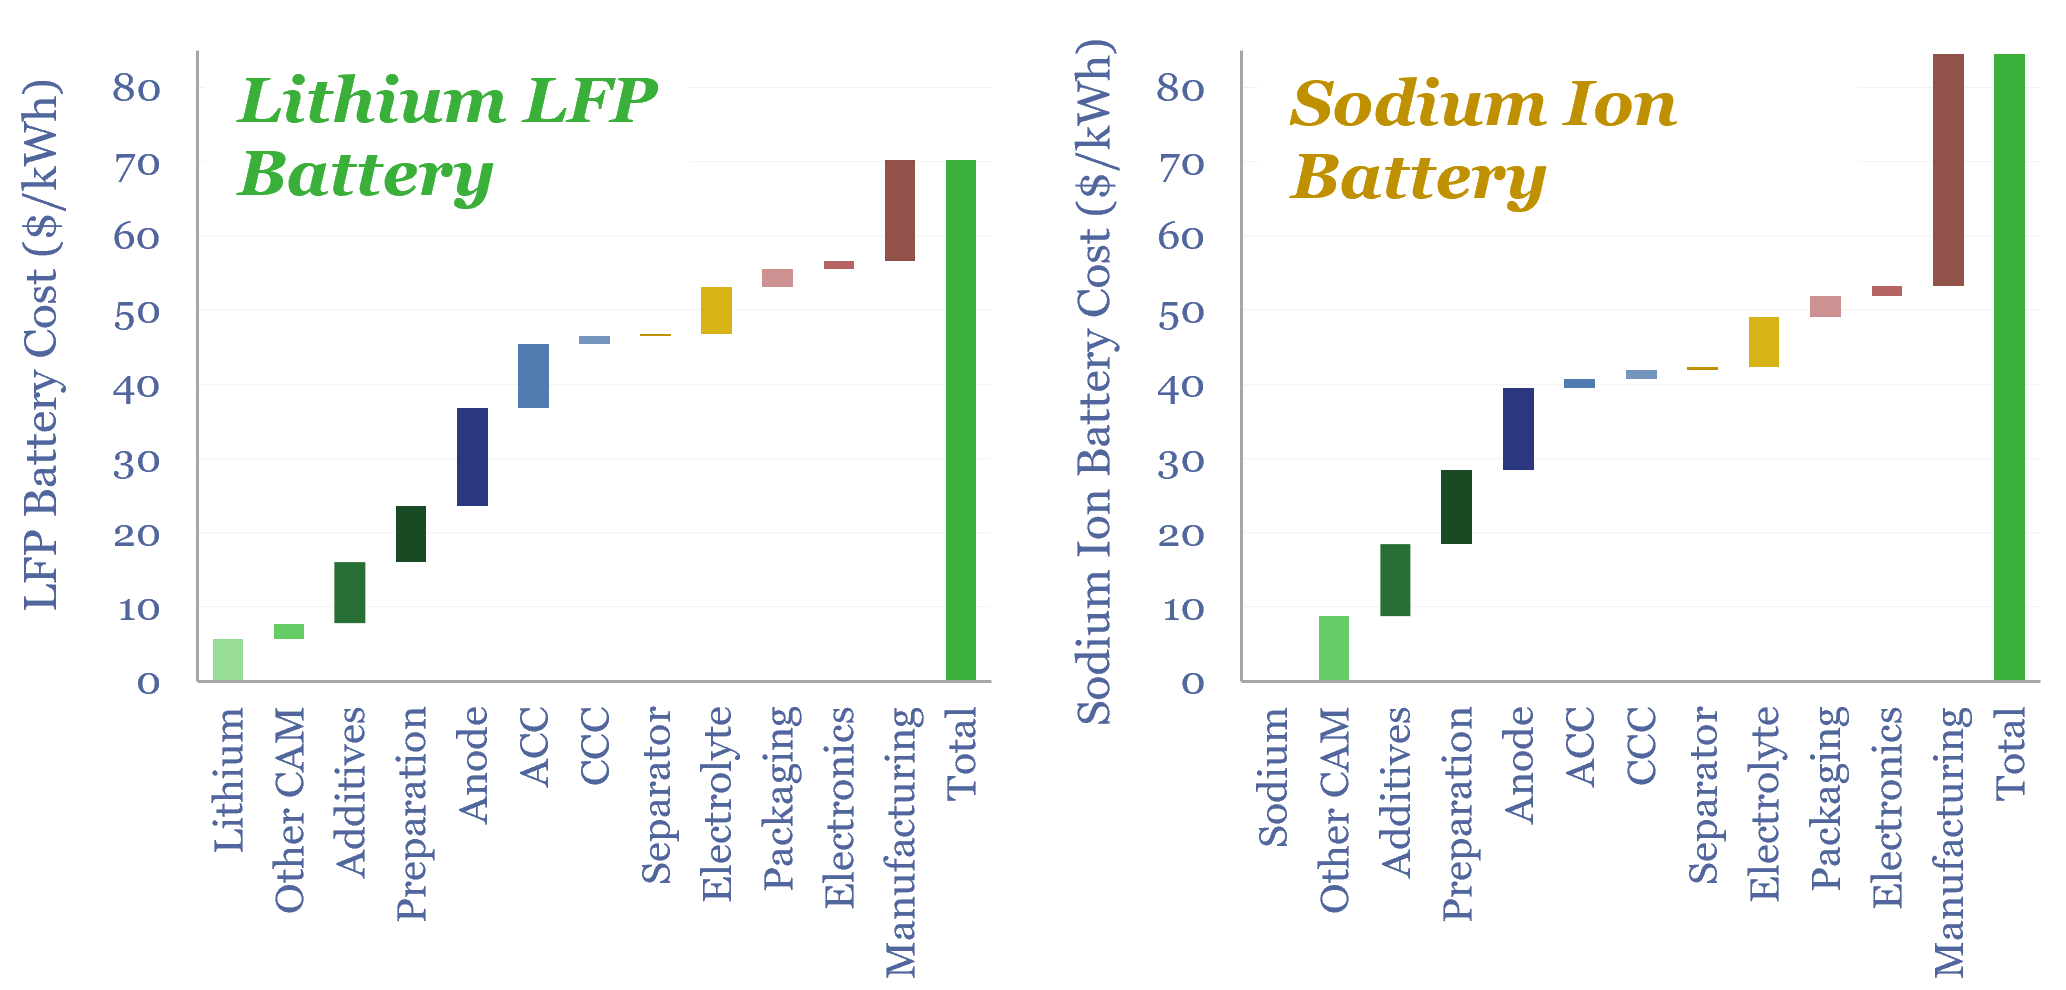
Sodium ion batteries: comparing costs versus LFP?

Sodium is 1,000x more abundant than lithium in the Earth’s crust and 99% cheaper. So will sodium ion batteries disrupt lithium ion batteries? Not until lithium carbonate prices treble to $40/kg. Or novel SIB electrode materials emerge. This 16-page SIB deep-dive de-risks our lithium market outlook.
-
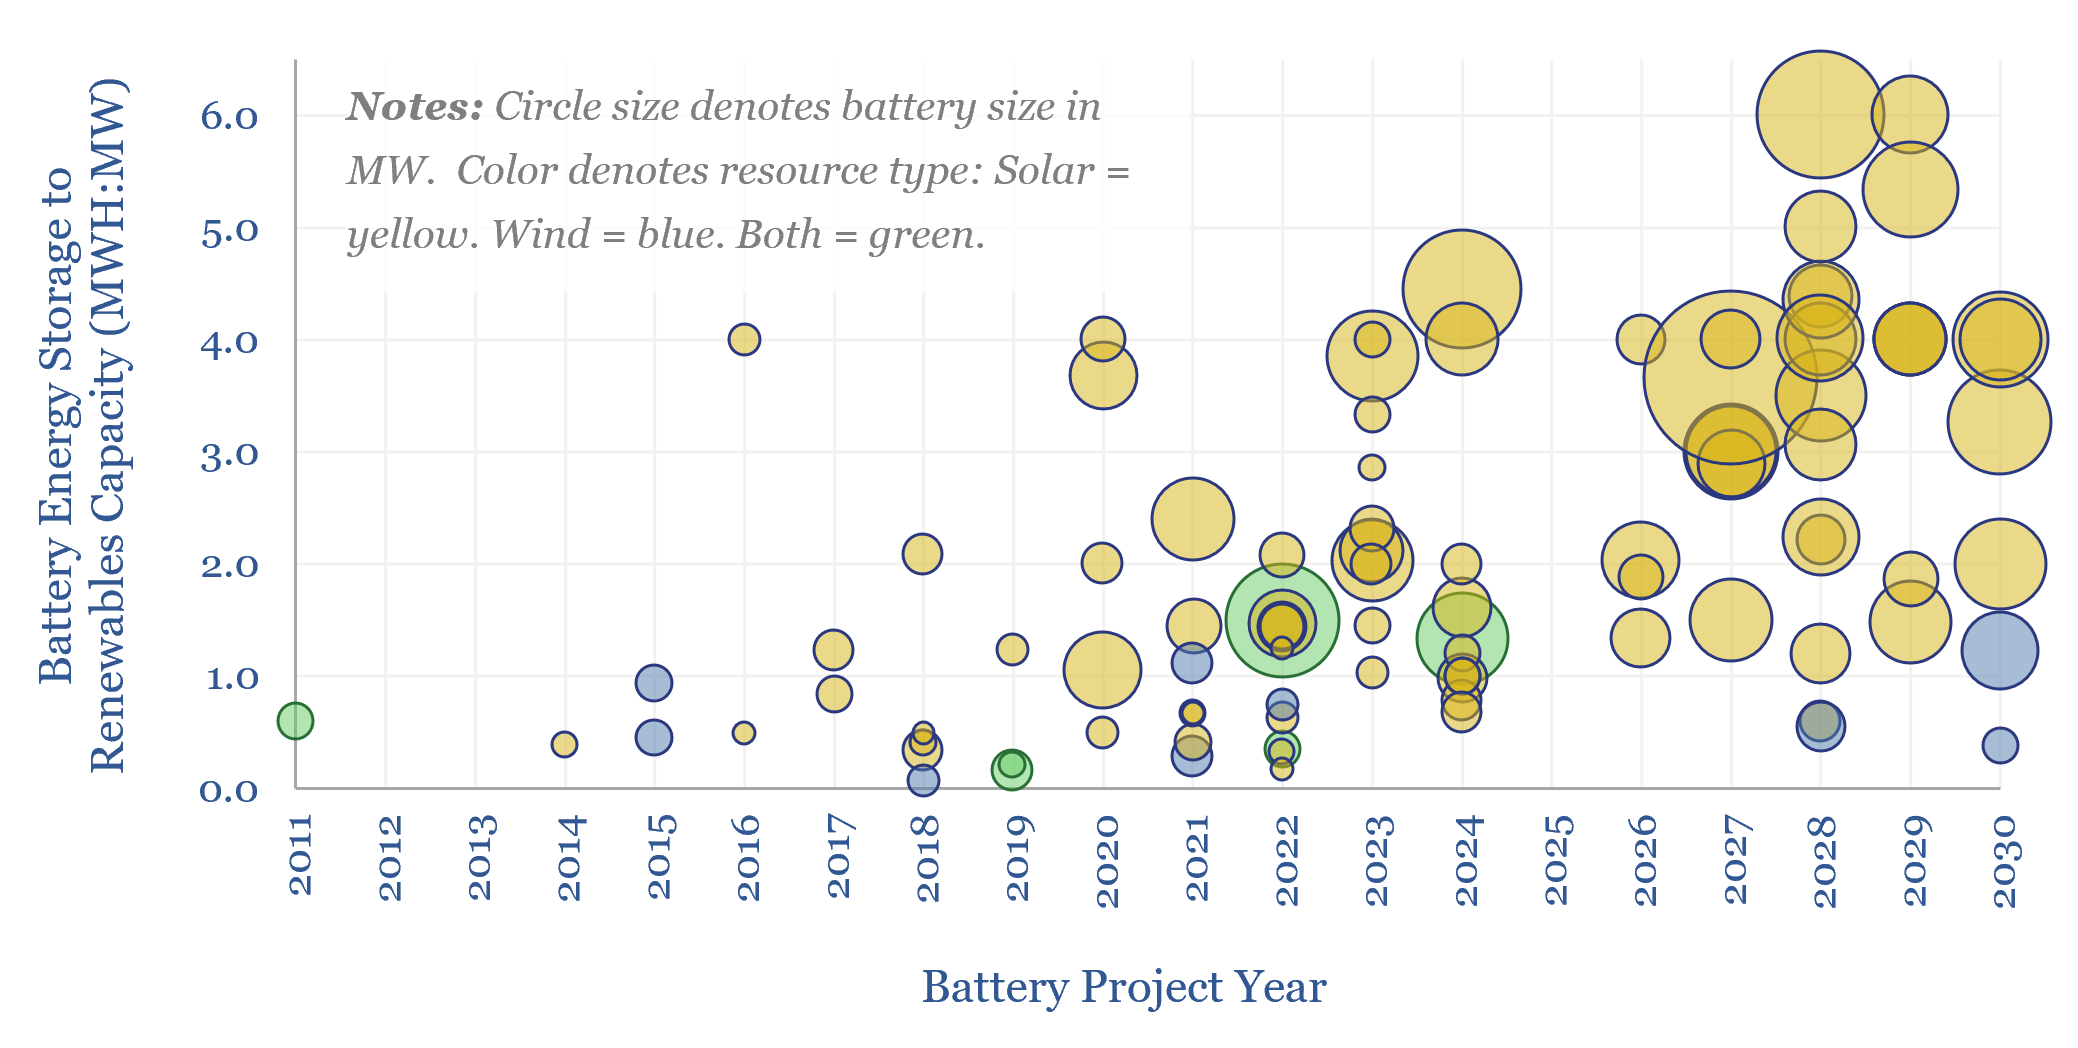
Renewables plus batteries: co-deployments over time?

More and more renewables projects are being co-developed with battery storage. On average, projects in 2026-30 that codeploy batteries will supplement each MW of renewables capacity with 0.8MW of battery capacity, which in turn offered 4-hours of energy storage per MW of battery capacity, for 3.3 MWH of energy storage per MW of renewables.
-
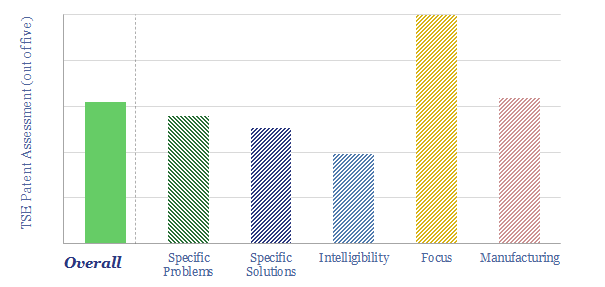
CATL: sodium ion battery breakthrough?

Contemporary Amperex Technology Co. Limited (CATL) is a Chinese battery manufacturer, HQ’d in Fusian, founded in 2011, with >30,000 employees. It may produce as many as one-third of all the lithium ion batteries in the world. This data-file assesses whether it has made a breakthrough in sodium ion batteries.
-
Grid-scale battery costs: the economics?

Grid-scale batteries are envisaged to store up excess renewable electricity and re-release it later. Grid-scale battery costs are modeled at 17c/kWh in our base case, which is the ‘storage spread’ that a LFP lithium ion battery must charge to earn a 10% IRR off c$1,000/kW installed capex costs. Other batteries can be compared in the…
-
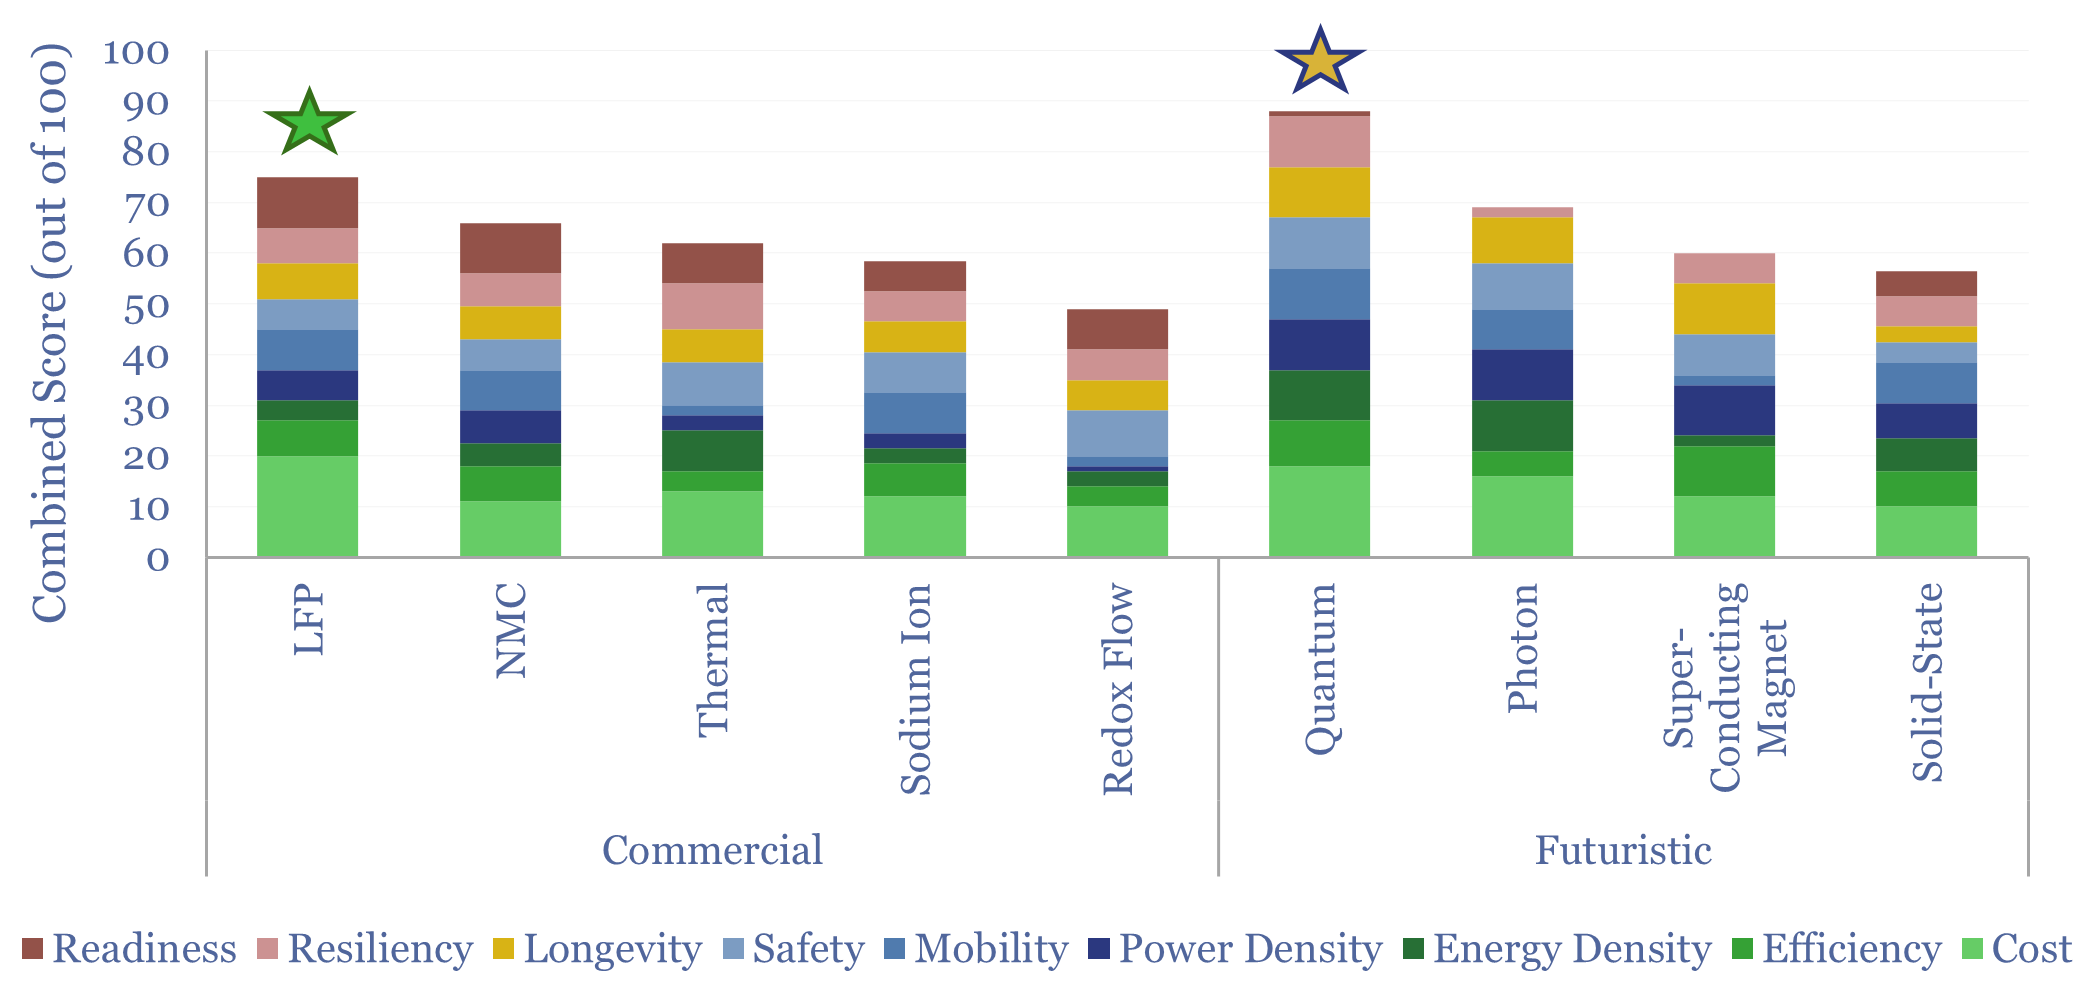
Energy storage: to infinity and beyond?

Lithium ion batteries are now so deeply entrenched that we doubt any new electrochemistry can supplant them. This 23-page report asks where are the opportunities now in batteries? Could any futuristic batteries with quasi-infinite capacity, such as quantum batteries, power inter-seasonal storage or long-distance aviation?
-
Battery integrators: leading companies in BESS?

A dozen companies act as the “battery integrators” for 90% of all grid-scale battery storage systems (BESS), packaging lithium ion cells into fully functional, containerized modules, which can be deployed and grid-connected. 2025 economics included over $30bn of revenues, $250/kWh selling prices and 8.5% operating margins. But competition is intensifying.
-
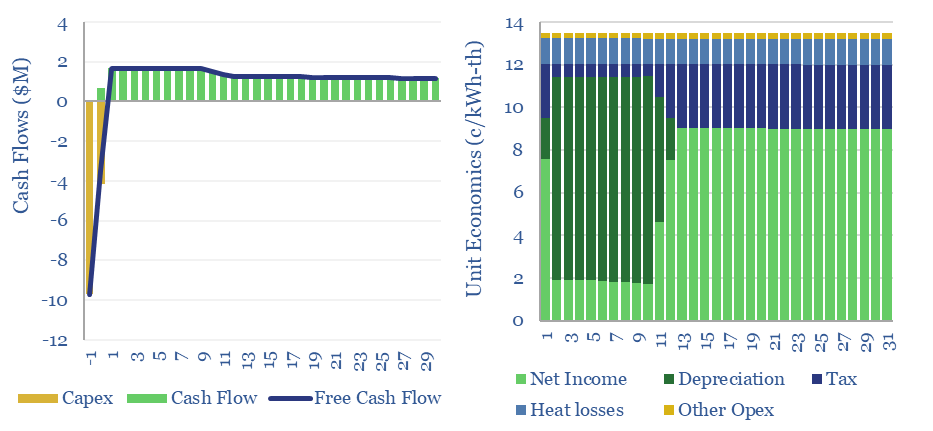
Thermal energy storage: cost model?

This data-file captures the costs of thermal energy storage, buying renewable electricity, heating up a storage media, then releasing the heat for industrial, commercial or residential use. Our base case requires 13.5 c/kWh-th for a 10% IRR using molten salt or sand, and as little as 5c/kWh-th when using low-cost graphite/petcoke modules.
-
Global lithium production: by project, by country, by resource?

Global lithium production, by project, by country, by resource type, and over time, are aggregated in this data-file, by tabulating details of each project. There is spare capacity in 2026, especially from Australian mine projects, but the current project pipeline sugggests a 20-30% market deficit in 2030-35.
-
Can solar provide round-the-clock power for data-centers?

This 15-page report models the costs of powering AI data centers, and other round-the-clock loads, using only solar and batteries, plus a “penalty” of 100-600 c/kWh for unmet demand. In some locations, solar+batteries will out-compete gas in the future? But an ocean of excess power gets thrown out?


Content by Category
- Batteries (96)
- Biofuels (44)
- Carbon Intensity (48)
- CCS (64)
- CO2 Removals (9)
- Coal (44)
- Commentary (65)
- Company Diligence (105)
- Data Models (927)
- Decarbonization (163)
- Demand (131)
- Digital (90)
- Downstream (47)
- Economic Model (222)
- Energy Efficiency (76)
- Hydrogen (63)
- Industry Data (311)
- LNG (56)
- Materials (86)
- Metals (89)
- Midstream (45)
- Natural Gas (163)
- Nature (76)
- Nuclear (28)
- Oil (178)
- Patents (39)
- Plastics (44)
- Power Grids (156)
- Renewables (153)
- Screen (138)
- Semiconductors (35)
- Shale (58)
- Solar (72)
- Supply-Demand (53)
- Vehicles (94)
- Video (24)
- Wind (46)
- Written Research (409)