Decarbonization
-
Biofuel technologies: an overview?
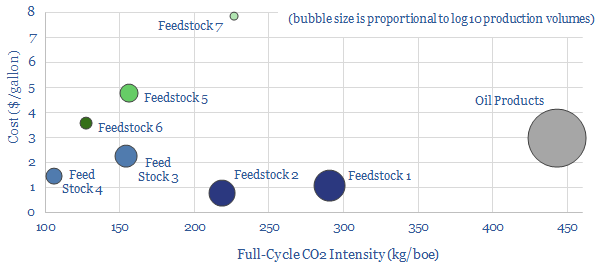
Biofuels are currently displacing 3.5Mboed of oil and gas. But they are not carbon-free, and their weighted average CO2 emissions are only c50% lower. This data-file breaks down the biofuels market across seven key feedstocks, to help identify which opportunities can scale for the lowest costs and CO2, versus others that require further technical progress.
-
Ten investment themes for 2026-30?
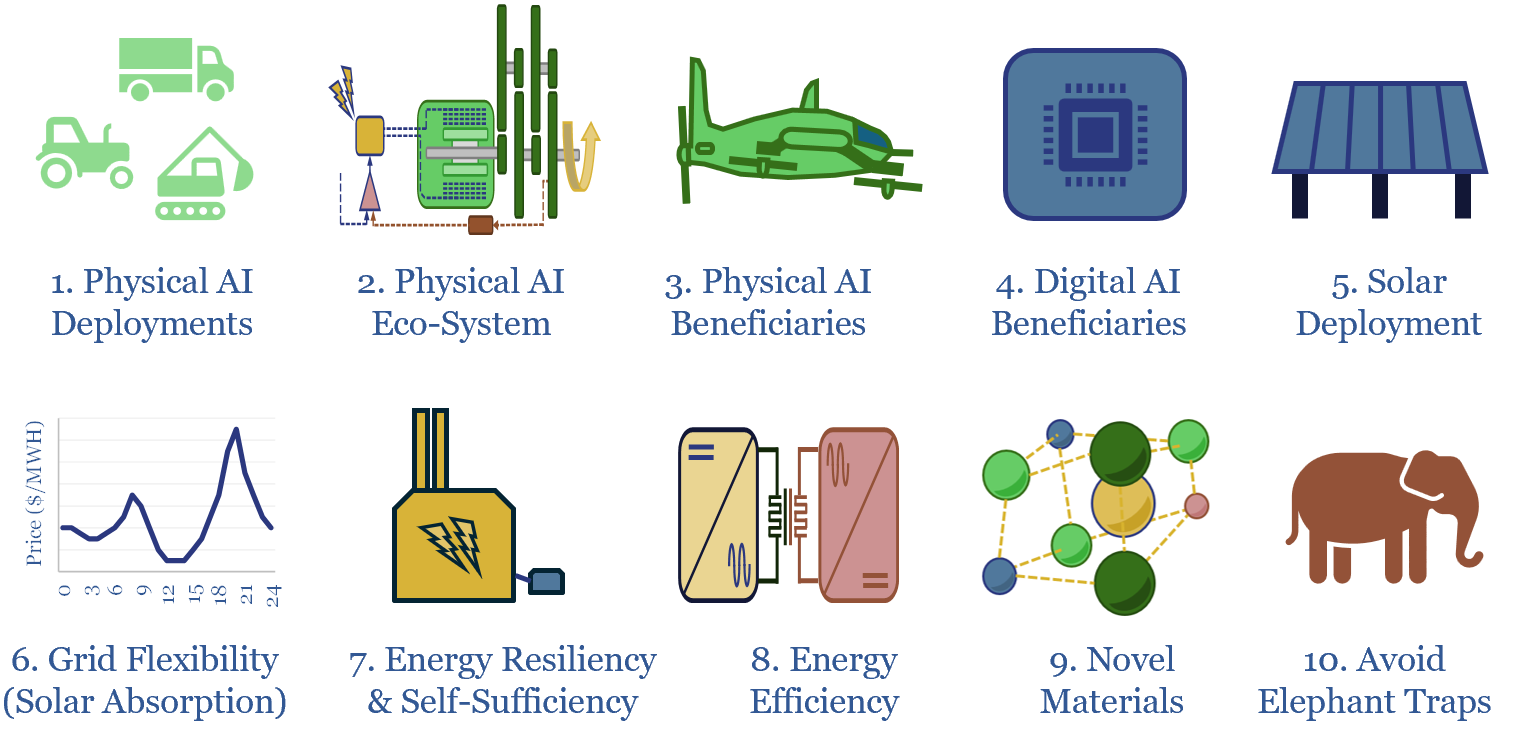
The global energy and industrial landscape is undergoing an AI energy transition. We have also recently published our top ten themes for 2H26. Hence what would be the top ten investment themes for 2026-30, amidst these new technologies, policies and opportunities? This article sets out the ideas that excite us most, with links to supporting…
-
Renewables: share of global energy and electricity by country?
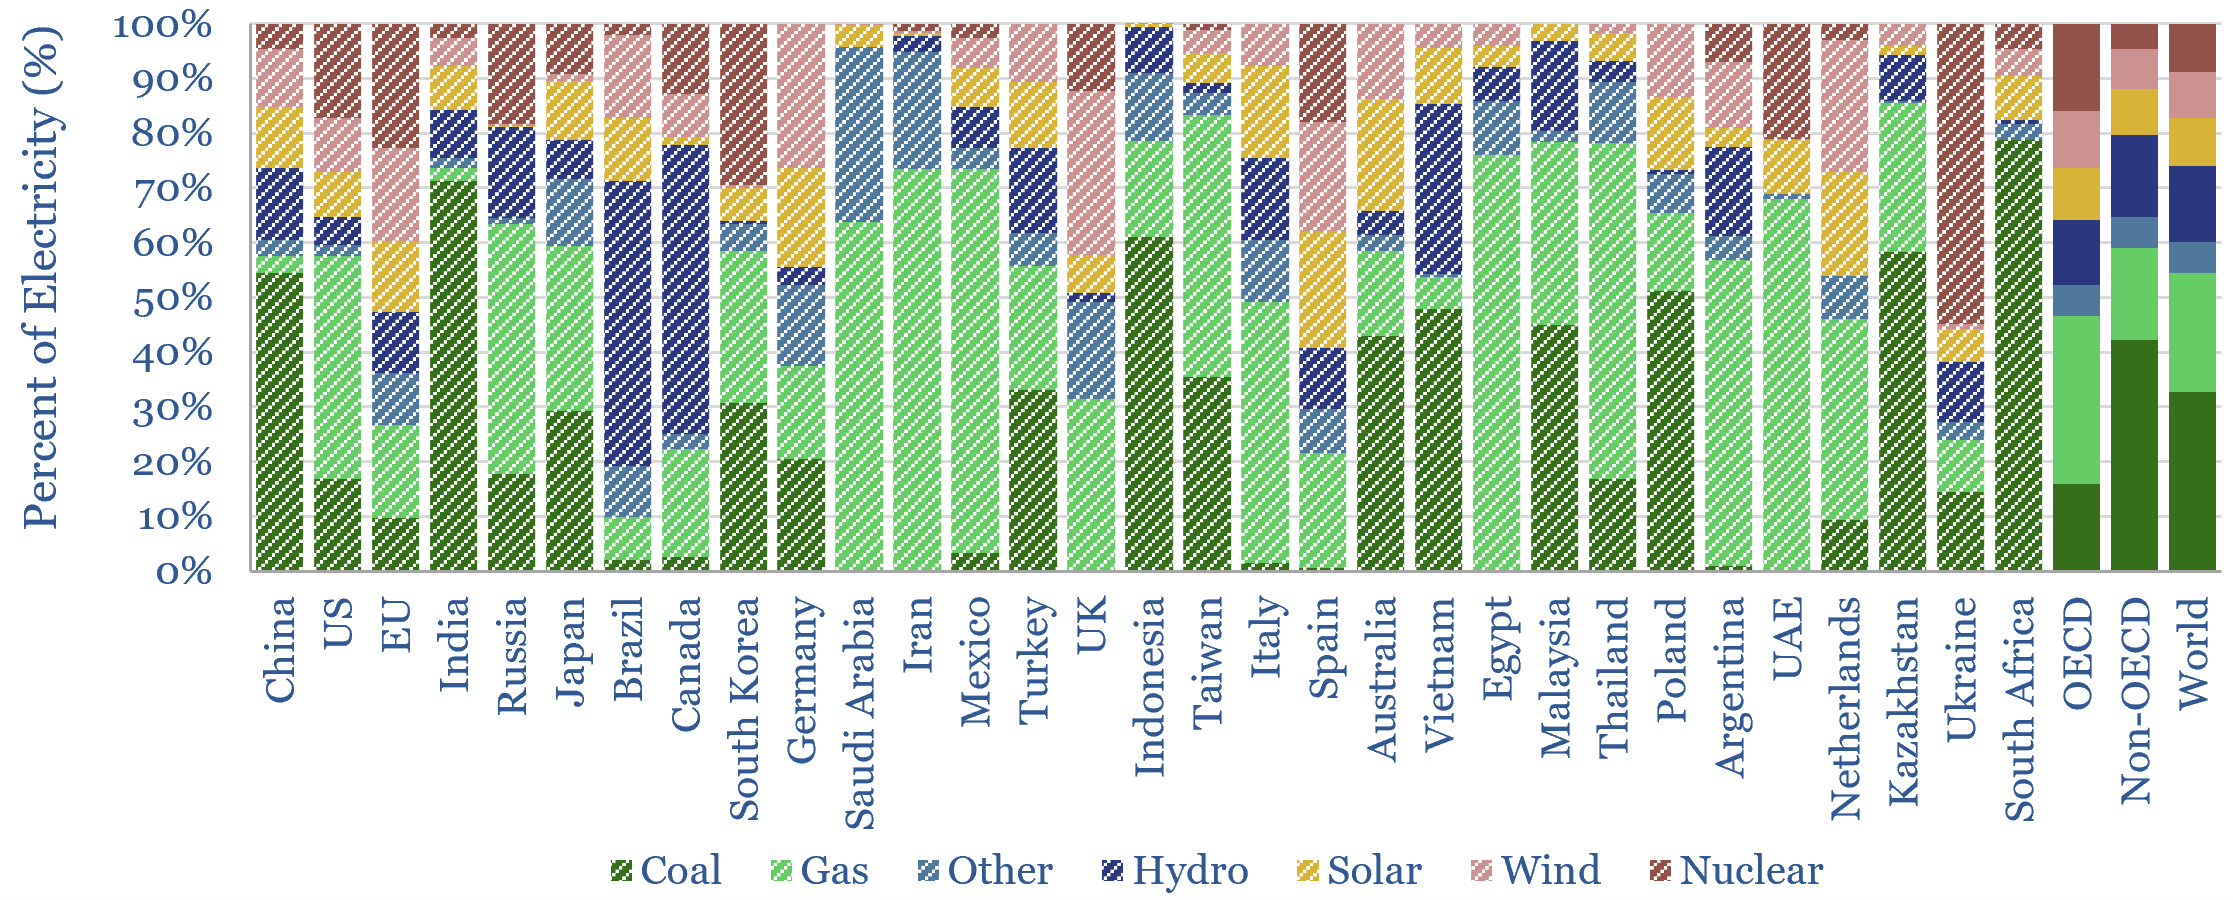
This data-file is an Excel visualizer for some of the key headline metrics around renewables’ share of global energy: such as total global energy use, electricity generation by source, wind penetration and solar penetration; broken down country-by-country, and showing how these metrics have changed over time, in an easy-to-compare visual format.
-
Carbon markets: by category over time?
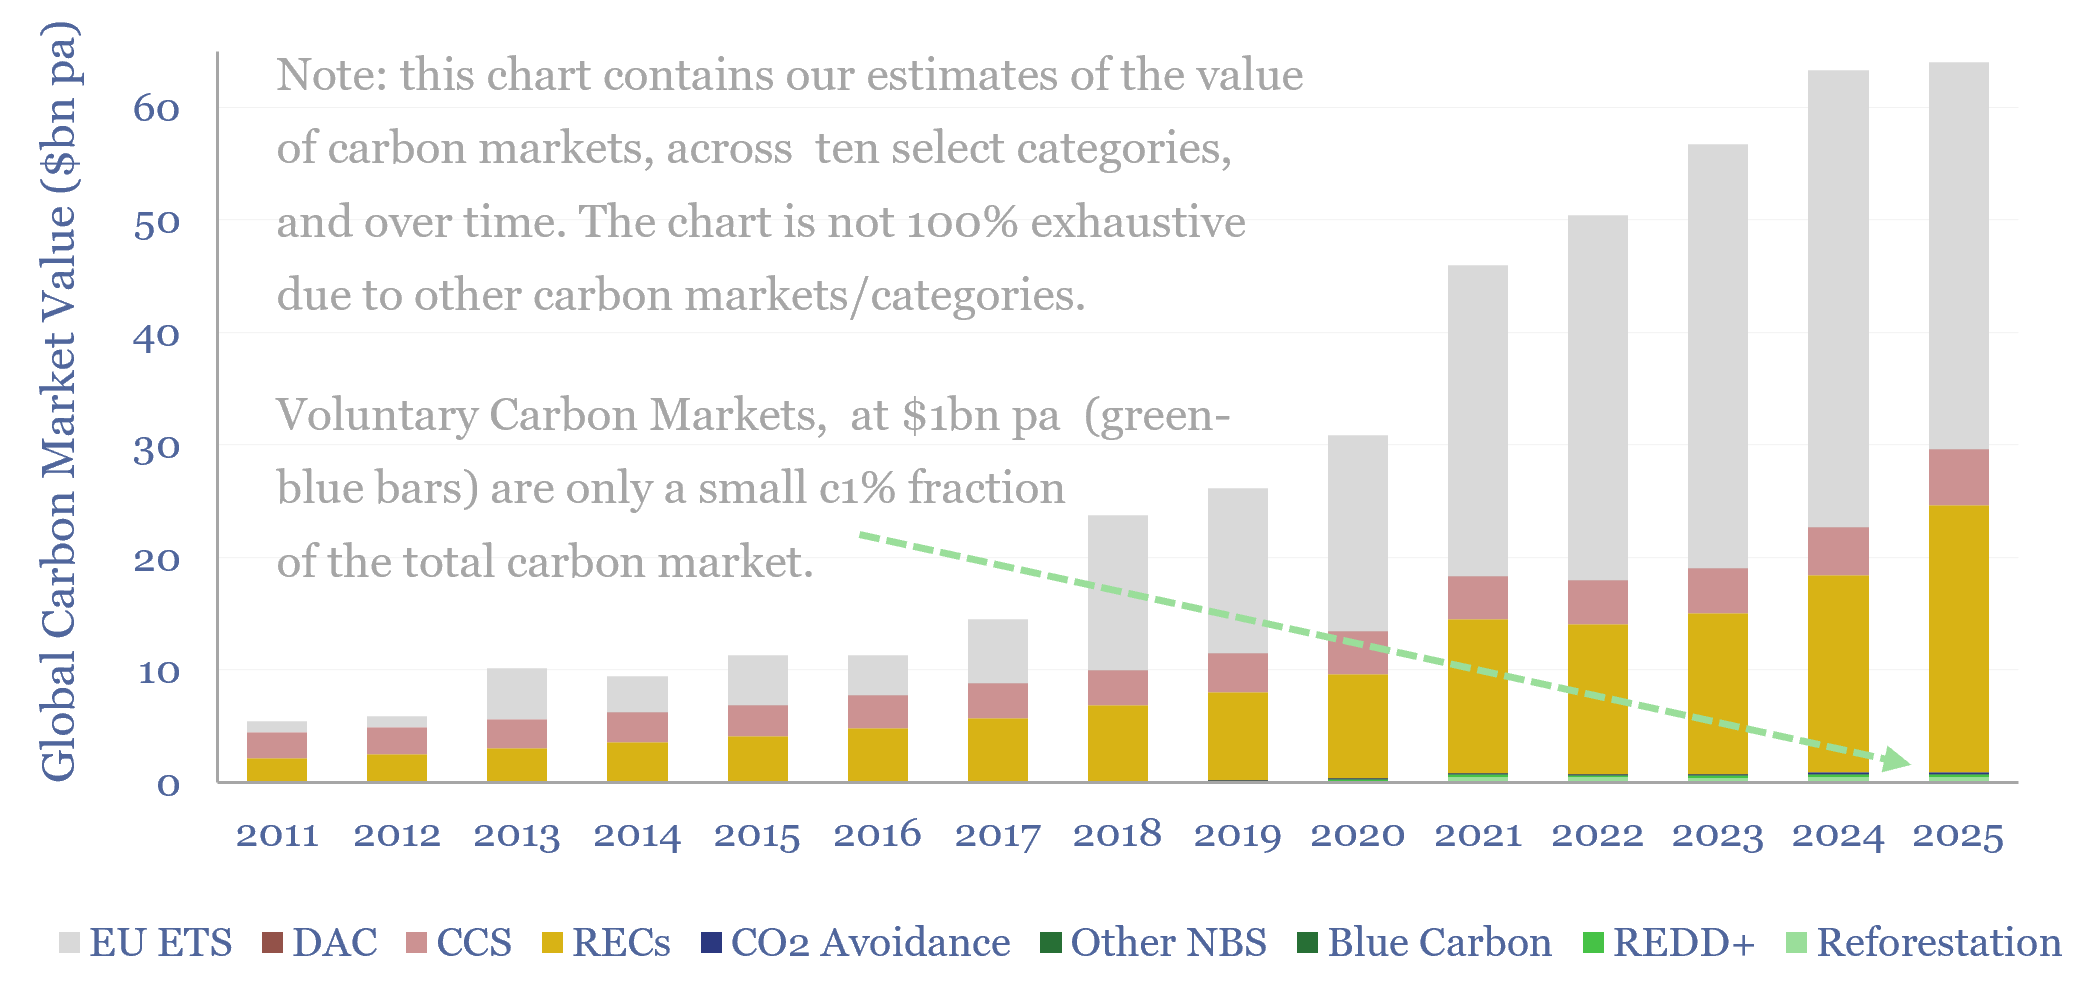
This data-file quantifies global carbon markets by category over time, including the EU ETS as an example of a compliance market, RECs, CCS and VERRA-certified “carbon credits”, across categories such as REDD, reforestation and other “carbon offsets”. We also draw analogies with charitable giving and forecast carbon markets out to 2050.
-
Fervo Energy: enhanced geothermal technology?
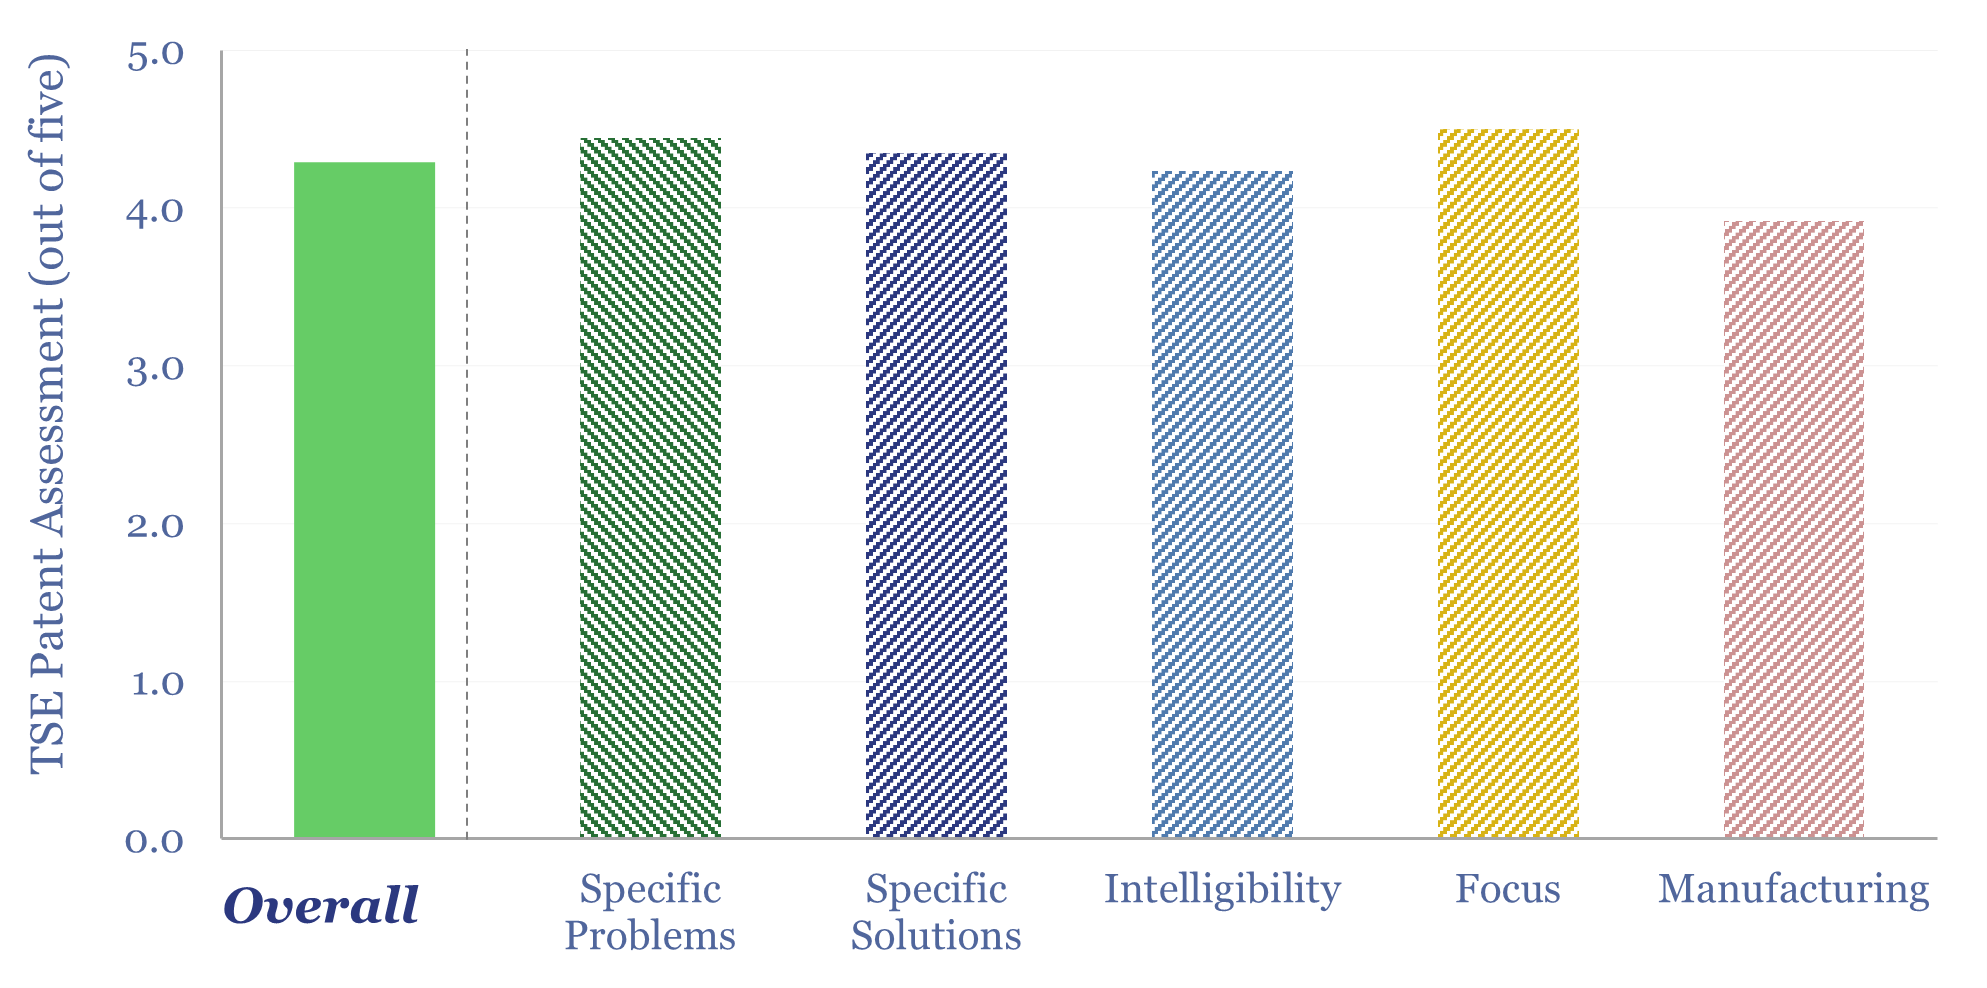
Fervo Energy is a leader in enhanced geothermal systems, harvesting 400°F+ heat from hot, deep rock formations, as fluids flow from fracced horizontal injectors to fracced horizontal producers. This Fervo Energy technology review is based on reviewing a dozen patent families. Fervo draws on fiber optic sensing data to optimize the well completion process and…
-
Wind and solar capacity additions?
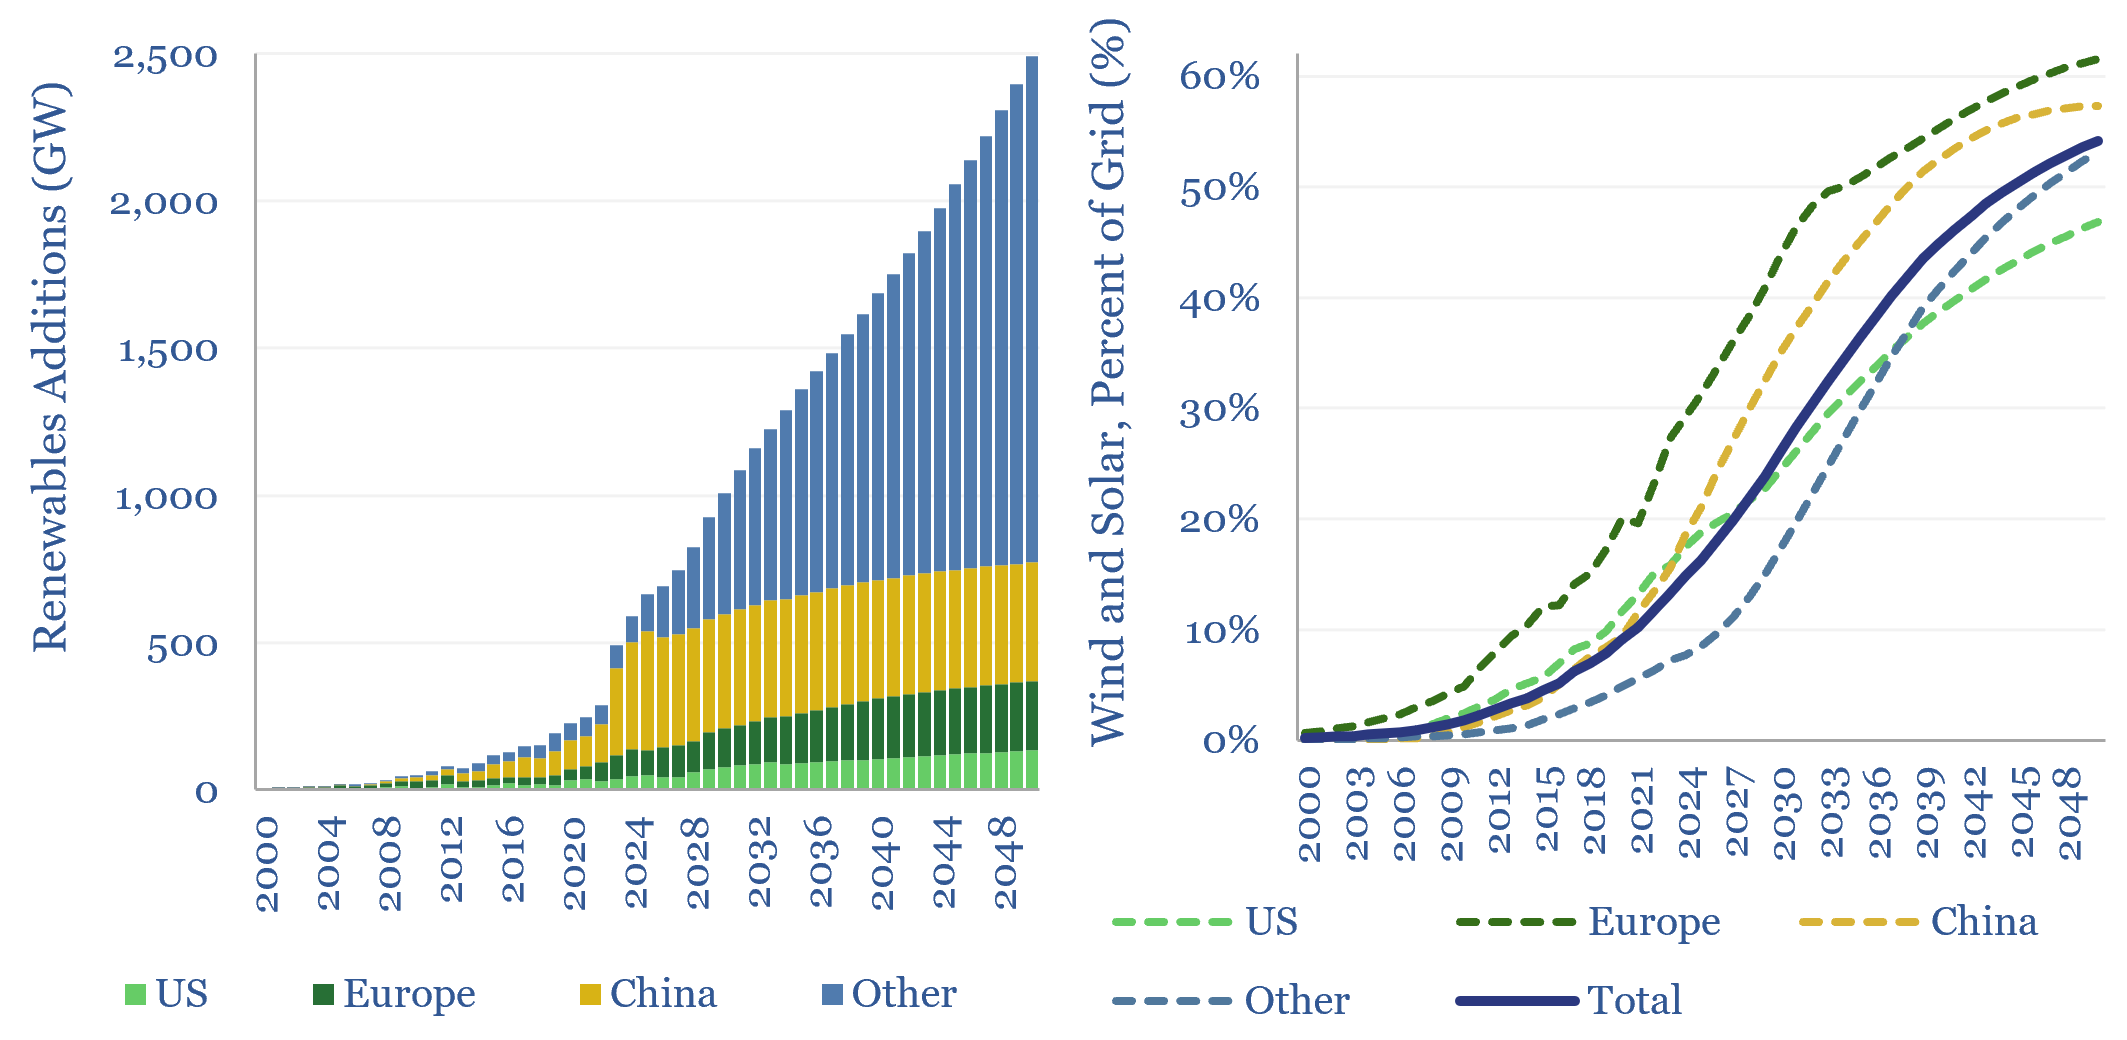
Global wind and solar capacity additions reached 630GW pa (AC-basis) in 2025, which is 3x 2020 levels and 10x 2011 levels. The pace of gross wind and solar capacity additions can rise by a further 3x by 2050, bringing wind and solar to 55% of a greatly expanded global power grid by 2050. Most of…
-
US energy model: oil, gas, power and CO2?
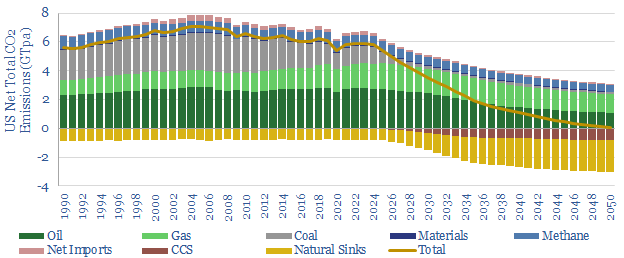
The US consumes 25,000 TWH of primary energy per year, which equates to 13,000 TWH of useful energy, and emits 6GTpa of CO2. This model captures our best estimates for how the US energy system will involve, across oil, gas, coal, nuclear, wind, solar and efficiency gains, and thus the trajectory of CO2 emissions through…
-
Circular economy: is AI a game changer?
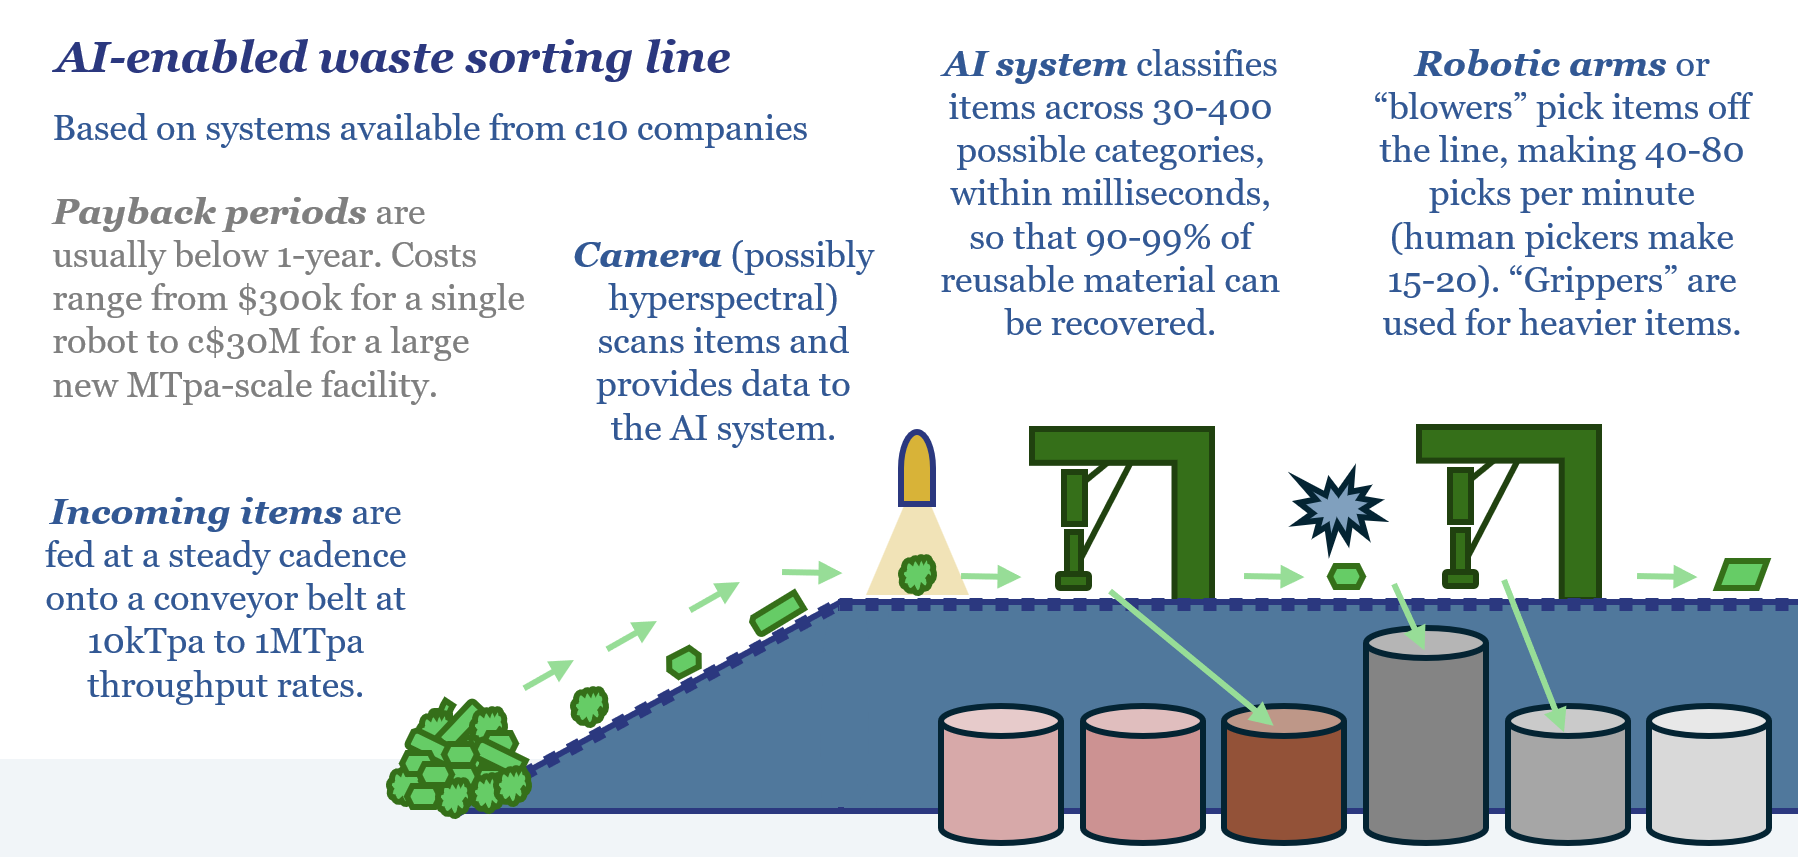
10 companies have recently launched AI-enabled robotics to recover value from the world’s 2.3GTpa of solid waste. Picking rates are 4x faster than humans. c1-year paybacks are quoted. Hence today’s 17-page report explores the implications for gas, power, metals, materials and oil markets, amidst a step-change in the circular economy.
-
The route to net zero: an energy-climate model for 2-degrees
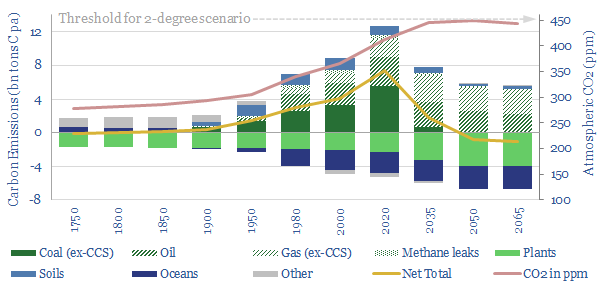
We have modeled the global climate system from 1750-2065, to simplify the science of energy transition. ‘Net zero’ is achievable by 2050. Atmospheric CO2 remains below 450ppm, consistent with 2-degrees warming. Fossil fuel usage is 10% higher than today, but the fossil fuel industry is transformed.
-
Roadmap to net zero: 2025 and beyond?

This 19-page report explores the world’s progress towards net zero, amidst the harsh economic reality of 2025+. Which decarbonization technologies are still progressing, which are scaling back, and why? What if the current trajectory is ultimately seen to be enough?
Content by Category
- Batteries (96)
- Biofuels (44)
- Carbon Intensity (48)
- CCS (64)
- CO2 Removals (9)
- Coal (44)
- Commentary (65)
- Company Diligence (105)
- Data Models (930)
- Decarbonization (163)
- Demand (132)
- Digital (92)
- Downstream (47)
- Economic Model (223)
- Energy Efficiency (76)
- Hydrogen (63)
- Industry Data (311)
- LNG (56)
- Materials (86)
- Metals (90)
- Midstream (45)
- Natural Gas (163)
- Nature (76)
- Nuclear (28)
- Oil (179)
- Patents (39)
- Plastics (44)
- Power Grids (157)
- Renewables (153)
- Screen (139)
- Semiconductors (36)
- Shale (58)
- Solar (73)
- Supply-Demand (53)
- Vehicles (94)
- Video (24)
- Wind (46)
- Written Research (411)