This data-file tabulates global flaring intensity in 16 countries: in absolute terms (bcm per year), per barrel of oil production (mcf/bbl) and as a contribution to CO2 emissions (kg/boe). 2023 saw 148bcm of global flaring, averaging 0.2 mcf/bbl and 10 kg/boe of direct emissions. Lower decile countries flared 0.7 mcf/bbl, which is over 40 kg/boe.
Flaring intensity has reduced by c20% in the past quarter-century, from 0.25mcf/bbl and 12.5kg of CO2/bbl in the early 1990s to 0.2mcf/bbl and 10kg/bbl in 2023.
However, total flaring has fluctuated year by year and is little changed on the levels from a decade ago. This is 1/6th of total oil industry CO2. Or more if you factor in flare’s methane slip.
Industry-leading countries, with the lowest flaring include Saudi Arabia and the US. Saudi Arabia has flared 0.02 mcf/bbl over the past half-decade. The US has flared 0.06 mcf/bbl.
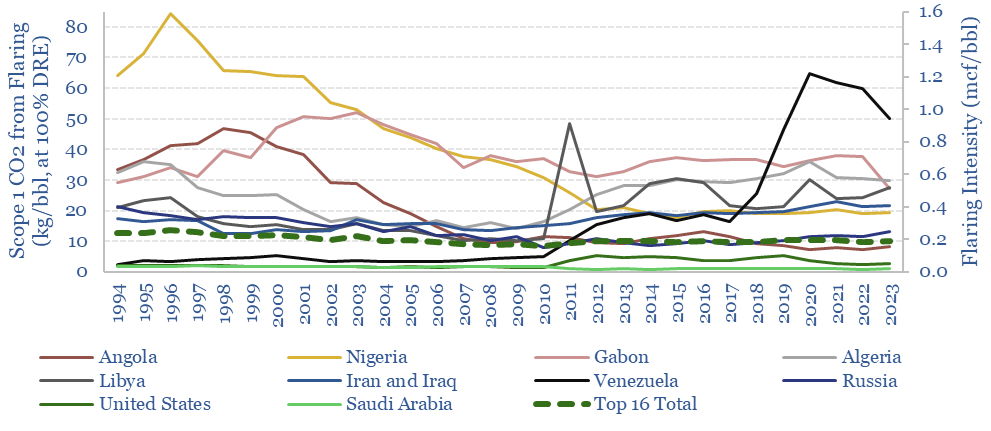
Lagging countries with the highest flaring rates include countries in West Africa, North Africa, Iran/Iraq and Venezuela (which has shown the worst deterioration in the database, since the late 1990s).
LNG’s positive role in reducing flaring stands out from the data. LNG exports were 94% correlated with Nigeria’s flaring reduction since NLNG started up in 1999. Angola has also reduced flaring by 80% since 1998, with Angola LNG “starting up” in 2013. Finally, Equatorial Guinea now has 80% lower flaring than its neighbor, Gabon, since starting up EGLNG in 2007. Some nice charts in the data-file to illustrate this.
Note the source for our data is an excellent resource, the World Bank Flaring Data initiative. We have tabulated, charted and added further metrics and analysis onto this data-set.