Hydrogen
-
Hydrogen: overview and conclusions?
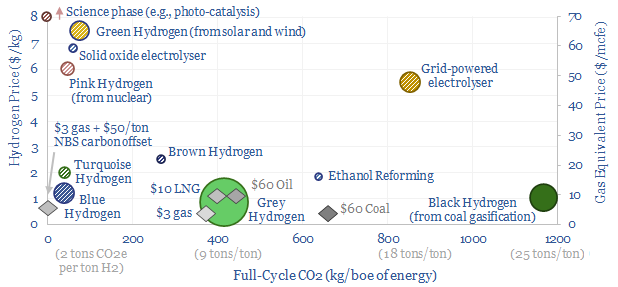
We think the best opportunities in hydrogen will be to decarbonize gas at source via blue and turquoise hydrogen, displacing ‘black hydrogen’ that currently comes from coal, and to produce small-scale feedstock on site via electrolysis for select industries. Others see green hydrogen as a cornerstone of the future energy system. We think there may…
-
Heavy truck costs: diesel, gas, electric or hydrogen?
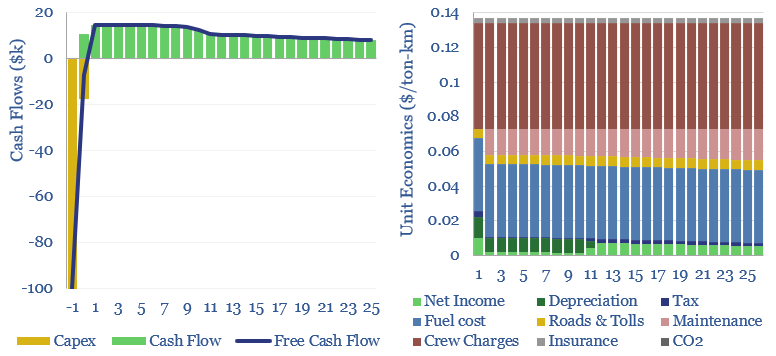
Heavy truck costs are estimated at $0.14 per ton-kilometer, for a truck typically carrying 15 tons of load and traversing over 150,000 miles per annum. Today these trucks consume 10Mbpd of diesel and their costs absorb 4% of post-tax incomes. Hydrogen trucks would be 45-75% more costly, but from 2026, we are starting to see…
-
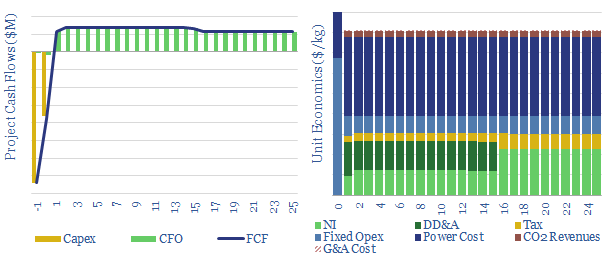
Green hydrogen: the economics?

We have modelled the economics of a green hydrogen project, electrolysing water using renewable energy. An H2 price of $8/kg ($60/mcfe) is required to earn a 10% return. Costs data are captured. The most challenging input variable is not capex cost or efficiency, but utilization rate, if the project is to be truly green.
-
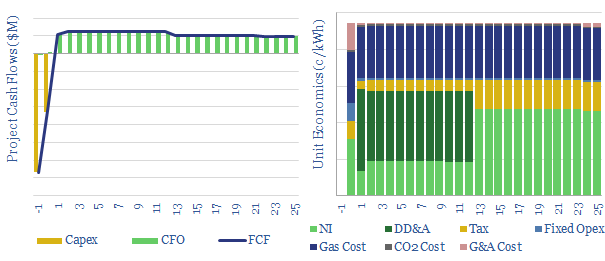
Fuel Cell Power Project Economics

This data-file models the economics of constructing a new fuel-cell power project: generating electricity from grey, blue or green hydrogen. The model is based on technical papers and past projects around the industry. Economics look challenging. Our base case estimate is a 24c/kWh incentive price.
-
Methane reforming: costs of grey hydrogen, costs of blue hydrogen?

This data-file captures the economics of blue hydrogen production via reforming natural gas: either steam-methane reforming or auto-thermal reforming. Costs and operating parameters are compiled from technical papers. Blue hydrogen can be cost-competitive with CCS, while overall costs are most sensitive to gas prices.
-
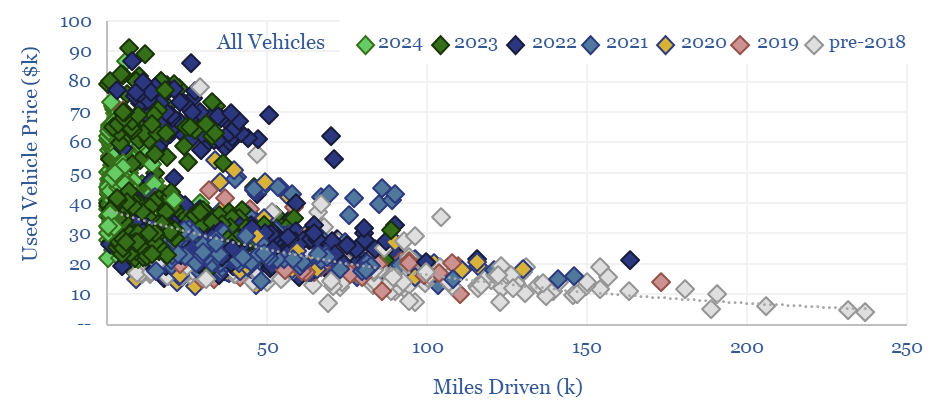
Vehicle depreciation rates: EVs versus ICEs?

This data-file quantifies the cost per mile of vehicle ownership across different categories by correlating second hand car prices with their accumulated mileage. Hybrids and regular passenger cars are most economical. SUVs and EVs are 2x more expensive. Hydrogen vehicles depreciate fastest and will have lost over 90% of their value after 100,000 miles.
-
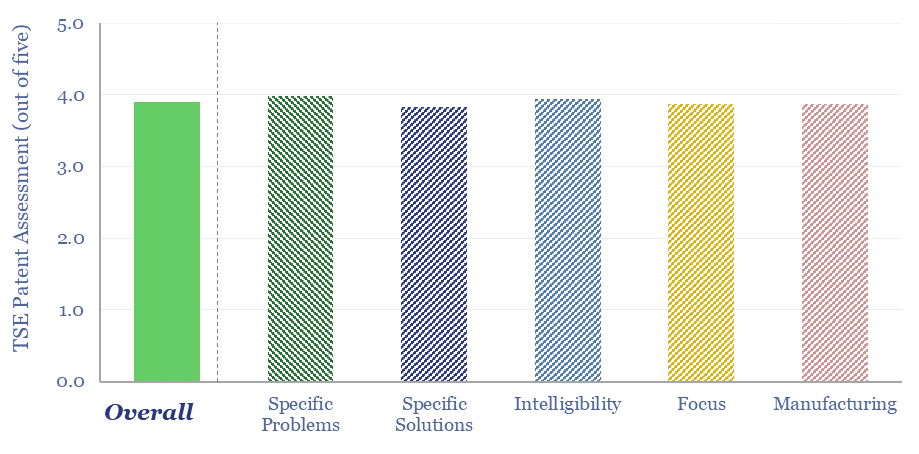
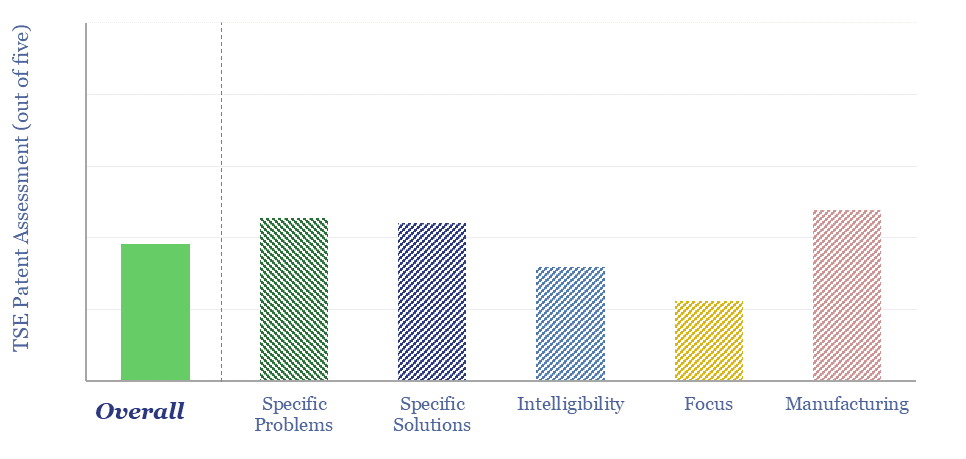
Air Products: ammonia cracking technology?

Can we de-risk Air Products’s ammonia cracking technology in our roadmaps to net zero, which is crucial to recovering green hydrogen in regions that import green ammonia from projects such as Saudi Arabia’s NEOM. We find strong IP in Air Products’s patents. However, we still see 15-35% energy penalties and $2-3/kg of costs in ammonia…
-
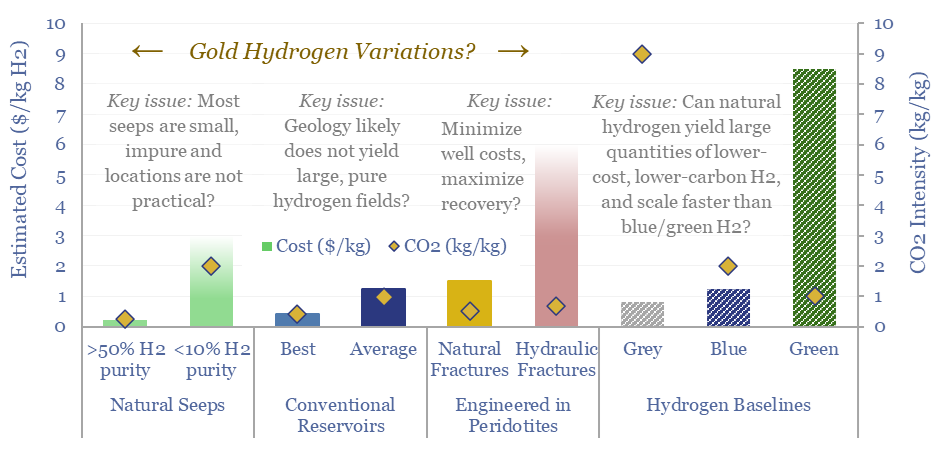
Natural hydrogen: going for gold?

Vast quantities of hydrogen are produced in the Earth’s subsurface, via the Serpentinization of iron-containing Peridotite rocks. Gold, white and orange hydrogen variations aim to harness this hydrogen. This 19-page note explores opportunities, costs and challenges for harvesting H2 out of natural seeps, hydrogen reservoirs or fraccing/flooding Peridotites.
-
Cemvita Factory: microbial breakthroughs?

Cemvita is a private biotech company, based in Houston, founded in 2017. It has isolated and/or engineered more than 150 microbial strains, aiming to valorize waste, convert CO2 to useful feedstocks, mine scarce metals (e.g., direct lithium extraction) and “brew” a variant of gold hydrogen from depleted hydrocarbon reservoirs. This data-file is our Cemvita Factory…
-
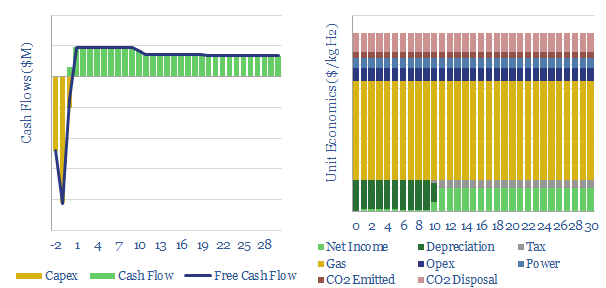
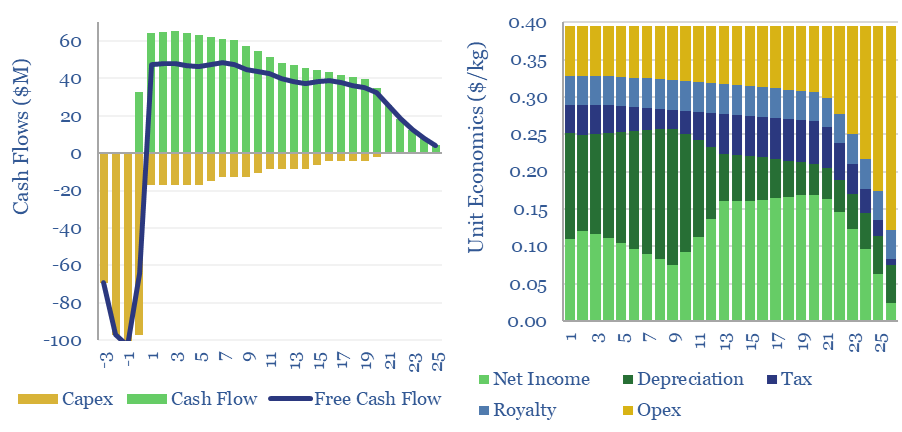
Gold hydrogen: the economics?

Natural hydrogen could be recovered from the Earth’s subsurface, with costs ranging from $0.3-10/kg, and CO2 intensities of 0.2-5.0 kg/kg. This data-file models the economic costs of gold hydrogen, and its sub-variants such as white hydrogen and orange hydrogen.
Content by Category
- Batteries (96)
- Biofuels (44)
- Carbon Intensity (48)
- CCS (64)
- CO2 Removals (9)
- Coal (44)
- Commentary (65)
- Company Diligence (105)
- Data Models (927)
- Decarbonization (162)
- Demand (131)
- Digital (89)
- Downstream (47)
- Economic Model (222)
- Energy Efficiency (76)
- Hydrogen (63)
- Industry Data (310)
- LNG (56)
- Materials (86)
- Metals (89)
- Midstream (45)
- Natural Gas (163)
- Nature (76)
- Nuclear (28)
- Oil (178)
- Patents (39)
- Plastics (44)
- Power Grids (156)
- Renewables (153)
- Screen (138)
- Semiconductors (35)
- Shale (58)
- Solar (72)
- Supply-Demand (53)
- Vehicles (94)
- Video (24)
- Wind (46)
- Written Research (409)