Solar costs have deflated by 70% in the past decade to $800/kW in 2025. 60% has been the scale-up to mass manufacturing, and 40% has been rising efficiency of solar modules. Doubling the efficiency, and thereby the output of solar modules, can once again halve solar costs over time, perhaps in the next decade?
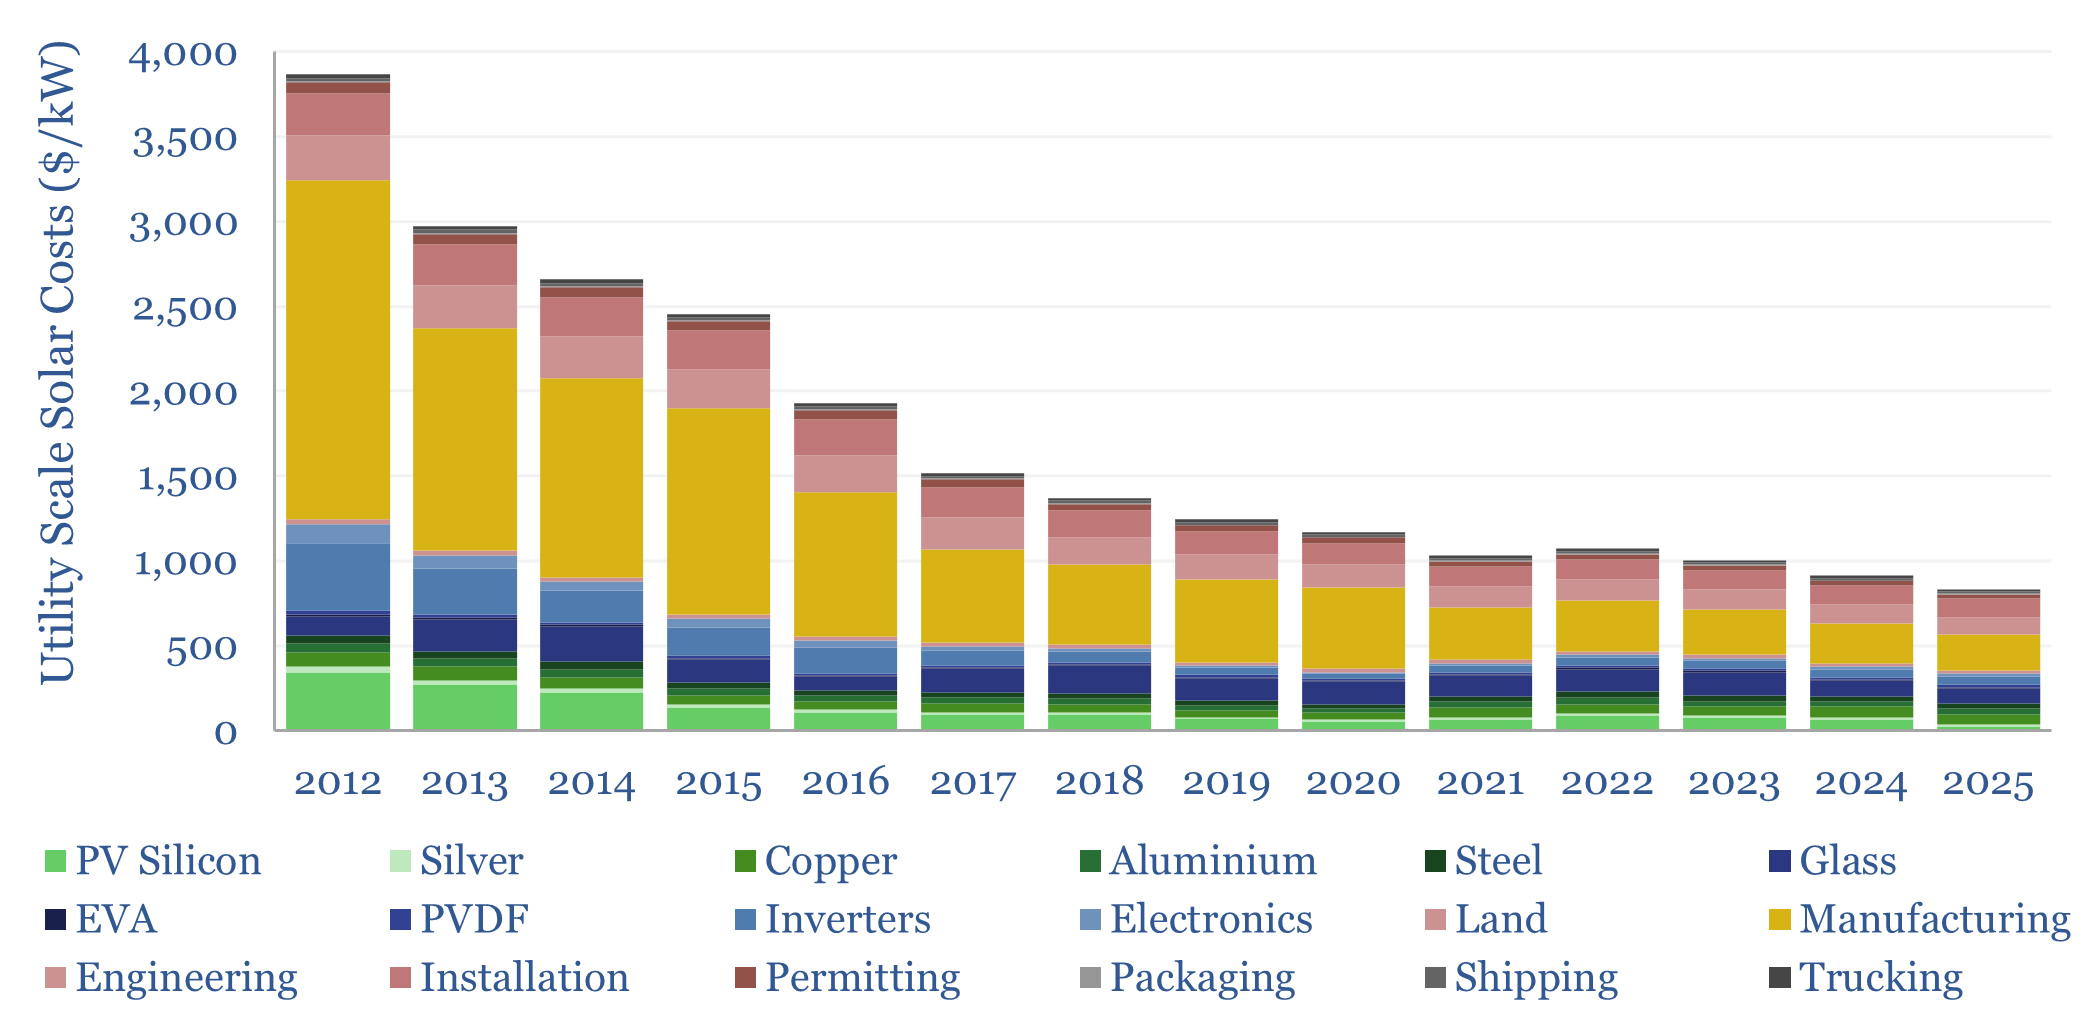
Solar costs have deflated from $4,000/kW to $800/kW from 2012 to 2025, as measured at utility scale solar projects, using our solar bill of materials, and global commodity price databases.
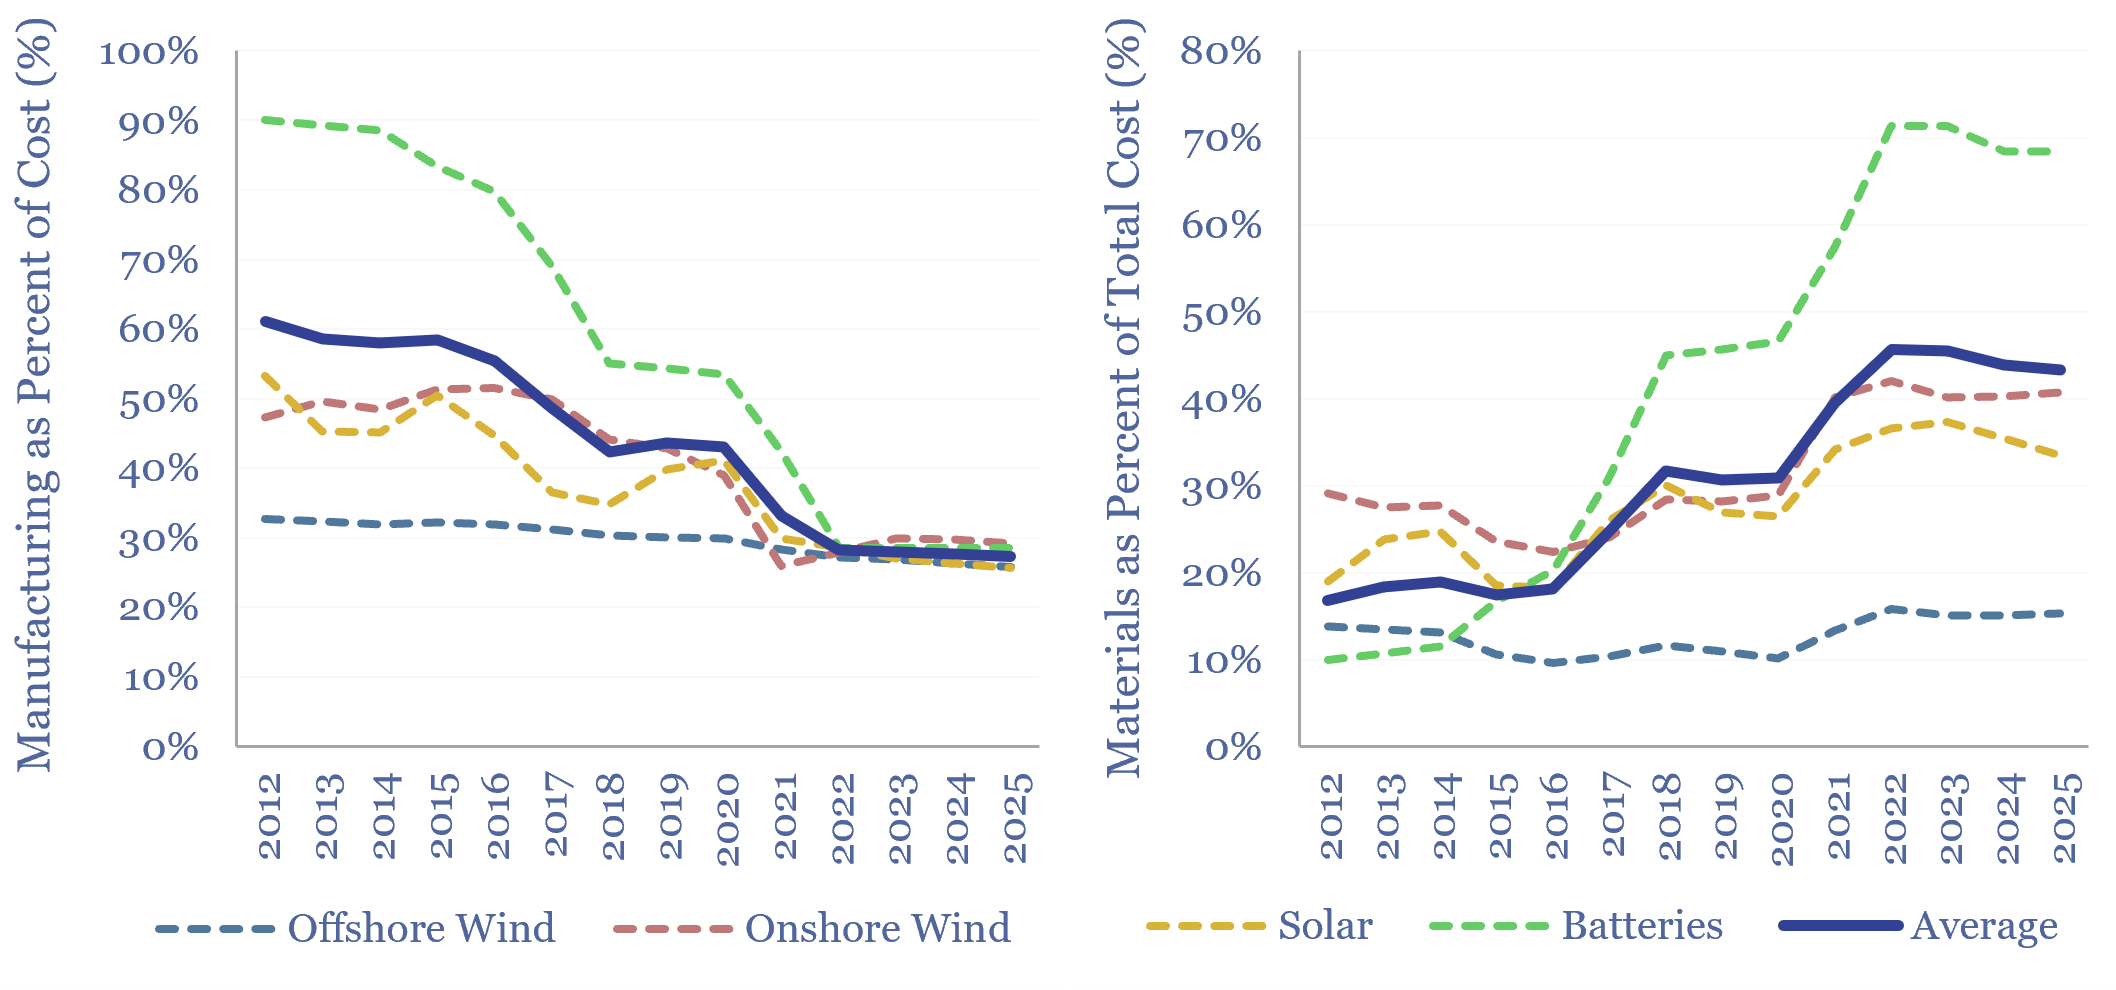
60% of solar cost deflation in the past decade has come from the scale-up to mass manufacturing: as solar installations scaled up by 17.5x to well over 700GW per year, manufacturing fell from 50% to 25% of the total installed costs of a utility-scale project.
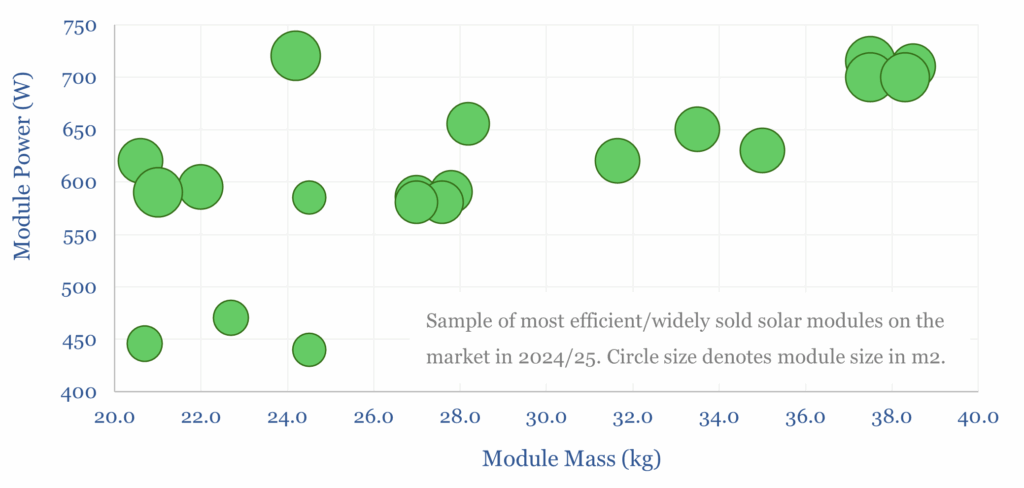
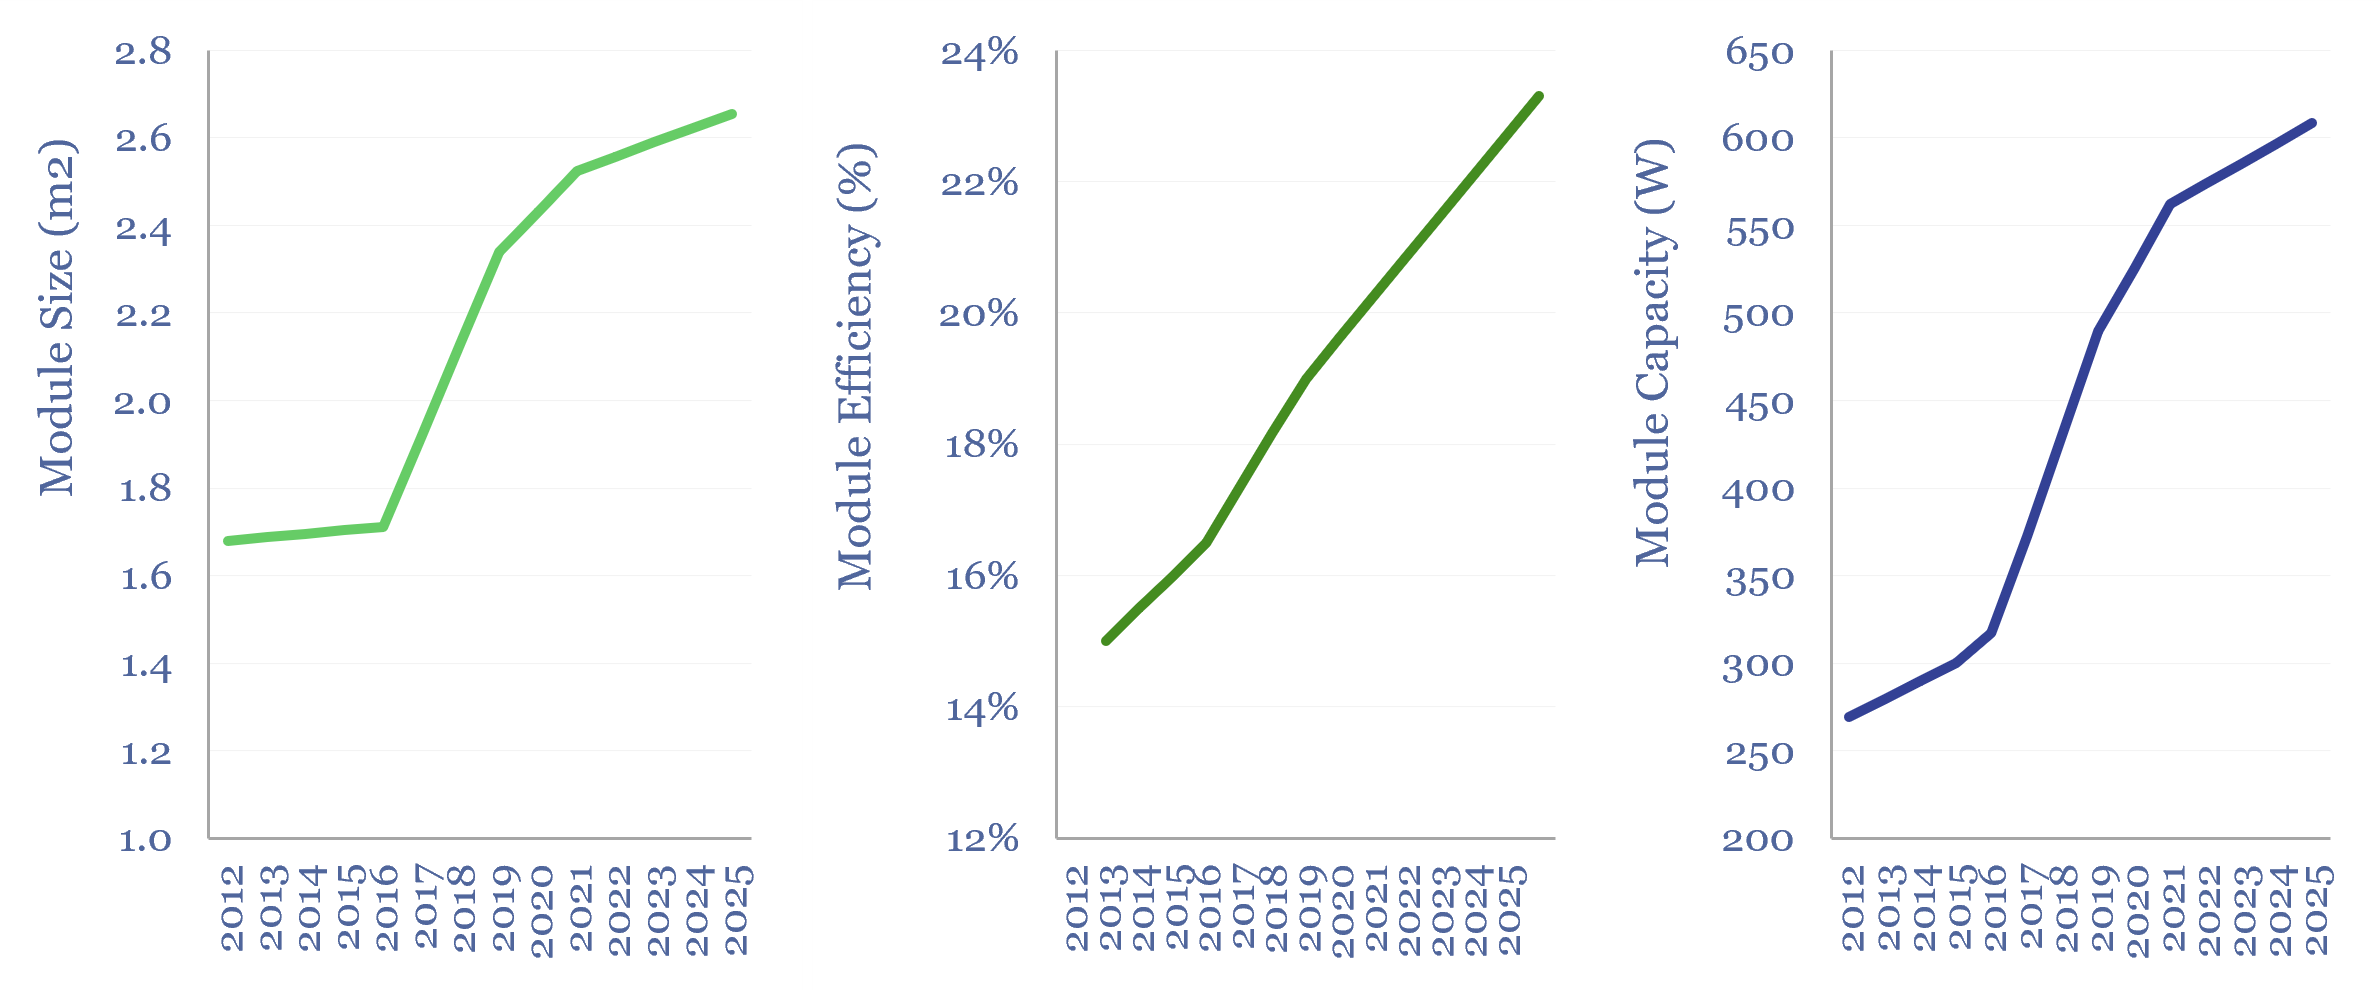
Efficiency gains drove the other 40% of the deflation, as the average solar panel in 2025 produces 2.5x more power than in 2012, with efficiency rising from 15% to 23% and module size rising from 1.7m2 to 2.7m2.
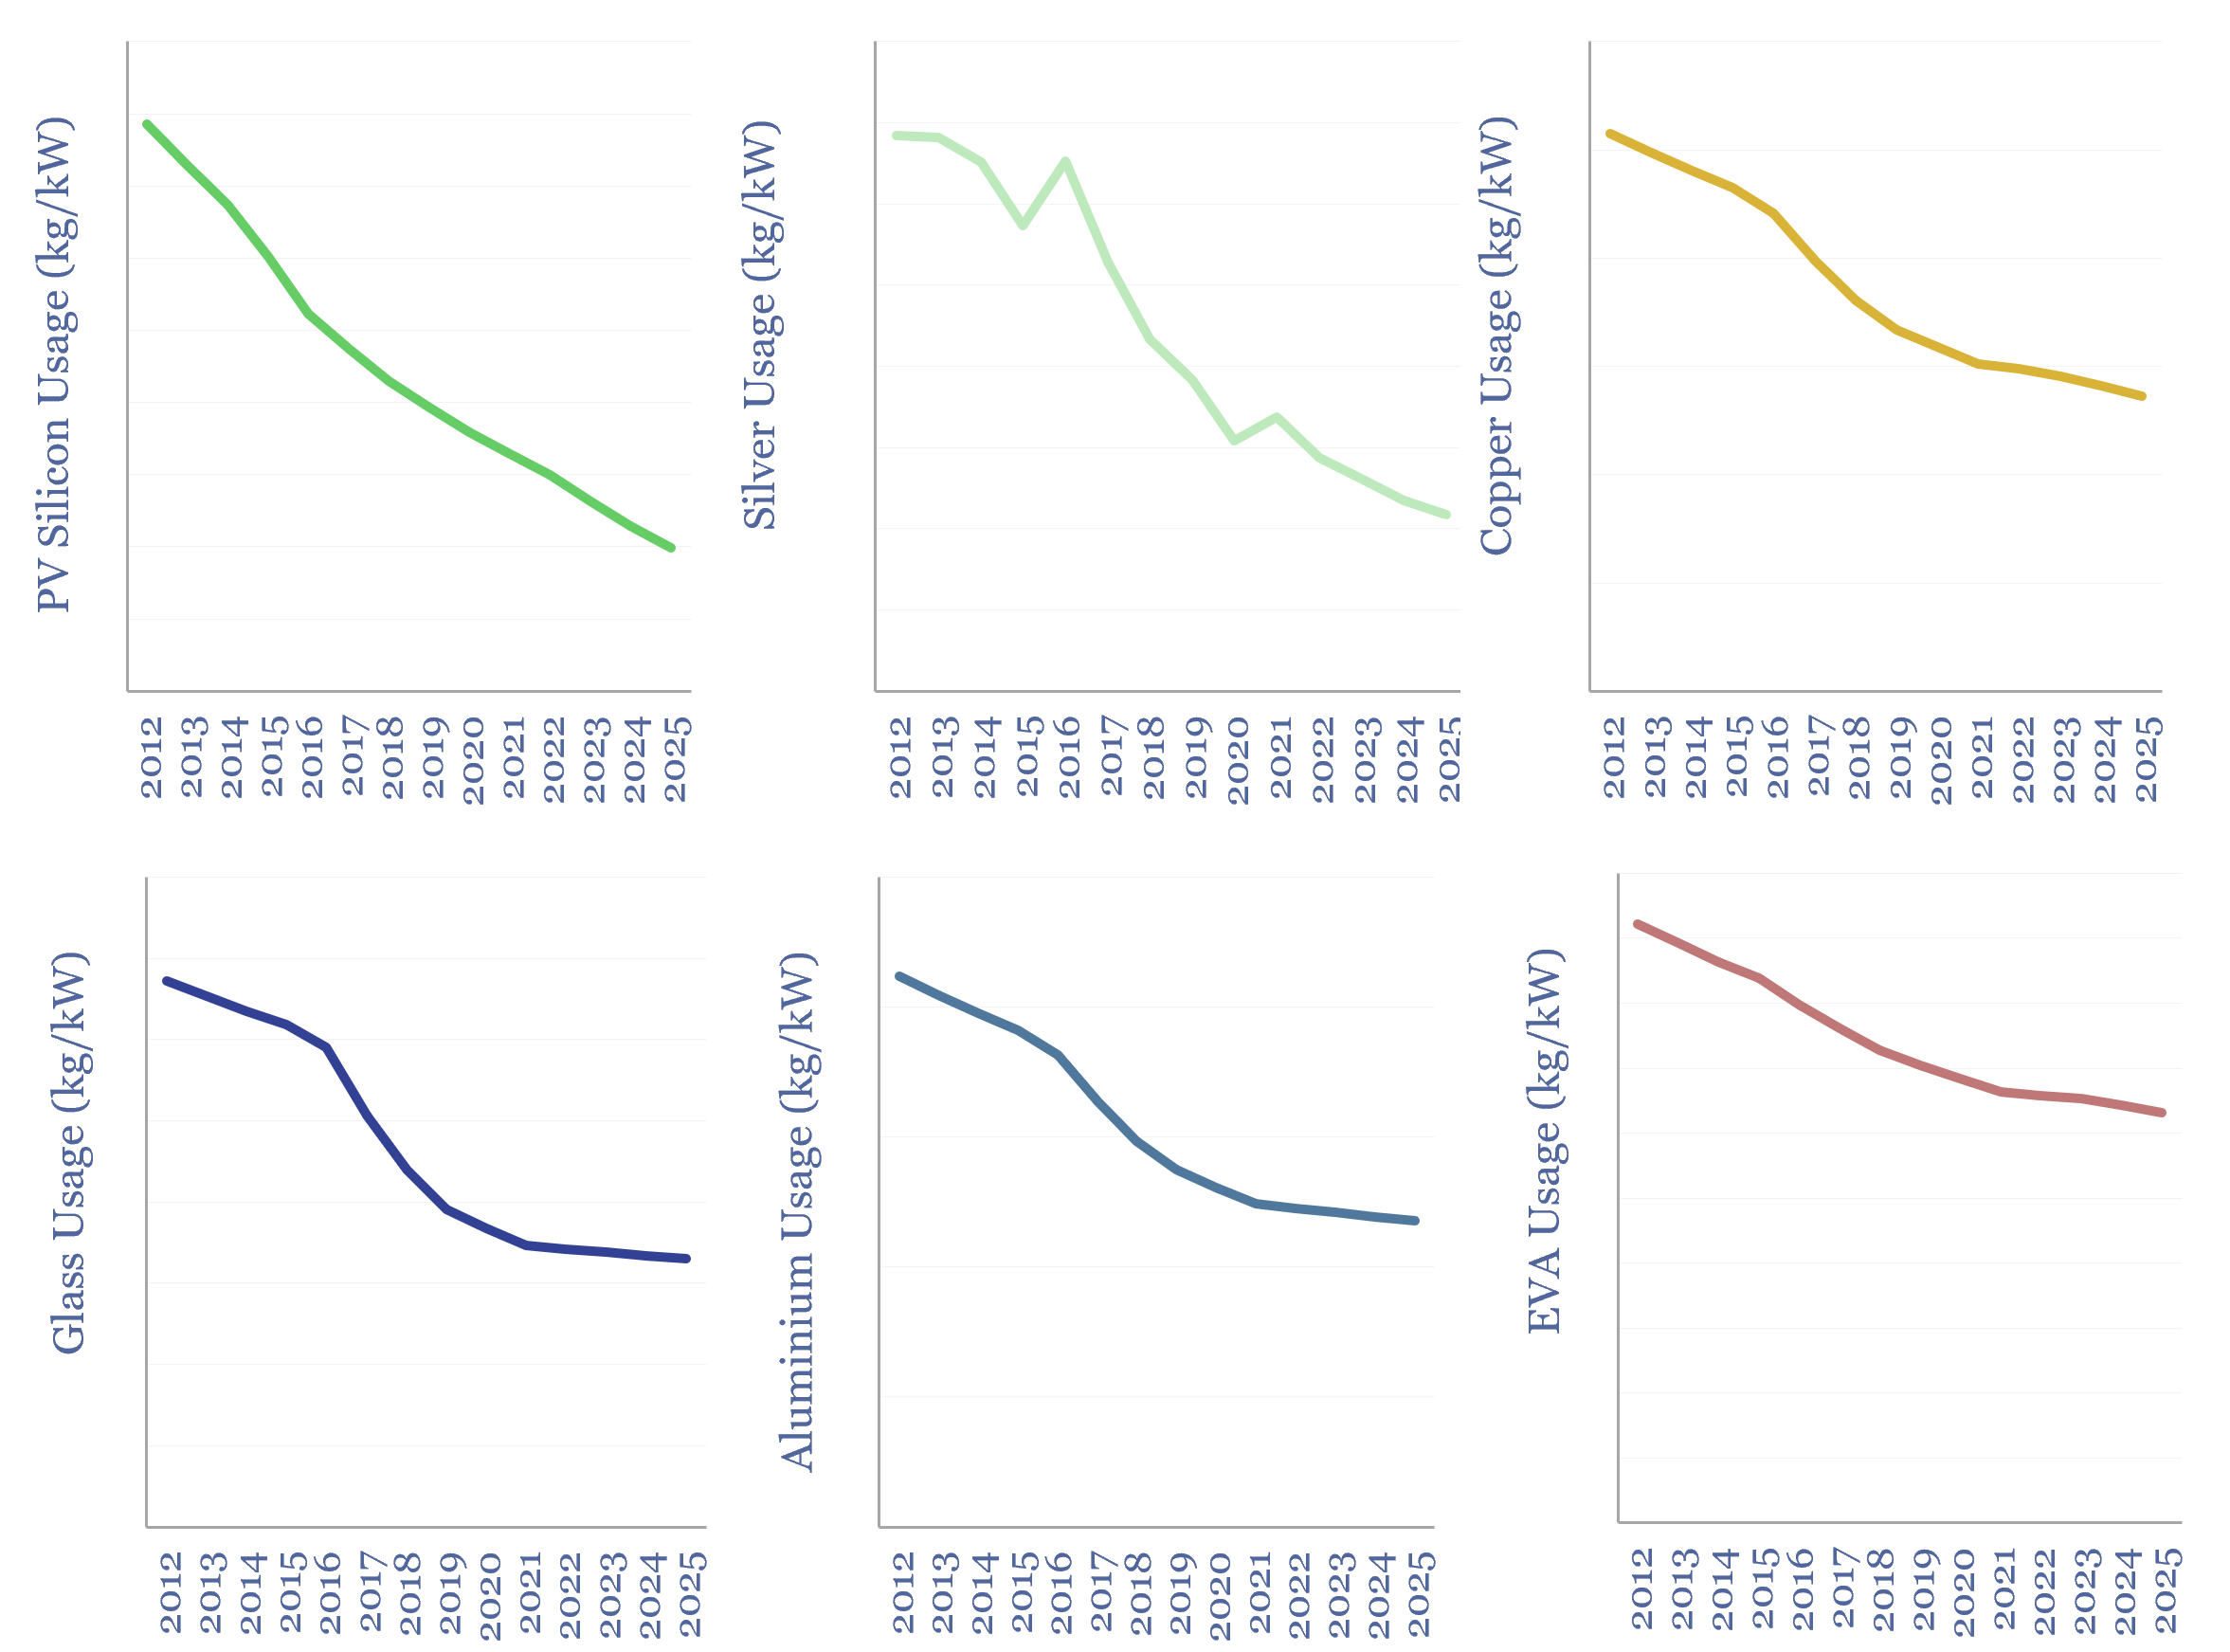
Efficiency gains are the best form of deflation, because they lower the per kW costs of all fixed cost line items, from permitting to installation. Including materials costs. When a similar amount of material per module — sometimes even less material per module — delivers more kW of power, this reduces the cost of materials in $/kW terms.
Our analysis into fast-evolving solar technology – HJT modules, tandem perovskites – suggests that higher grade materials and manufacturing processes can potentially double solar efficiency again from here, and we wonder if this creates large opportunities for advanced materials and manufacturing technologies.
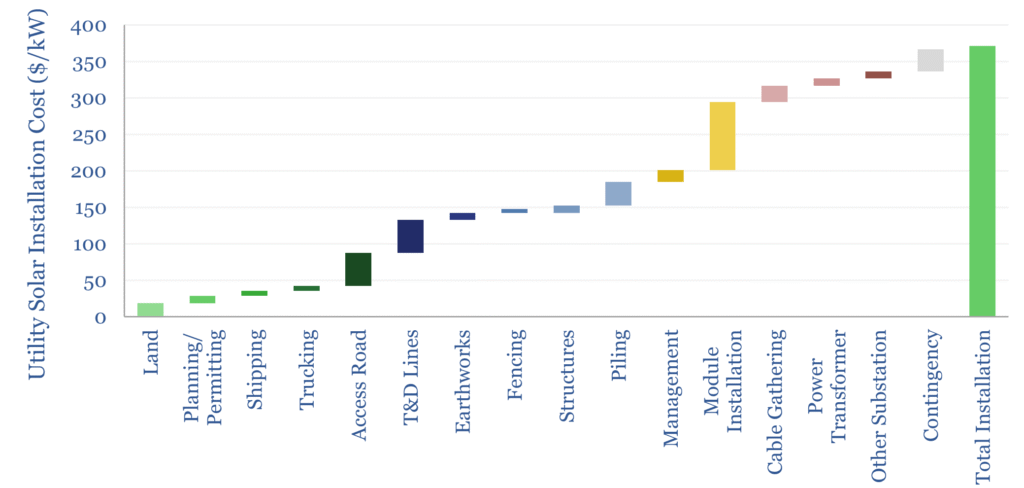
Solar installation costs are also disaggregated across 15 categories in the data-file, drawing on our prior models of earthworks, piling, transmission, cable-trenching, power electronics, road construction, shipping and trucking.
The data-file also aggregates similar breakdowns of materials, manufacturing and installation costs for other new energies, such as wind and batteries, in order to draw some useful comparisons and contrasts.
Solar costs over time are also disaggregated across 45 lines in the data-file, including input variables that can be flexed, to stress-test different scenarios for future solar costs.