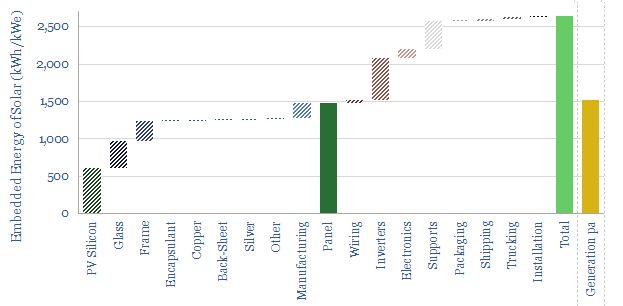
What is the energy payback and embedded energy of solar? We have aggregated the consumption of 10 different materials (in kg/kW) and around 10 other line-items across manufacturing and transportation (in kWh/kW). Our base case estimate is 2.5 MWH/kWe of solar. The average energy payback of solar is 1.5-years. Numbers and sensitivities can be stress-tested in the data-file.
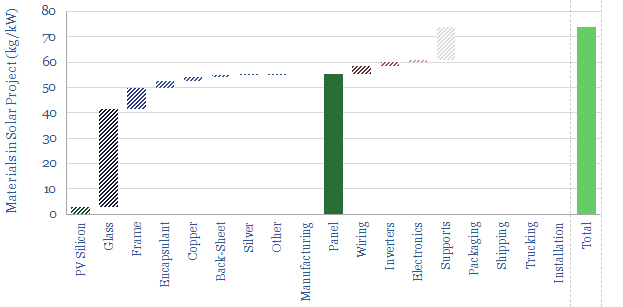
Our base case estimate covers a standard 560W solar panel, as is being manufactured in 2022-23, weighing 30kg, and having an efficiency of 22%.
By mass, this solar panel is about 65% glass, 15% aluminium, c10% polymers (mainly EVA encapsulants and PVF back-sheet), c3% copper. Photovoltaic silicon is only 5% of the panel by mass, but about 40% by embedded energy.
Another 10kg of material is contained in the balance of project, across inverters, wiring, structural supports, other electronics. Thus the energy embedded in manufacturing the panel is likely only around 60% of the total energy embedded in a finished solar project.
Our base case is that it will take around 2.5 MWH of up-front energy and release almost 3 tons of CO2 per kW of installed solar capacity. In turn, this suggests an energy payback of around 1.5-years and a CO2 payback of around 1.8-years.
The complexity of the solar value chain is enormous. Often it is also opaque. Thus the numbers can vary widely. We think there will be solar projects installed with an energy payback around 1-year at best and around 4-years at worst.
Our numbers do not include energy costs of power grid infrastructure or battery back-ups. This is simply a build-up for a vanilla project, trying to be as granular and objective as possible.
Inputs for the embedded energy and CO2 of different materials are drawn from our other CO2 screening work and economic models.
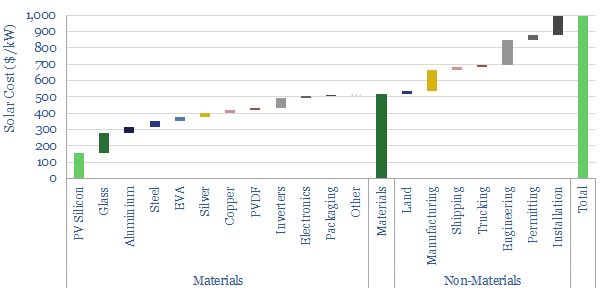
The other great benefit of constructing a detailed bill of materials for a solar installation is that we can use it to inform our solar cost estimates. Our best guess is that materials will comprise around half of the total installed cost of a solar installation in 2021-22 (chart below). There is going to be a truly remarkable pull on some of these materials from scaling up solar capacity additions.
We absolutely want to scale solar in the energy transition. This will be easiest from a position of energy surplus.
Please download the data-file to stress test our numbers around the embedded energy needed to construct a solar project, and the energy payback of solar.