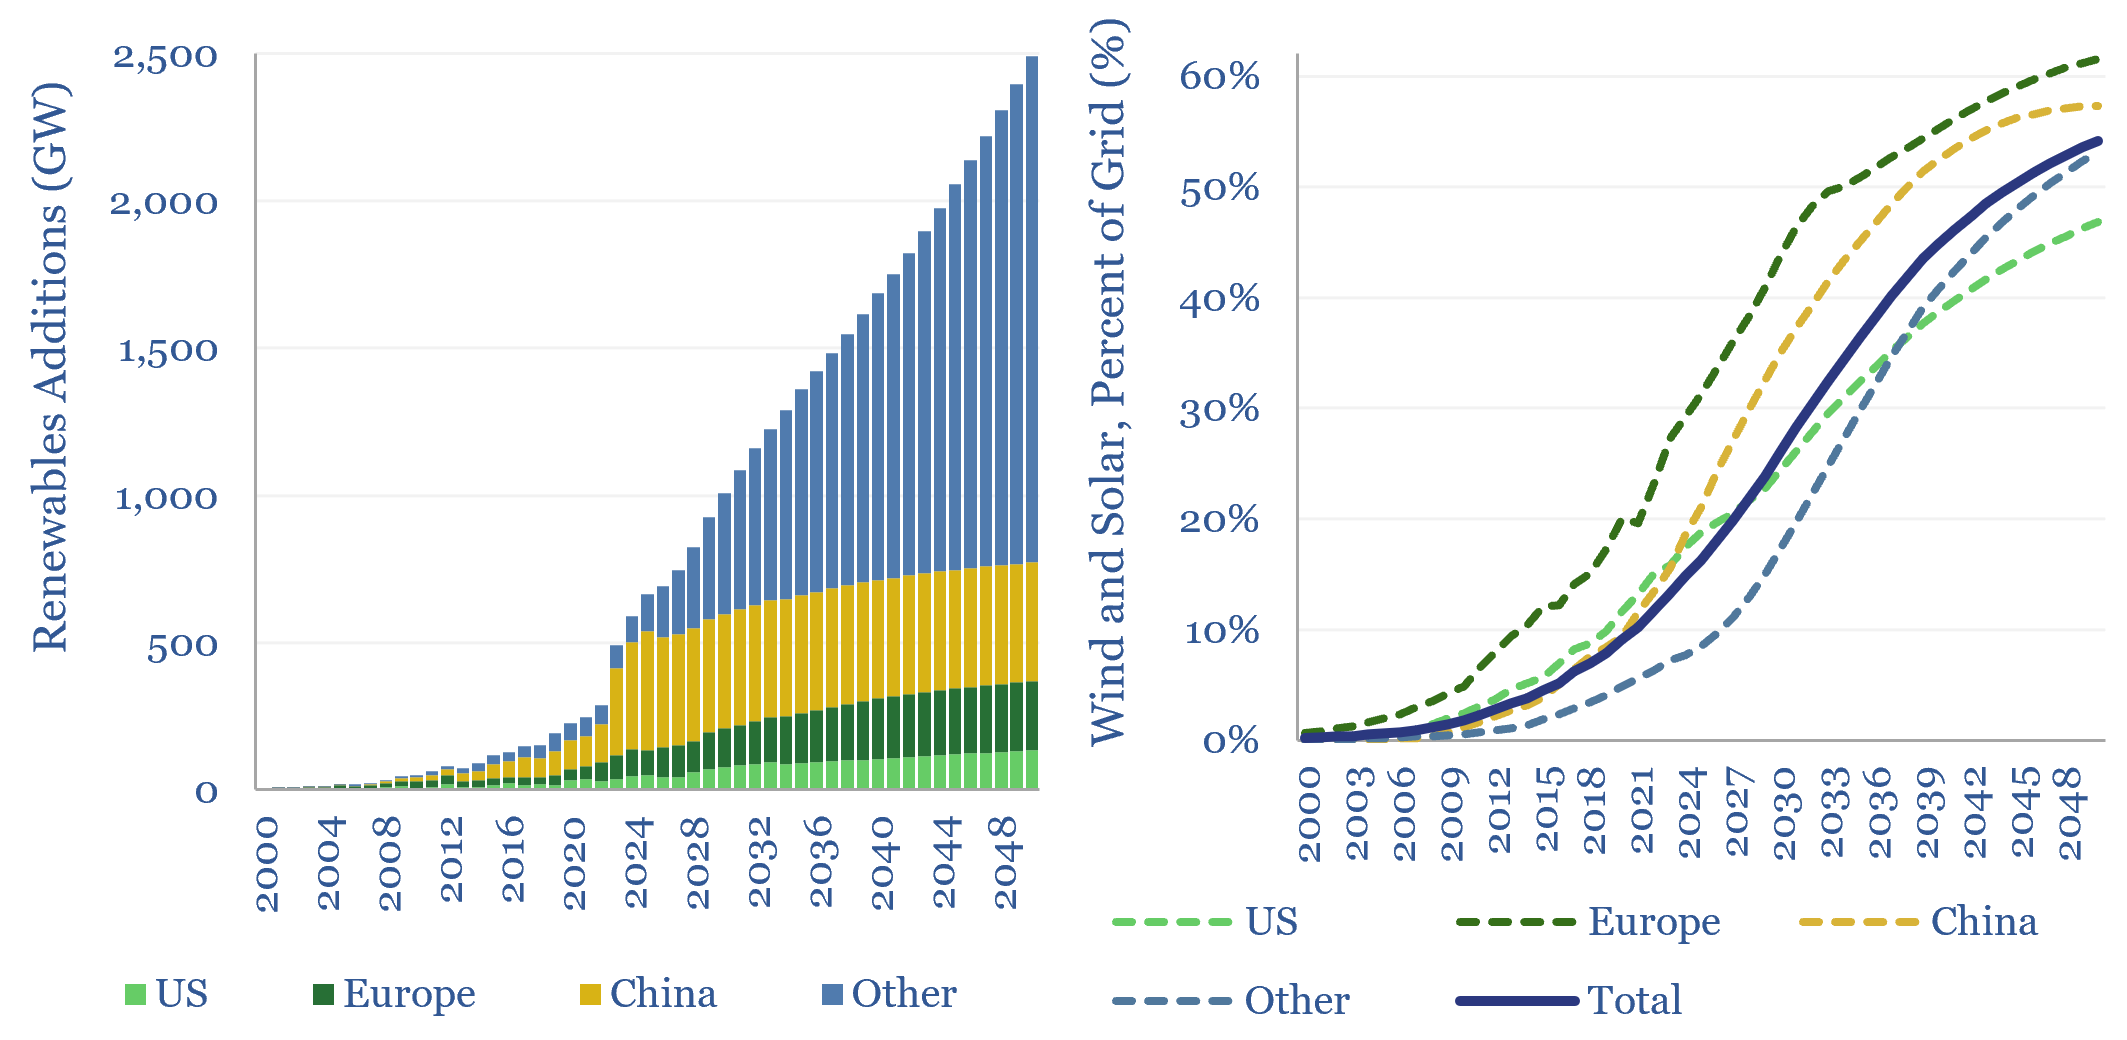
Global wind and solar capacity additions surpassed 600GW pa (AC-basis) in 2025, which is 3x 2020 levels and 10x 2011 levels. The pace of gross wind and solar capacity additions can rise by a further 3x by 2050, bringing wind and solar to 55% of a greatly expanded global power grid by 2050. Most of the upside is in solar.
Global wind and solar capacity additions are modeled in granular detail in this data-file. Solar forecasts are captured at both the AC project level and DC module level, region by region, from 1990 to 2050.
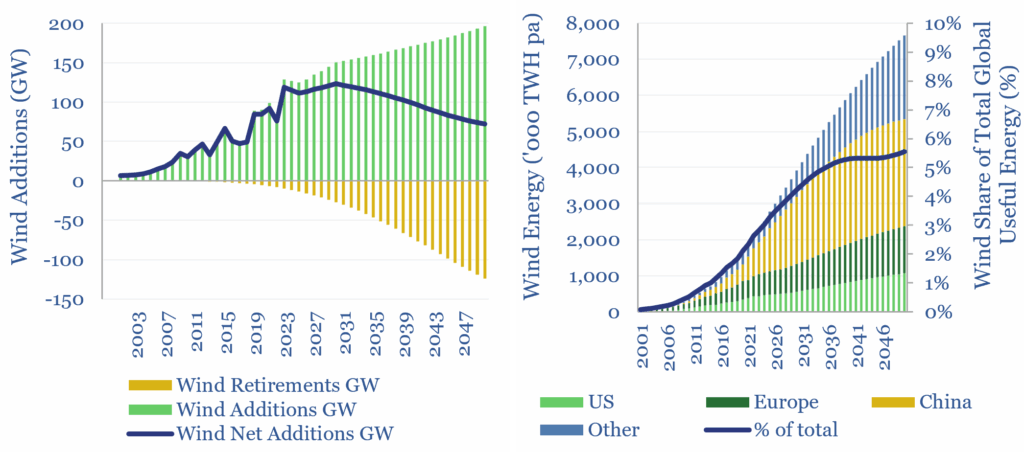
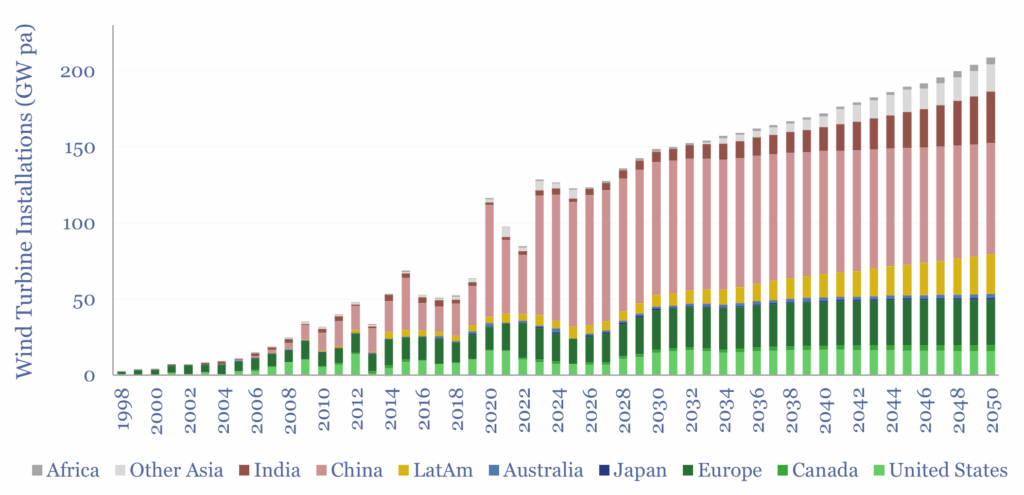
Global wind capacity additions reached 126 GW pa on a gross basis in 2024, which is seen increasing to 200 GW pa on a gross basis in 2050, and ultimately boosting wind generation above 7,000 TWH pa by 2050, or 5% of total global energy. These forecasts are informed by our wind research.
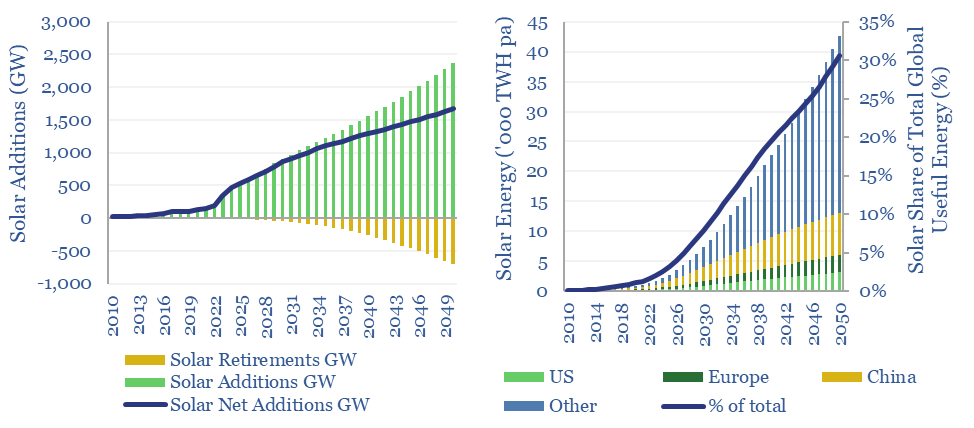
Global solar additions, on a DC basis, surpassed 650GW pa, which is seen quadrupling by 2050, propelling solar to 40,000 TWH of global useful energy, or 30% of the global total by 2050. An energy transition is underway towards semiconductors. These forecasts are informed by our solar research.
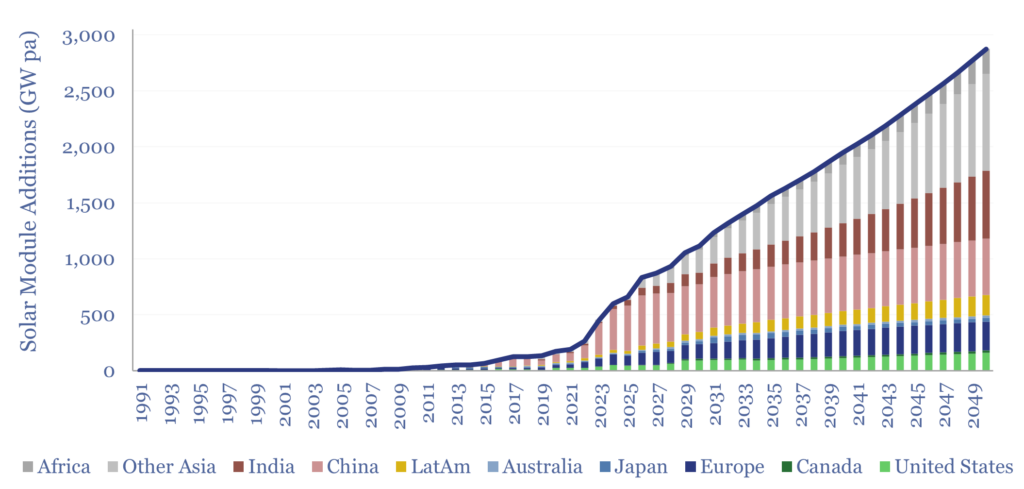
In 2024-25, we added more granular solar forecasts to our model, looking region-by-region, covering the US, Europe, Canada, Japan, Australia, China, India, Africa and Other Asia. Global module additions surpassed 650GW in 2025, which matters for solar module manufacturers and along the solar supply chain. Initially, it looked as though 2026 growth would be weaker, due to a relaxation of Chinese state support, but we have recently raised our numbers due to disruptions in the Middle East, including Qatari LNG. Our numbers can be stress-tested in the ‘SolarShareForecasts’ tab.
In 2025, we added more granular wind forecasts to our model, looking region-by-region, covering the US, Europe, Canada, Japan, Australia, China, India, Africa and Other Asia. Global wind turbine additions flatlined around 130GW in 2024, but do continue rising to 2050, especially in regions with higher capacity factors. This matters for wind turbine manufacturers.
The main data-file also contains breakdowns across four regions (US, Europe, China and ‘rest of world’), a tracker of past growth forecast revisions (which have been revised up by 10x for solar and 3x for wind over the past decade), projections of future load factors, and data on the lifetime of solar assets from technical papers.
Bottlenecks that need to be overcome to reach these incredible growth numbers are not considered in the file, but in our other research, into metals, materials and power grids.
Many commentators like to group wind and solar together, as they are ‘both renewables’. But in our view, they have no more in common than pasta and turnips, whose only real similarity in the world of starches is that they are both not bread. In 2023-25 we have been seeing wind and solar demonstrate very different cost trajectories.
It is realistic for wind and solar to reach 50-60% shares of renewable-heavy grids globally, after assessing where wind and solar will peak, and the potential for solar to unlock its own vast sources of demand.