
The world produced over 600GW of solar modules in 2024, which is up 10x from a decade ago. This data-file breaks down solar module production by company and over time, comparing the companies by solar module selling prices ($/kW), margins (%), efficiency (%), transparency, and technology development.
Solar modules are produced when photovoltaic silicon (model here, company screen here) is sliced into wafers, then processed into cells using semiconductor manufacturing techniques, and then finally combined with front contacts, encapsulants, frames, reinforced glass, backsheets and wiring (cost build-up here).
Six Chinese companies (e.g., Longi, Trina) now produce 60% of the world’s solar modules, with 2024 output of 20-90GW each. Their growth has been enormous, ramping up by 6x in the past half-decade, and doubling their collective market share (chart below).

High levels of competition have always been shown by similar module selling prices across the companies in the screen ($/kW numbers in the data-file), and low EBIT margins (numbers also in the data-file by company).
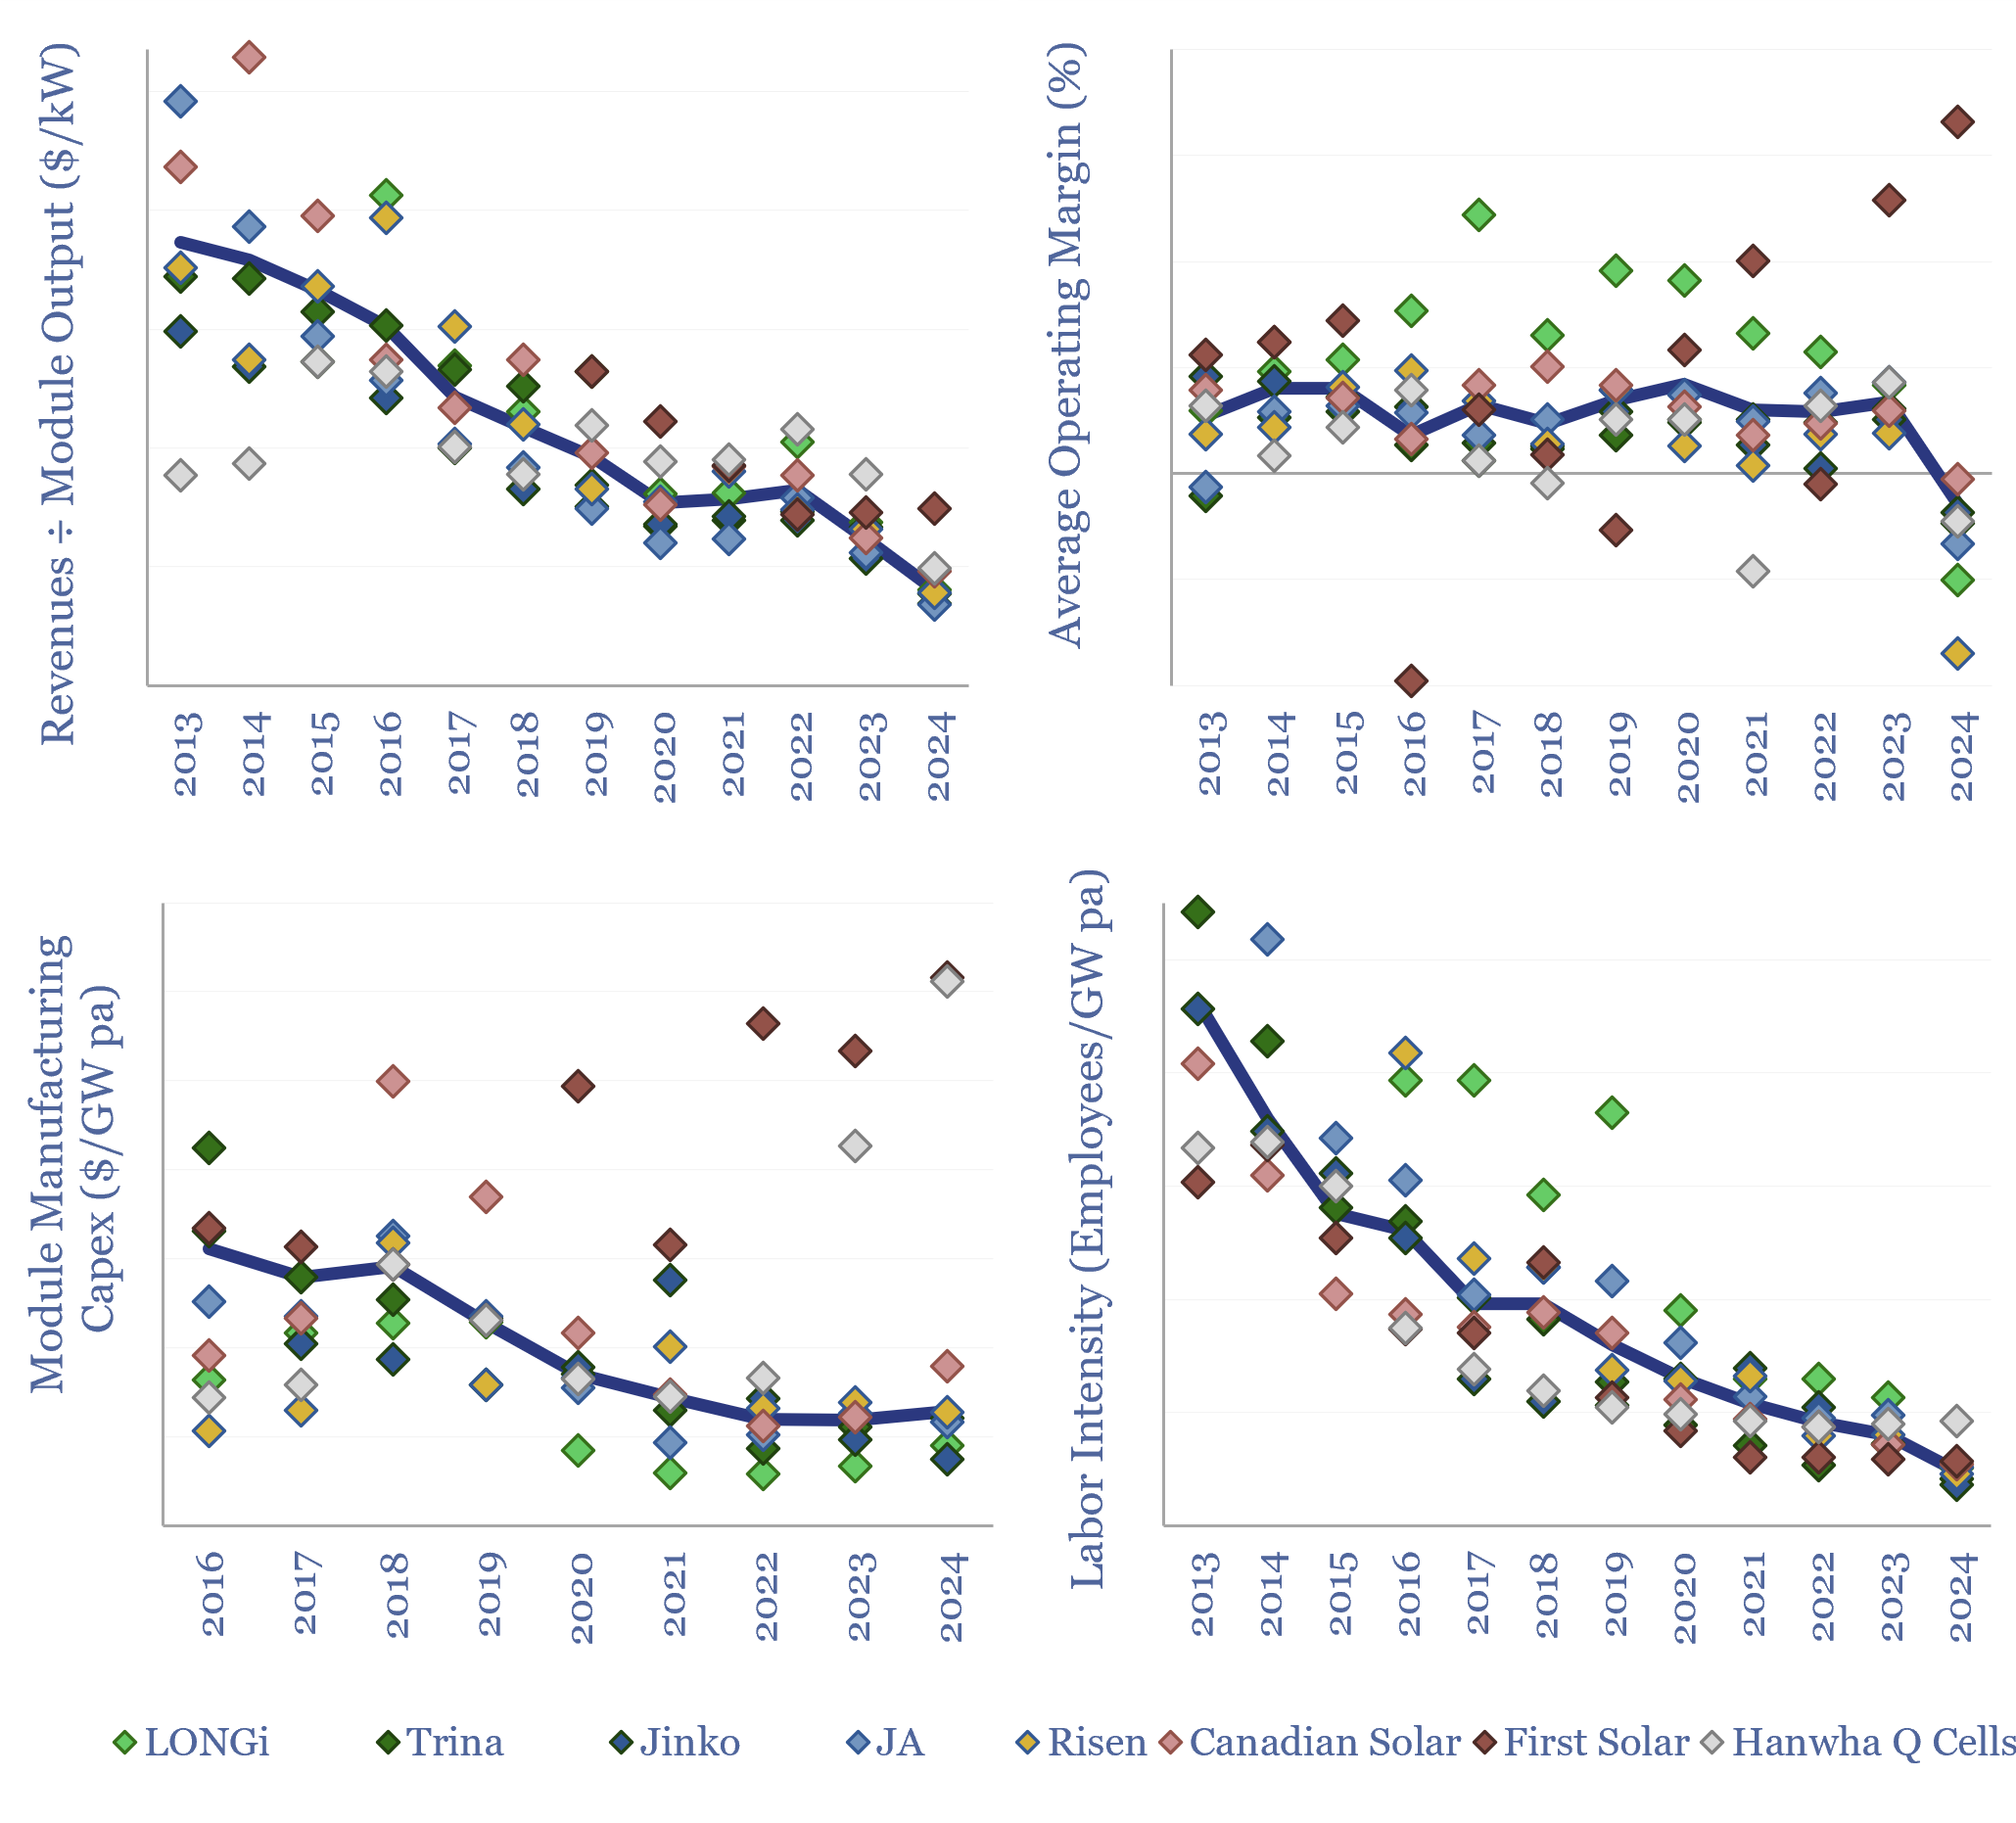
However, the market softened in 2023, then turned into a bloodbath in 2024, due to excess capacity. Implied revenue per kW of sales fell -35% YoY to $160/kW. Operating margins, which averaged 7% in 2023, were negative for every single producer except First Solar. The industry shed -24% of its employee count.
Another trend is the shift from P-type towards N-type solar cells, such as TOPCons, HJTs and potentially also tandem perovskites, in order to boost efficiency. Despite weak industry conditions, investment continued growing, rising +30% YoY. Different numbers are noted for different companies in the data-file.
The full data-file aims to break down solar module production by company, annually, back to 2013, including useful metrics into their revenues per GW of module production, operating margins, capex intensity and labor intensity (charts below).
Companies can be differentiated by their technology focus and their geographic focus, with some prioritizing US expansions, and others retrenching to China.